| Param | Original file | Final file |
|---|---|---|
| Filename | modeM0/AS1A13_049T05_9000006050_45186cztM0_level2.fits | modeM0/AS1A13_049T05_9000006050_45186cztM0_level2_quad_clean.evt |
| Size (bytes) | 453,329,280 | 102,772,800 |
| Size | 432.3 MB | 98.0 MB |
| Events in quadrant A | 4,977,937 | 679,927 |
| Events in quadrant B | 3,443,186 | 711,850 |
| Events in quadrant C | 2,868,412 | 689,979 |
| Events in quadrant D | 5,010,634 | 598,585 |
| Mode M0 | |||
|---|---|---|---|
| Quadrant | BADHDUFLAG | Total packets | Discarded packets |
| A | 0 | 19191 | 1 |
| B | 0 | 14193 | 1 |
| C | 0 | 12781 | 1 |
| D | 0 | 19115 | 1 |
| Mode M9 | |||
|---|---|---|---|
| Quadrant | BADHDUFLAG | Total packets | Discarded packets |
| A | 0 | 10 | 0 |
| B | 0 | 10 | 0 |
| C | 0 | 10 | 0 |
| D | 0 | 10 | 0 |
| Mode SS | |||
|---|---|---|---|
| Quadrant | BADHDUFLAG | Total packets | Discarded packets |
| A | 0 | 124 | 0 |
| B | 0 | 124 | 0 |
| C | 0 | 124 | 0 |
| D | 0 | 124 | 0 |
| Quadrant | Total seconds | Saturated seconds | Saturation percentage |
|---|---|---|---|
| A | 6190 | 159 | 2.568659% |
| B | 6189 | 132 | 2.132816% |
| C | 6189 | 57 | 0.920989% |
| D | 6190 | 452 | 7.302100% |
Noise dominated data is calculated using 1-second bins in cleaned event files. If a bin has >2000 counts, and if more than 50% of those come from <1% of pixels, then it is considered to be noise-dominated and hence unusable.
| Quadrant | # 1 sec bins | Bins with >0 counts | Bins with >2000 counts | High rate bins dominated by noise | Noise dominated (total time) | Noise dominated (detector-on time) | Marked lightcurve |
|---|---|---|---|---|---|---|---|
| A | 7165 | 6191 | 4 | 4 | 0.06% | 0.06% | 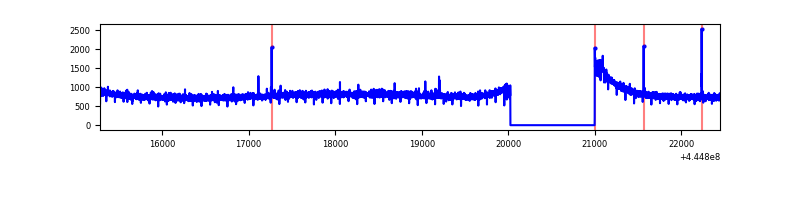 |
| B | 7164 | 6190 | 23 | 23 | 0.32% | 0.37% | 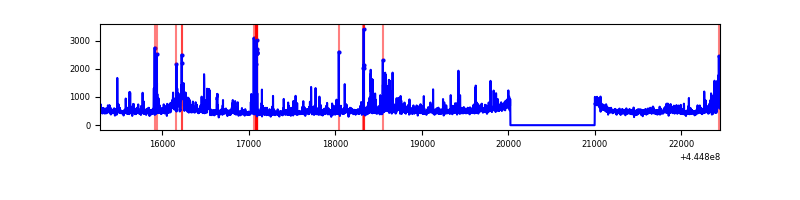 |
| C | 7164 | 6190 | 2 | 2 | 0.03% | 0.03% | 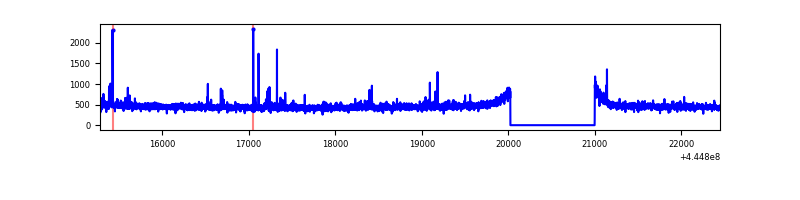 |
| D | 7165 | 6190 | 340 | 340 | 4.75% | 5.49% | 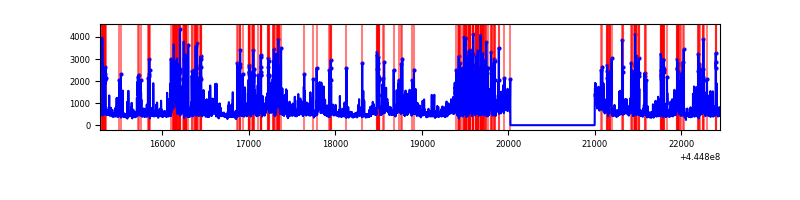 |
Top three noisy pixels from each quadrant. If the there are fewer than three noisy pixels in the level2.evt file, extra rows are filled as -1
| Pixel properties | Quadrant properties | ||||||
|---|---|---|---|---|---|---|---|
| Quadrant | DetID | PixID | Counts | Sigma | Mean | Median | Sigma |
| A | 10 | 83 | 2205552 | 14977.05 | 710 | 695 | 147.2 |
| A | 0 | 243 | 10305 | 65.28 | 710 | 695 | 147.2 |
| A | 3 | 137 | 7812 | 48.34 | 710 | 695 | 147.2 |
| B | 4 | 170 | 265392 | 1906.88 | 709 | 688 | 138.8 |
| B | 3 | 112 | 129084 | 924.94 | 709 | 688 | 138.8 |
| B | 5 | 32 | 101303 | 724.81 | 709 | 688 | 138.8 |
| C | 3 | 233 | 46073 | 271.63 | 711 | 714 | 167.0 |
| C | 14 | 254 | 20432 | 118.08 | 711 | 714 | 167.0 |
| C | 12 | 2 | 17857 | 102.66 | 711 | 714 | 167.0 |
| D | 13 | 249 | 1308379 | 7674.08 | 688 | 668 | 170.4 |
| D | 13 | 171 | 227450 | 1330.83 | 688 | 668 | 170.4 |
| D | 2 | 249 | 139356 | 813.87 | 688 | 668 | 170.4 |
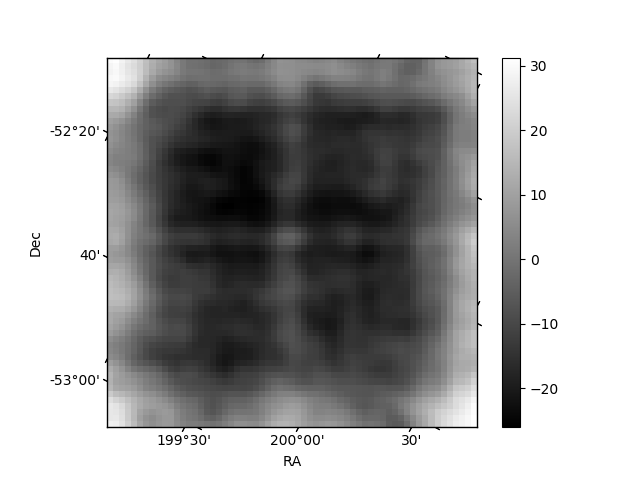
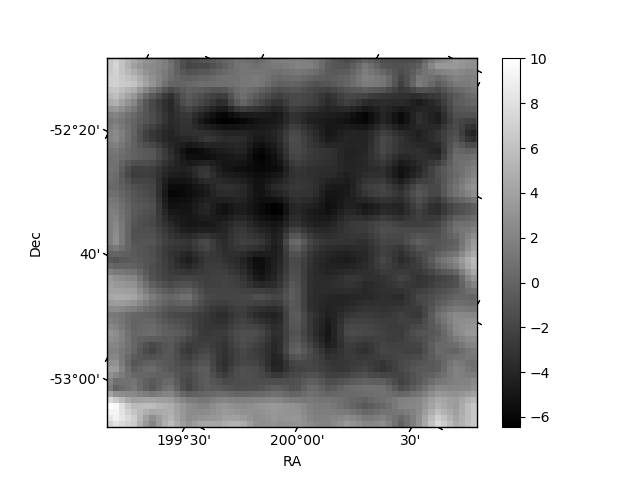
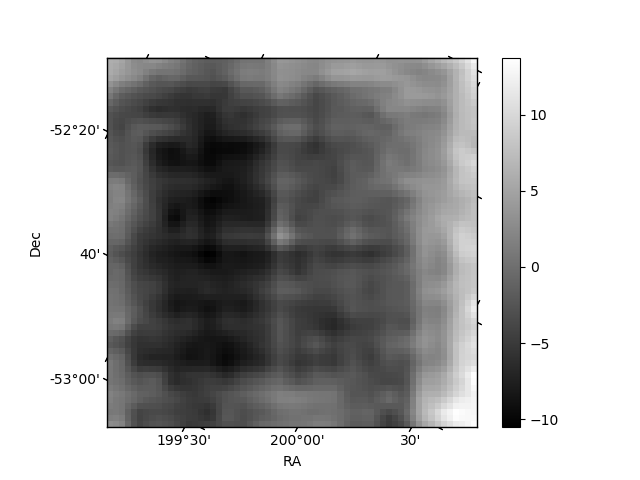
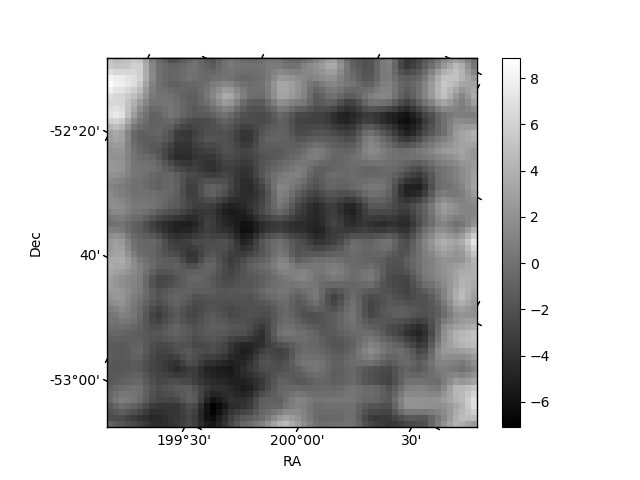
Histogram calculated using DETX and DETY for each event in the final _common_clean file
| Quadrant A | 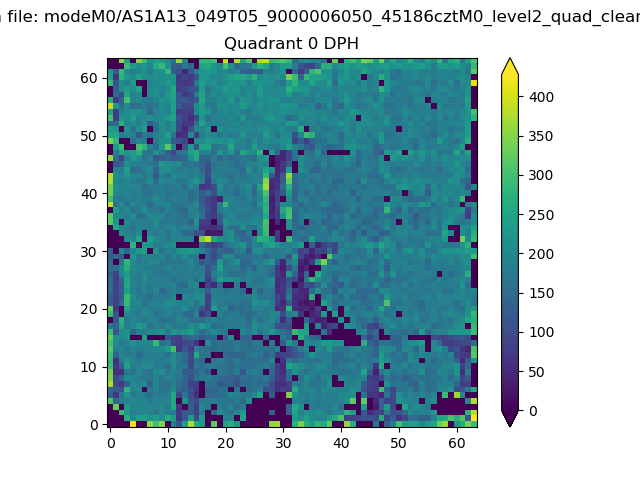 |
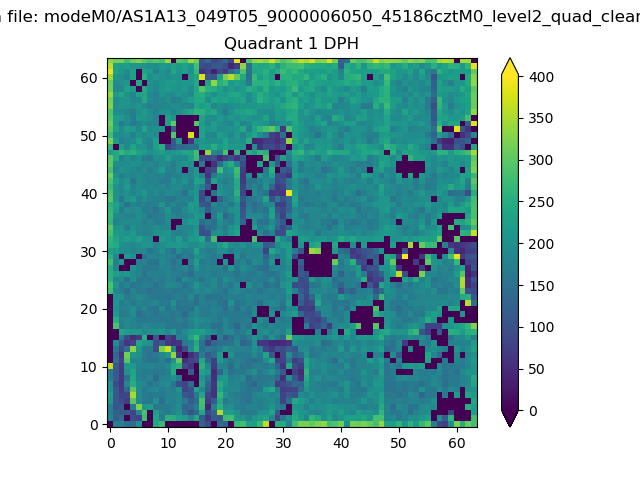 |
Quadrant B |
|---|---|---|---|
| Quadrant D | 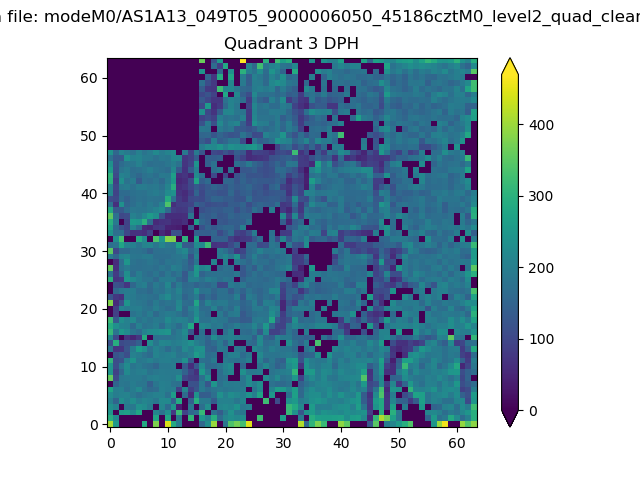 |
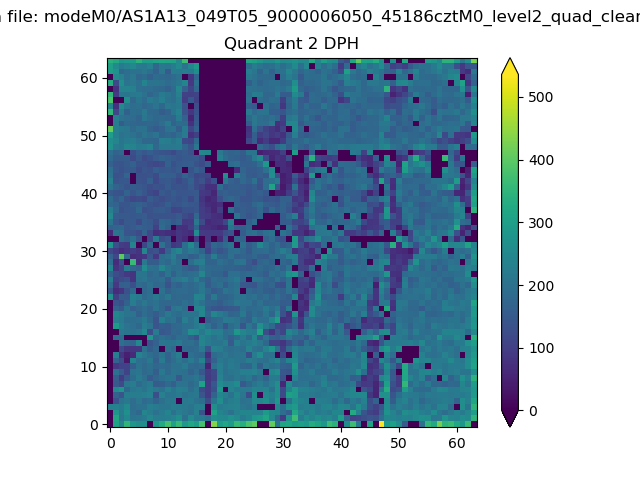 |
Quadrant C |
| Plot type | Count rate plots | Images |
|---|---|---|
| Comparison with Poisson distribution Blue bars denote a histogram of data divided into 1 sec bins. Red curve is a Poisson curve with rate = median count rate of data. |
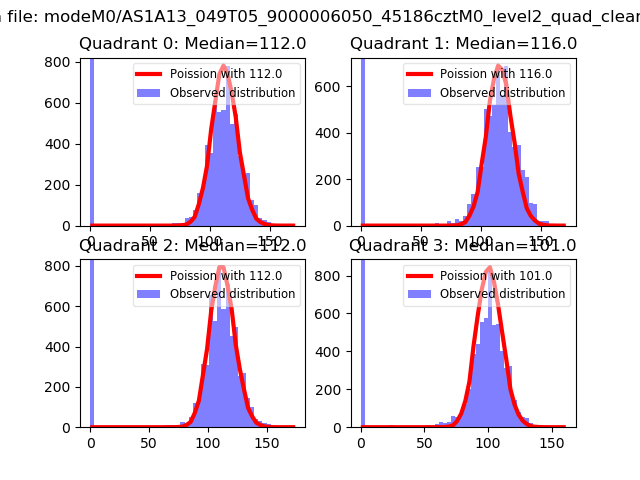 |
 |
| Quadrant-wise count rates Data is divided into 100 sec bins |
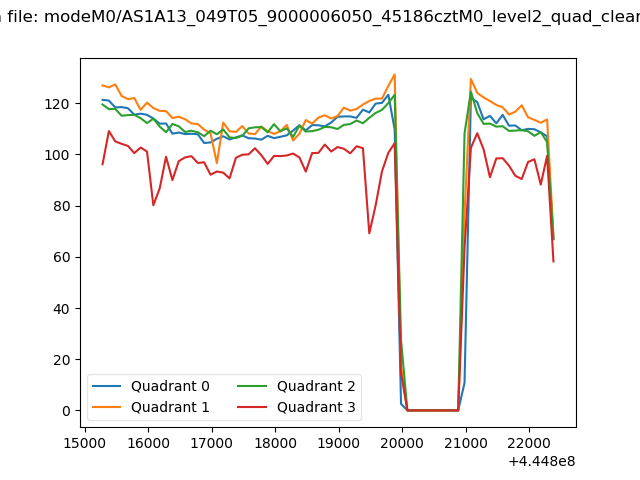 |
|
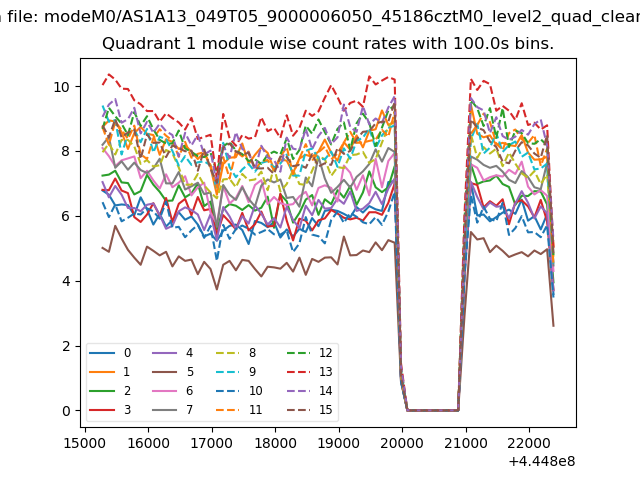
| Module-wise count rates for Quadrant A Data is divided into 100 sec bins |
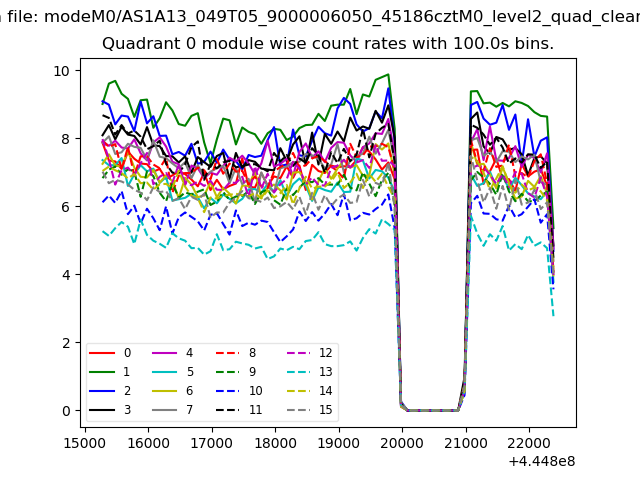 |
 |
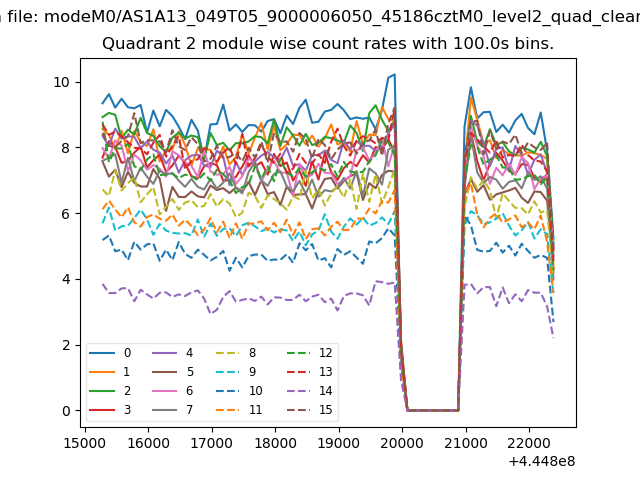
| Module-wise count rates for Quadrant B Data is divided into 100 sec bins |
 |
 |
| Module-wise count rates for Quadrant C Data is divided into 100 sec bins |
 |
 |
| Module-wise count rates for Quadrant D Data is divided into 100 sec bins |
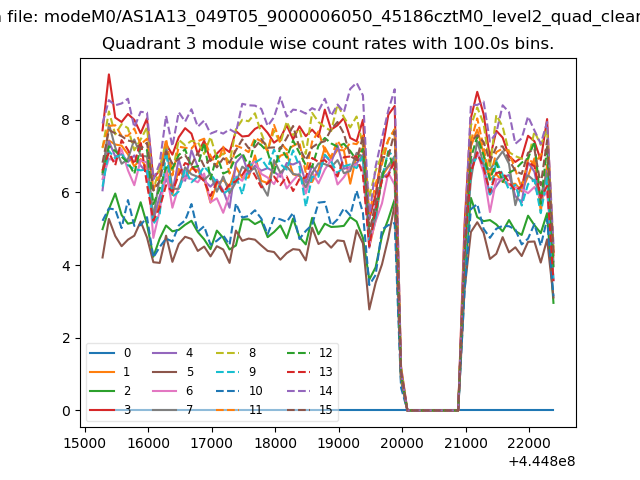 |
 |
| Parameter | Plot |
|---|---|
| CZT HV Monitor | 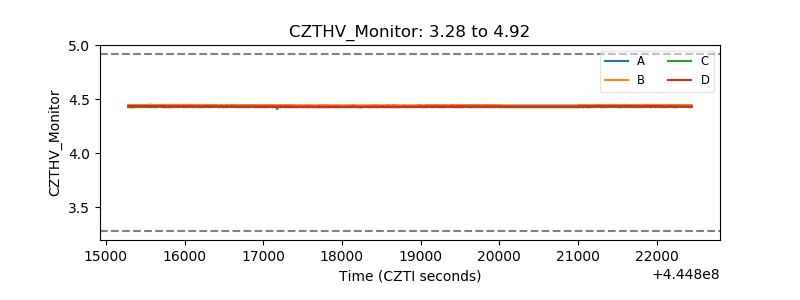 |
| D_VDD | 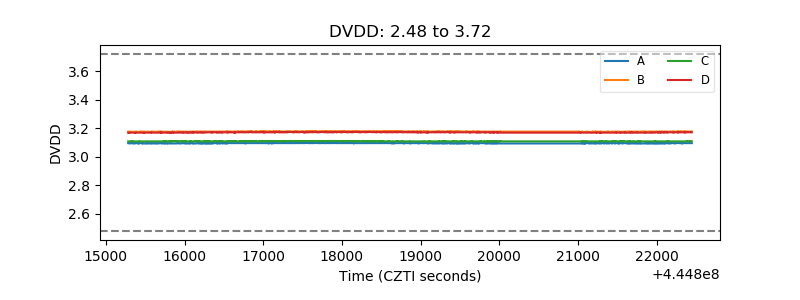 |
| Temperature 1 | 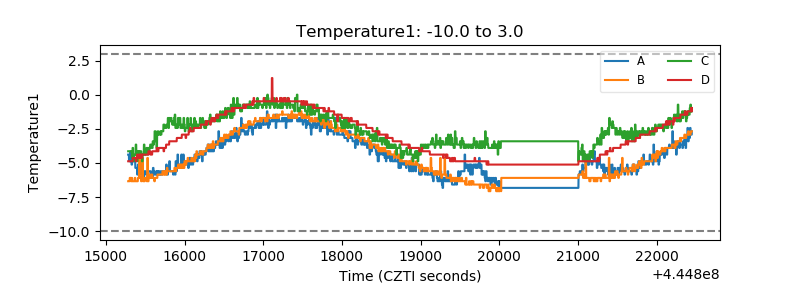 |
| Veto HV Monitor | 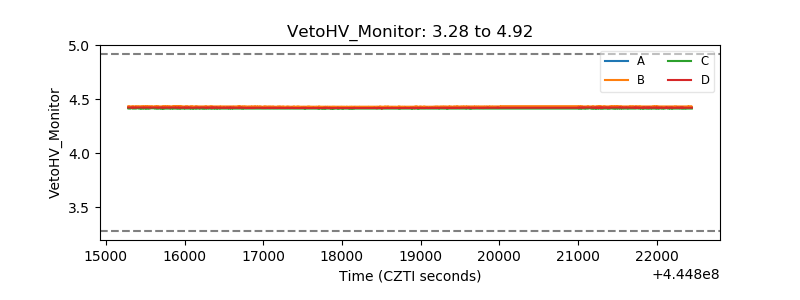 |
| Veto LLD | 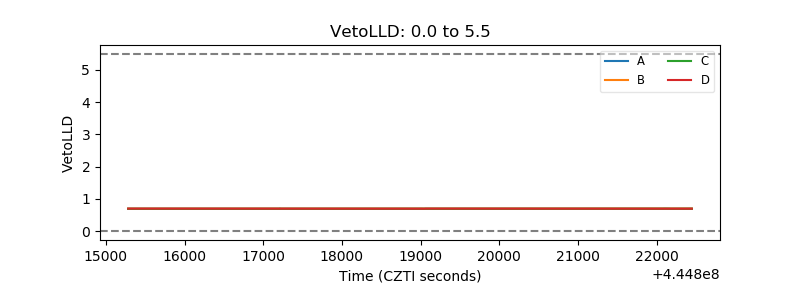 |
| Alpha Counter | 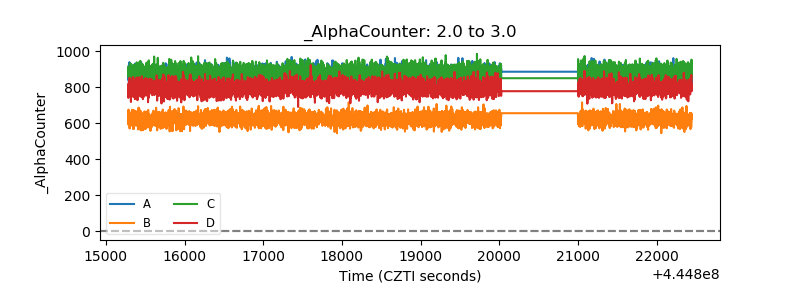 |
| _CPM_Rate | 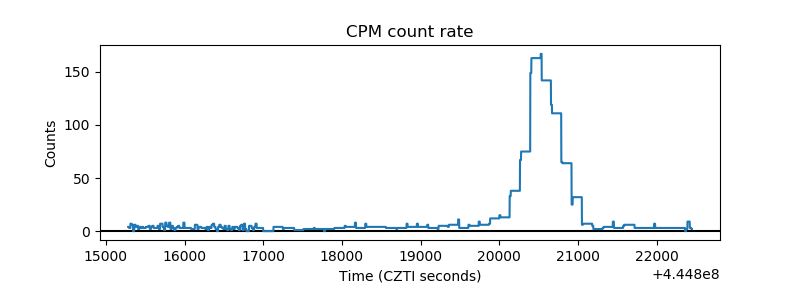 |
| CZT Counter | 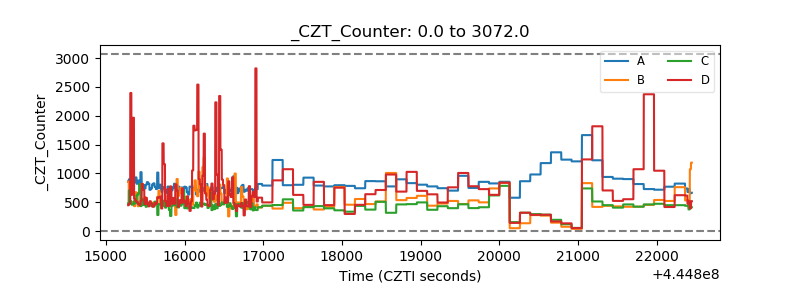 |
| +2.5 Volts monitor | 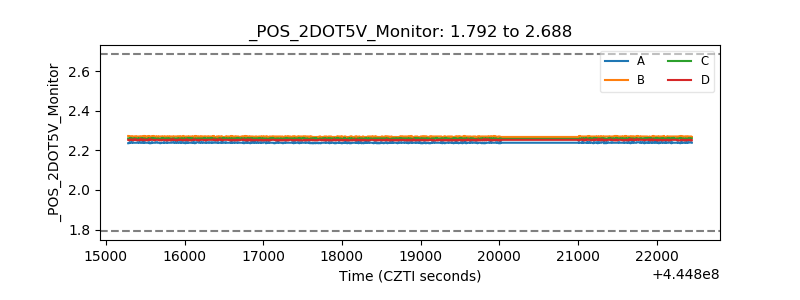 |
| +5 Volts monitor |  |
| _ROLL_ROT | 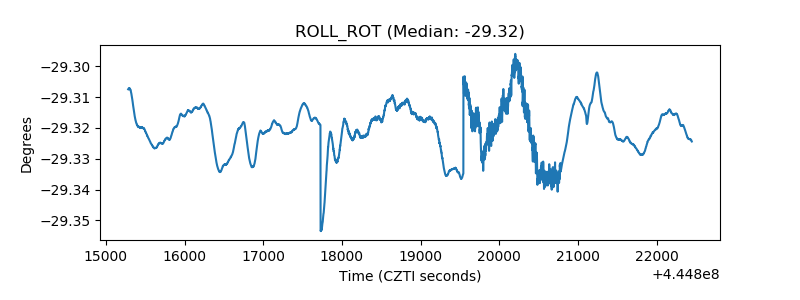 |
| _Roll_DEC | 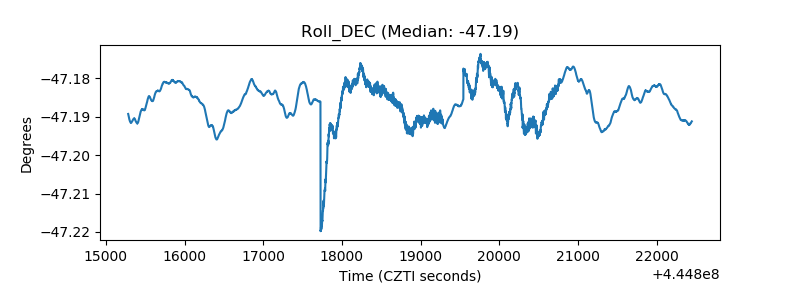 |
| _Roll_RA | 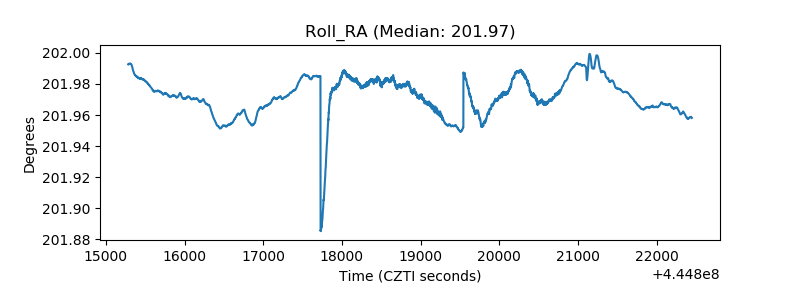 |
| Veto Counter | 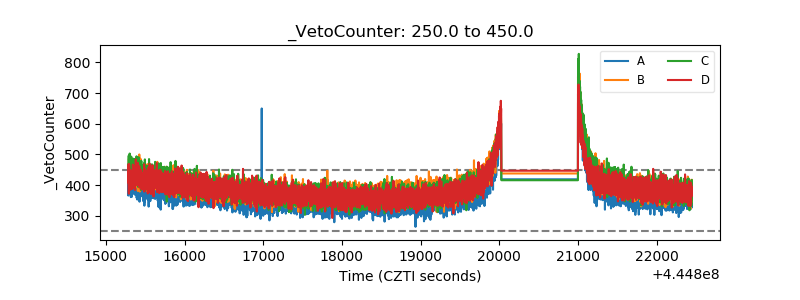 |