| Param | Original file | Final file |
|---|---|---|
| Filename | modeM0/AS1A13_049T05_9000006050_45187cztM0_level2.fits | modeM0/AS1A13_049T05_9000006050_45187cztM0_level2_quad_clean.evt |
| Size (bytes) | 521,300,160 | 113,186,880 |
| Size | 497.2 MB | 107.9 MB |
| Events in quadrant A | 5,702,574 | 745,311 |
| Events in quadrant B | 3,931,808 | 773,274 |
| Events in quadrant C | 3,306,829 | 755,462 |
| Events in quadrant D | 5,808,293 | 661,606 |
| Mode M0 | |||
|---|---|---|---|
| Quadrant | BADHDUFLAG | Total packets | Discarded packets |
| A | 0 | 22042 | 1 |
| B | 0 | 16290 | 1 |
| C | 0 | 14798 | 1 |
| D | 0 | 22141 | 1 |
| Mode M9 | |||
|---|---|---|---|
| Quadrant | BADHDUFLAG | Total packets | Discarded packets |
| A | 0 | 6 | 0 |
| B | 0 | 6 | 0 |
| C | 0 | 6 | 0 |
| D | 0 | 6 | 0 |
| Mode SS | |||
|---|---|---|---|
| Quadrant | BADHDUFLAG | Total packets | Discarded packets |
| A | 0 | 144 | 0 |
| B | 0 | 144 | 0 |
| C | 0 | 144 | 0 |
| D | 0 | 144 | 0 |
| Quadrant | Total seconds | Saturated seconds | Saturation percentage |
|---|---|---|---|
| A | 7055 | 251 | 3.557760% |
| B | 7055 | 259 | 3.671155% |
| C | 7055 | 140 | 1.984408% |
| D | 7055 | 524 | 7.427356% |
Noise dominated data is calculated using 1-second bins in cleaned event files. If a bin has >2000 counts, and if more than 50% of those come from <1% of pixels, then it is considered to be noise-dominated and hence unusable.
| Quadrant | # 1 sec bins | Bins with >0 counts | Bins with >2000 counts | High rate bins dominated by noise | Noise dominated (total time) | Noise dominated (detector-on time) | Marked lightcurve |
|---|---|---|---|---|---|---|---|
| A | 7645 | 7055 | 9 | 9 | 0.12% | 0.13% | 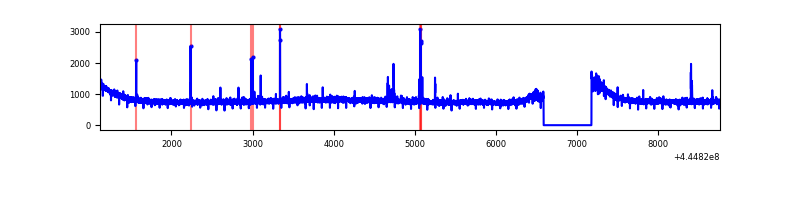 |
| B | 7645 | 7055 | 38 | 38 | 0.50% | 0.54% | 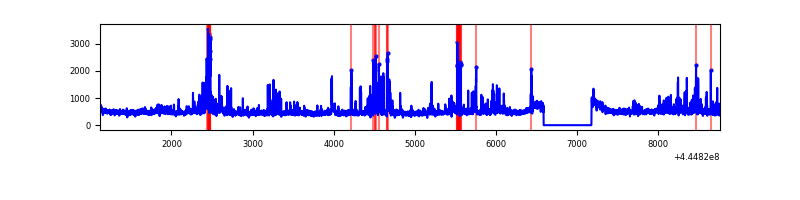 |
| C | 7645 | 7056 | 4 | 4 | 0.05% | 0.06% | 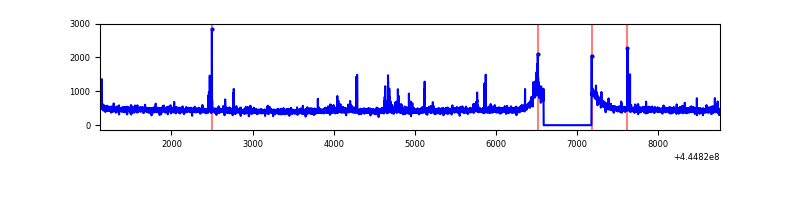 |
| D | 7645 | 7055 | 368 | 368 | 4.81% | 5.22% |  |
Top three noisy pixels from each quadrant. If the there are fewer than three noisy pixels in the level2.evt file, extra rows are filled as -1
| Pixel properties | Quadrant properties | ||||||
|---|---|---|---|---|---|---|---|
| Quadrant | DetID | PixID | Counts | Sigma | Mean | Median | Sigma |
| A | 10 | 83 | 2505884 | 15007.39 | 803 | 782 | 166.9 |
| A | 15 | 174 | 18670 | 107.16 | 803 | 782 | 166.9 |
| A | 0 | 243 | 16721 | 95.49 | 803 | 782 | 166.9 |
| B | 4 | 170 | 457736 | 2873.77 | 804 | 775 | 159.0 |
| B | 3 | 112 | 145657 | 911.15 | 804 | 775 | 159.0 |
| B | 5 | 32 | 72316 | 449.91 | 804 | 775 | 159.0 |
| C | 3 | 233 | 99178 | 522.54 | 802 | 807 | 188.3 |
| C | 12 | 2 | 32384 | 167.73 | 802 | 807 | 188.3 |
| C | 14 | 254 | 26438 | 136.15 | 802 | 807 | 188.3 |
| D | 13 | 249 | 1470962 | 7569.71 | 781 | 756 | 194.2 |
| D | 9 | 49 | 511126 | 2627.76 | 781 | 756 | 194.2 |
| D | 1 | 47 | 279193 | 1433.6 | 781 | 756 | 194.2 |
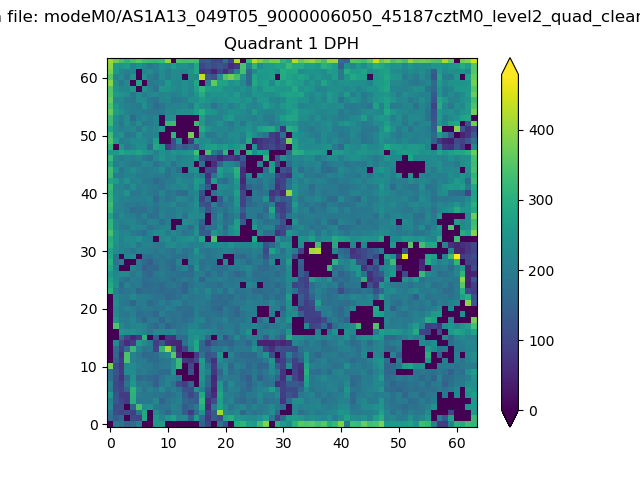
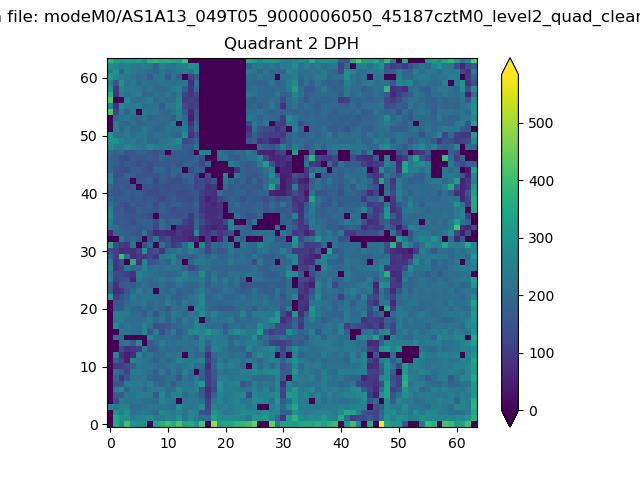
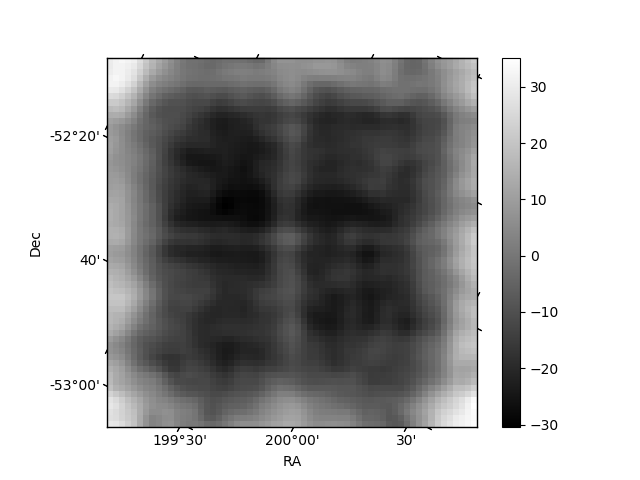
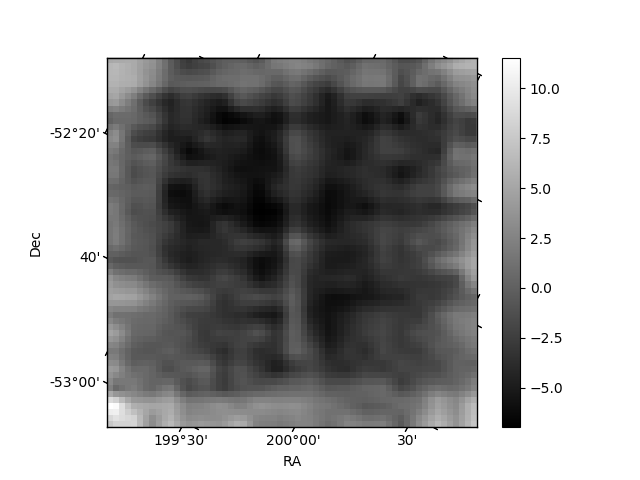
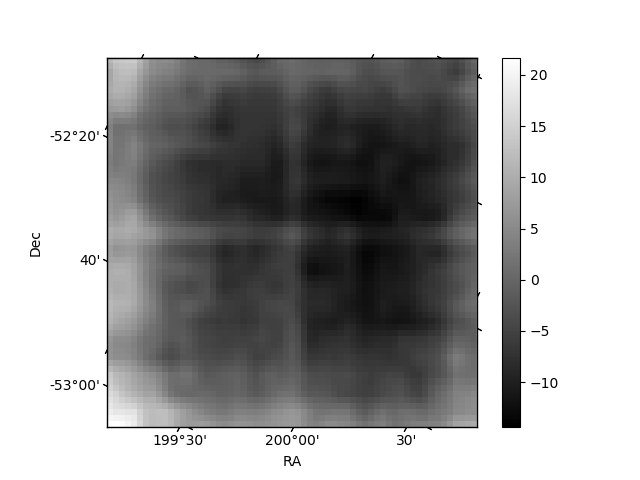
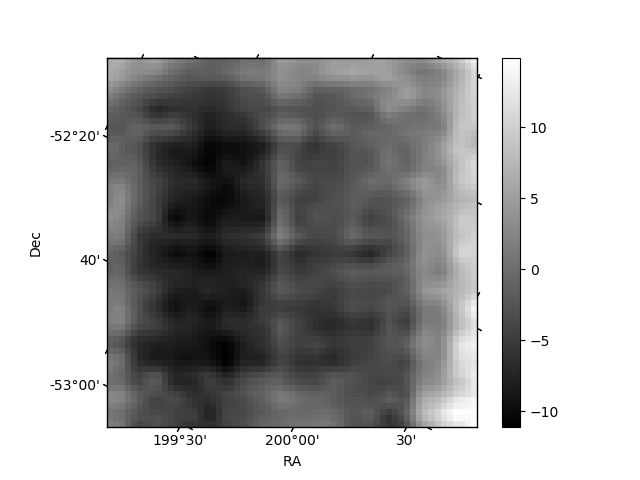
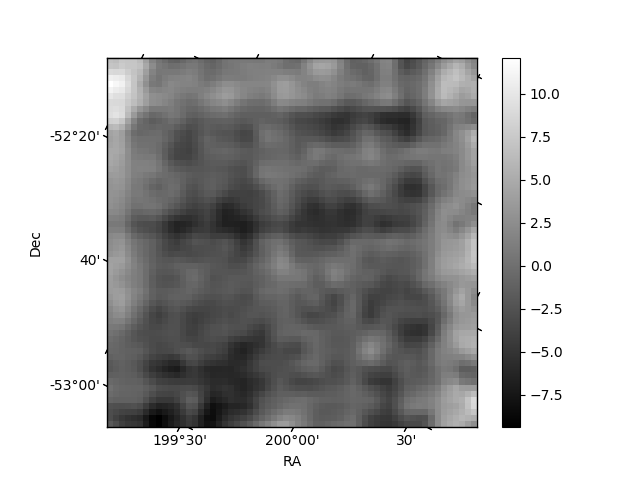
Histogram calculated using DETX and DETY for each event in the final _common_clean file
| Quadrant A | 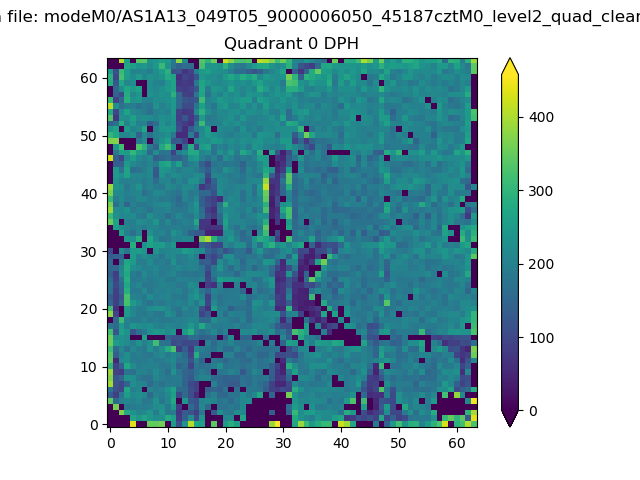 |
 |
Quadrant B |
|---|---|---|---|
| Quadrant D | 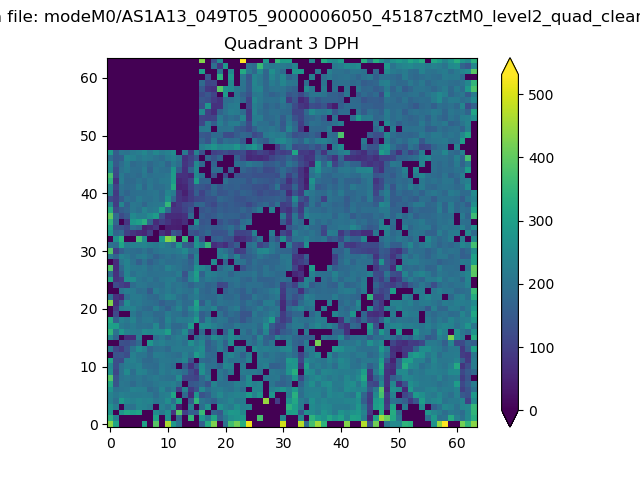 |
 |
Quadrant C |
| Plot type | Count rate plots | Images |
|---|---|---|
| Comparison with Poisson distribution Blue bars denote a histogram of data divided into 1 sec bins. Red curve is a Poisson curve with rate = median count rate of data. |
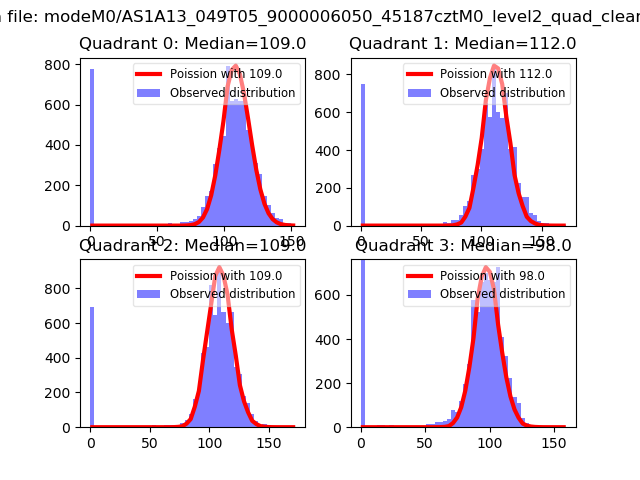 |
 |
| Quadrant-wise count rates Data is divided into 100 sec bins |
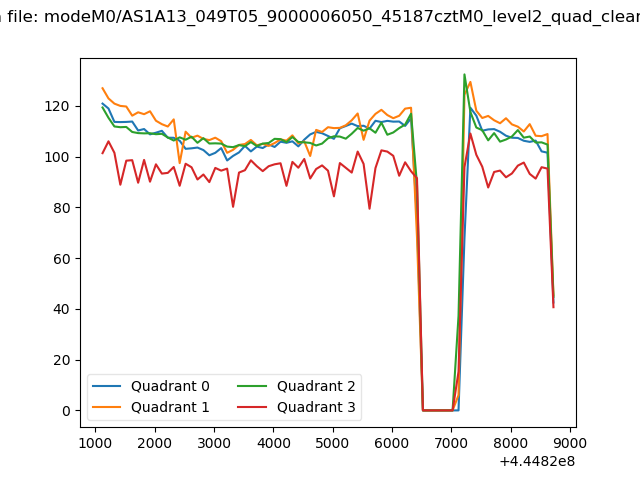 |
|
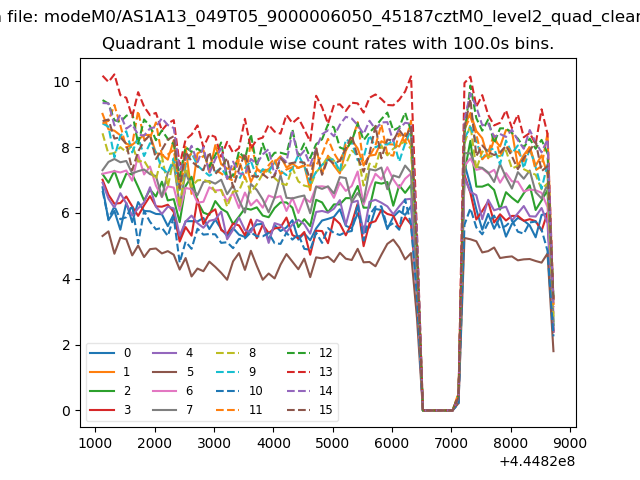
| Module-wise count rates for Quadrant A Data is divided into 100 sec bins |
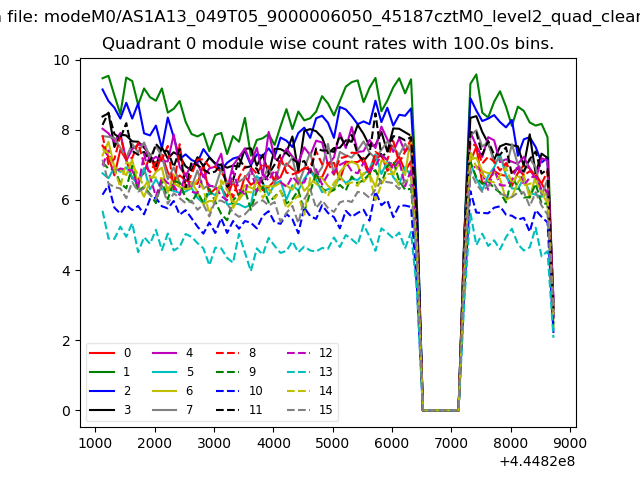 |
 |
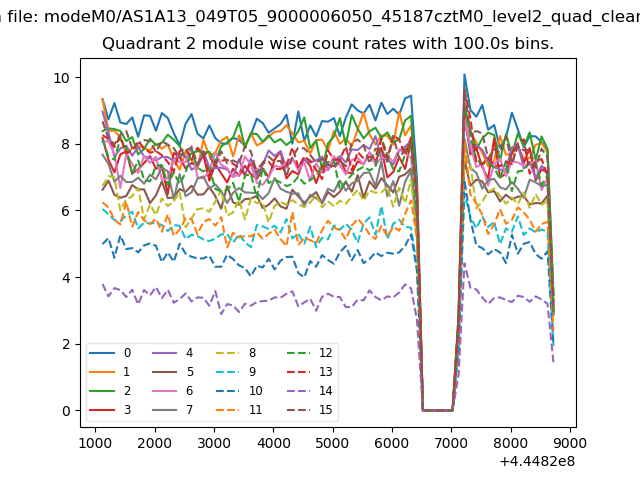
| Module-wise count rates for Quadrant B Data is divided into 100 sec bins |
 |
 |
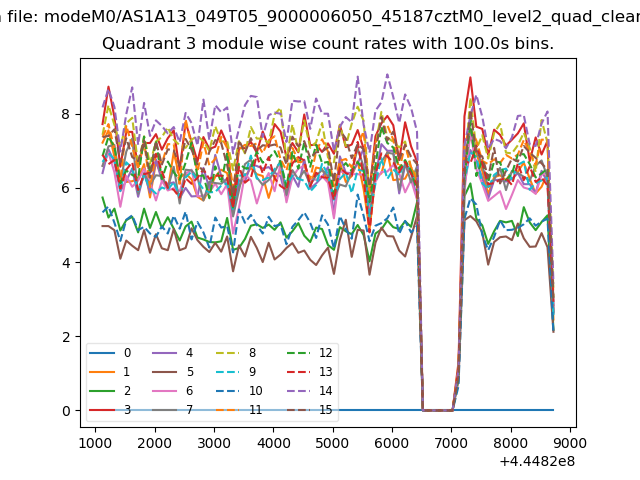
| Module-wise count rates for Quadrant C Data is divided into 100 sec bins |
 |
 |
| Module-wise count rates for Quadrant D Data is divided into 100 sec bins |
 |
 |
| Parameter | Plot |
|---|---|
| CZT HV Monitor | 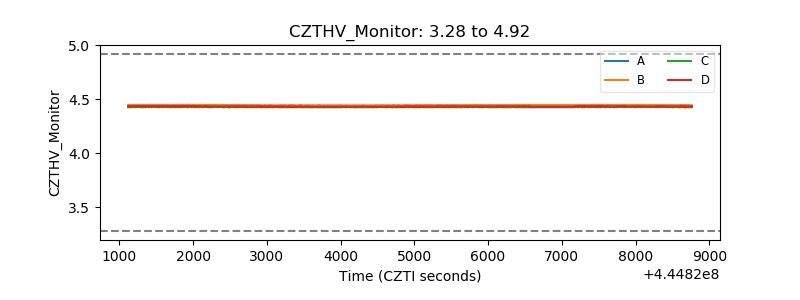 |
| D_VDD | 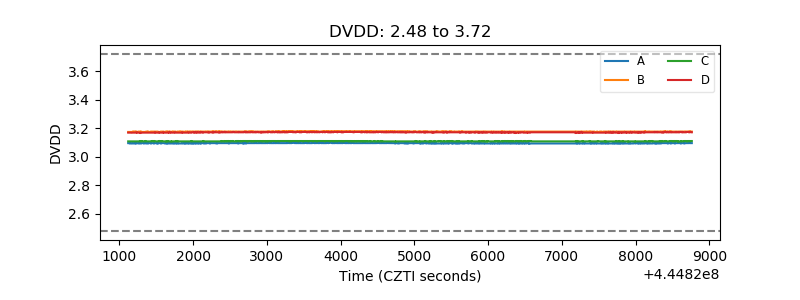 |
| Temperature 1 | 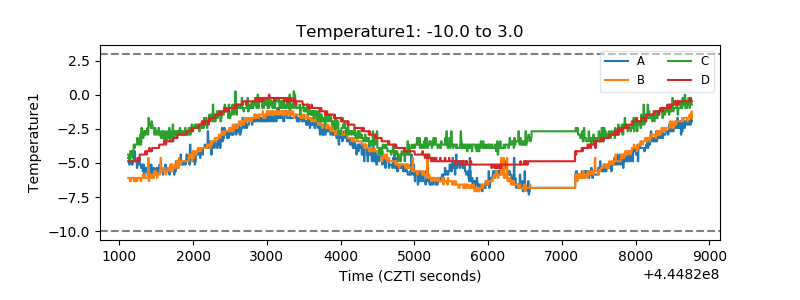 |
| Veto HV Monitor | 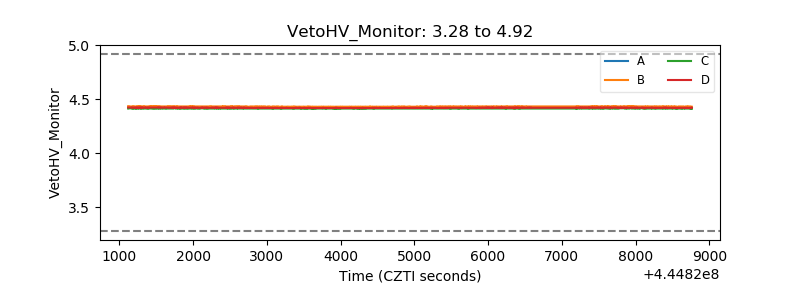 |
| Veto LLD | 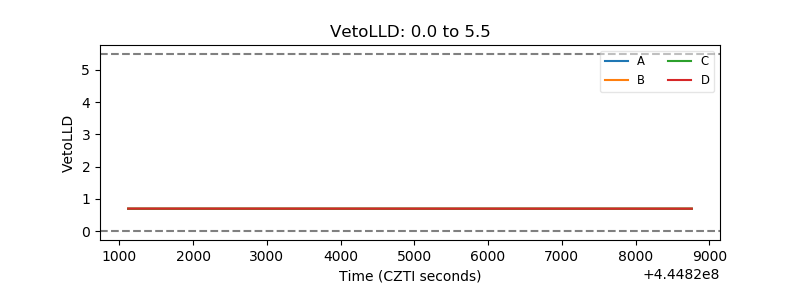 |
| Alpha Counter | 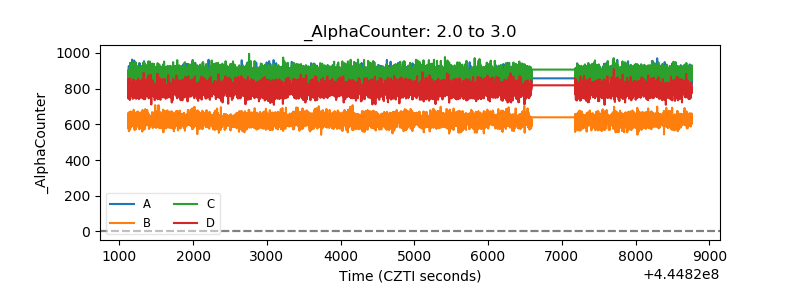 |
| _CPM_Rate | 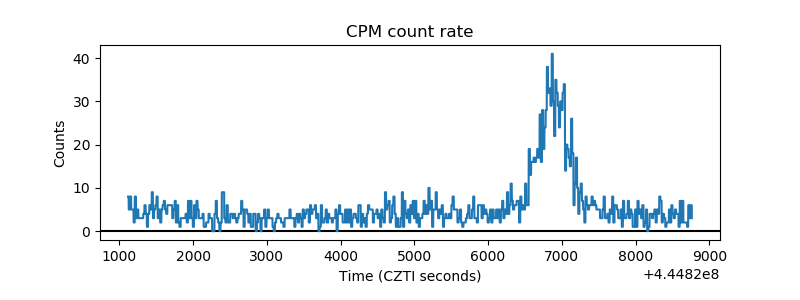 |
| CZT Counter | 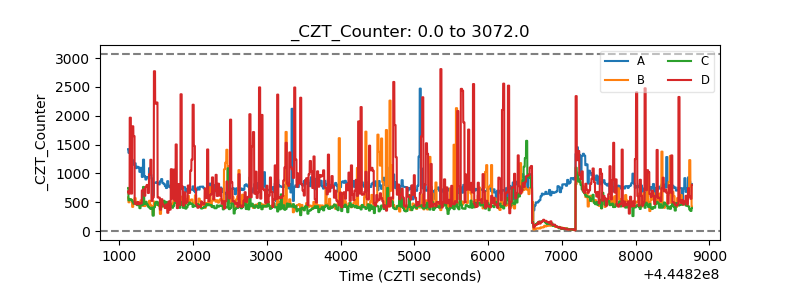 |
| +2.5 Volts monitor | 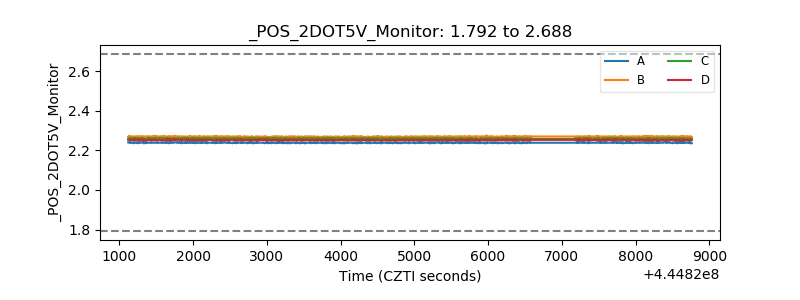 |
| +5 Volts monitor | 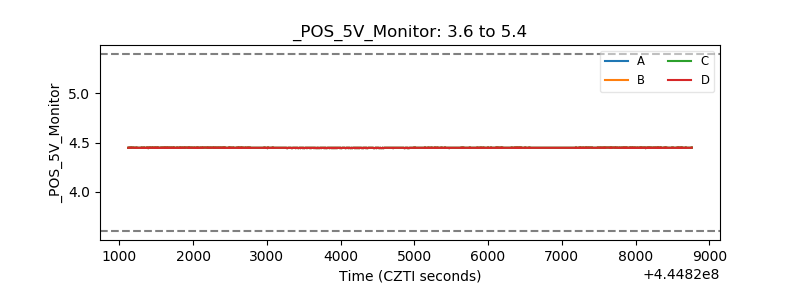 |
| _ROLL_ROT | 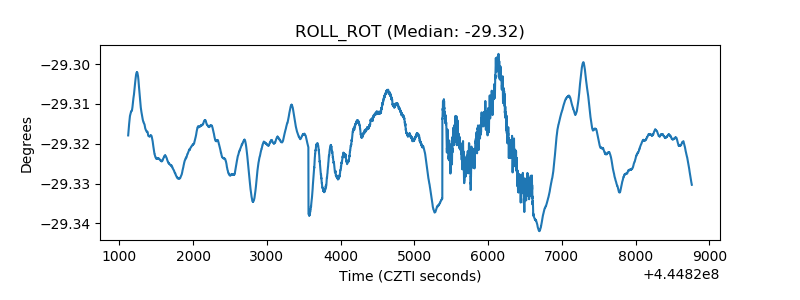 |
| _Roll_DEC | 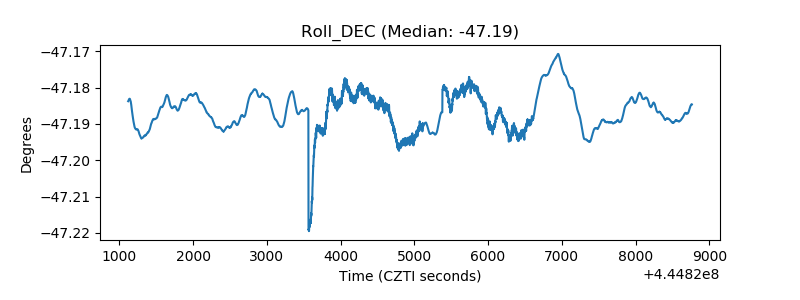 |
| _Roll_RA | 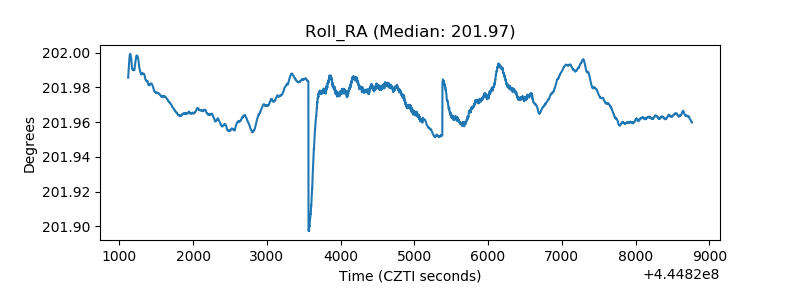 |
| Veto Counter | 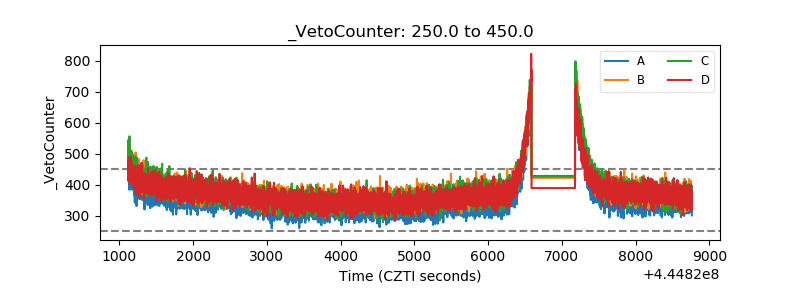 |