| Param | Original file | Final file |
|---|---|---|
| Filename | modeM0/AS1A13_049T05_9000006050_45188cztM0_level2.fits | modeM0/AS1A13_049T05_9000006050_45188cztM0_level2_quad_clean.evt |
| Size (bytes) | 293,037,120 | 57,882,240 |
| Size | 279.5 MB | 55.2 MB |
| Events in quadrant A | 3,006,692 | 379,888 |
| Events in quadrant B | 2,144,122 | 394,617 |
| Events in quadrant C | 1,650,626 | 392,826 |
| Events in quadrant D | 3,758,276 | 324,333 |
| Mode M0 | |||
|---|---|---|---|
| Quadrant | BADHDUFLAG | Total packets | Discarded packets |
| A | 0 | 11498 | 1 |
| B | 0 | 8756 | 1 |
| C | 0 | 7631 | 1 |
| D | 0 | 13710 | 1 |
| Mode M9 | |||
|---|---|---|---|
| Quadrant | BADHDUFLAG | Total packets | Discarded packets |
| A | 0 | 3 | 0 |
| B | 0 | 3 | 0 |
| C | 0 | 4 | 0 |
| D | 0 | 4 | 0 |
| Mode SS | |||
|---|---|---|---|
| Quadrant | BADHDUFLAG | Total packets | Discarded packets |
| A | 0 | 74 | 0 |
| B | 0 | 74 | 0 |
| C | 0 | 74 | 0 |
| D | 0 | 74 | 0 |
| Quadrant | Total seconds | Saturated seconds | Saturation percentage |
|---|---|---|---|
| A | 3688 | 116 | 3.145336% |
| B | 3688 | 96 | 2.603037% |
| C | 3688 | 34 | 0.921909% |
| D | 3688 | 470 | 12.744035% |
Noise dominated data is calculated using 1-second bins in cleaned event files. If a bin has >2000 counts, and if more than 50% of those come from <1% of pixels, then it is considered to be noise-dominated and hence unusable.
| Quadrant | # 1 sec bins | Bins with >0 counts | Bins with >2000 counts | High rate bins dominated by noise | Noise dominated (total time) | Noise dominated (detector-on time) | Marked lightcurve |
|---|---|---|---|---|---|---|---|
| A | 3688 | 3688 | 0 | 0 | 0.00% | 0.00% | 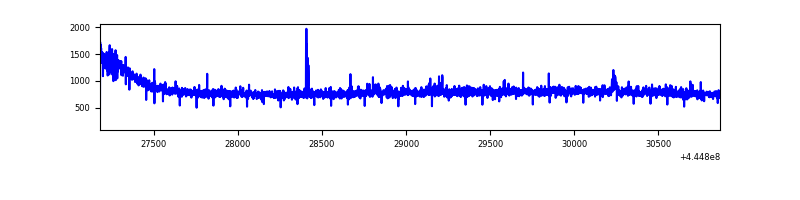 |
| B | 3688 | 3688 | 17 | 17 | 0.46% | 0.46% | 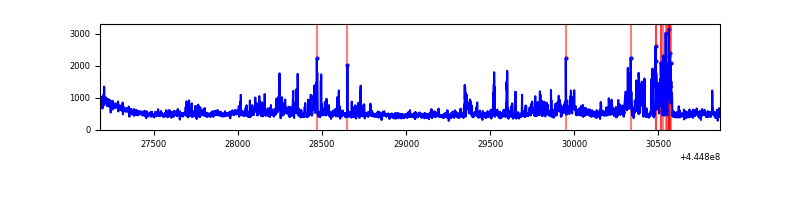 |
| C | 3688 | 3688 | 2 | 2 | 0.05% | 0.05% | 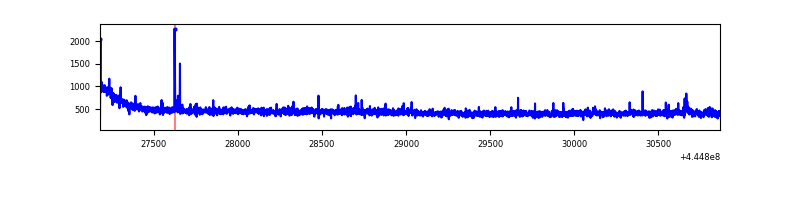 |
| D | 3688 | 3688 | 388 | 388 | 10.52% | 10.52% | 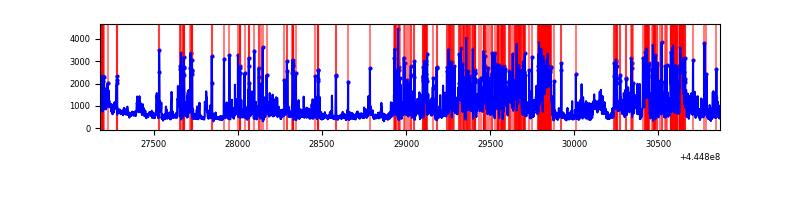 |
Top three noisy pixels from each quadrant. If the there are fewer than three noisy pixels in the level2.evt file, extra rows are filled as -1
| Pixel properties | Quadrant properties | ||||||
|---|---|---|---|---|---|---|---|
| Quadrant | DetID | PixID | Counts | Sigma | Mean | Median | Sigma |
| A | 10 | 83 | 1370478 | 15832.82 | 411 | 401 | 86.5 |
| A | 0 | 243 | 15417 | 173.53 | 411 | 401 | 86.5 |
| A | 4 | 0 | 8785 | 96.89 | 411 | 401 | 86.5 |
| B | 3 | 112 | 195079 | 2340.79 | 411 | 399 | 83.2 |
| B | 4 | 170 | 194193 | 2330.13 | 411 | 399 | 83.2 |
| B | 5 | 32 | 70957 | 848.37 | 411 | 399 | 83.2 |
| C | 3 | 233 | 26500 | 269.44 | 408 | 410 | 96.8 |
| C | 12 | 2 | 15421 | 155.02 | 408 | 410 | 96.8 |
| C | 14 | 254 | 8657 | 85.17 | 408 | 410 | 96.8 |
| D | 13 | 249 | 1484360 | 14994.92 | 391 | 378 | 99.0 |
| D | 9 | 49 | 218865 | 2207.71 | 391 | 378 | 99.0 |
| D | 1 | 47 | 196568 | 1982.41 | 391 | 378 | 99.0 |
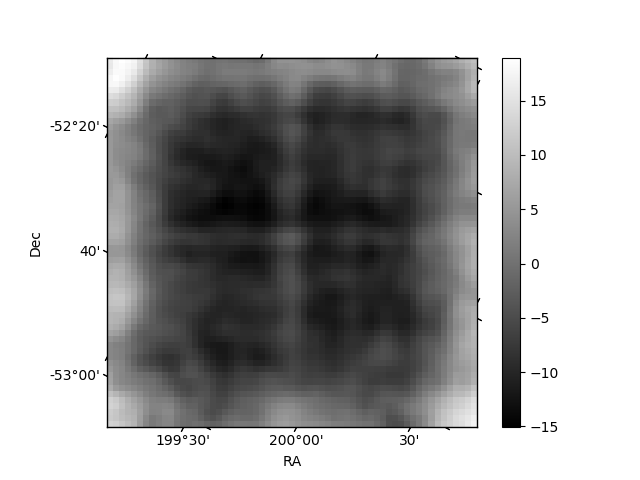
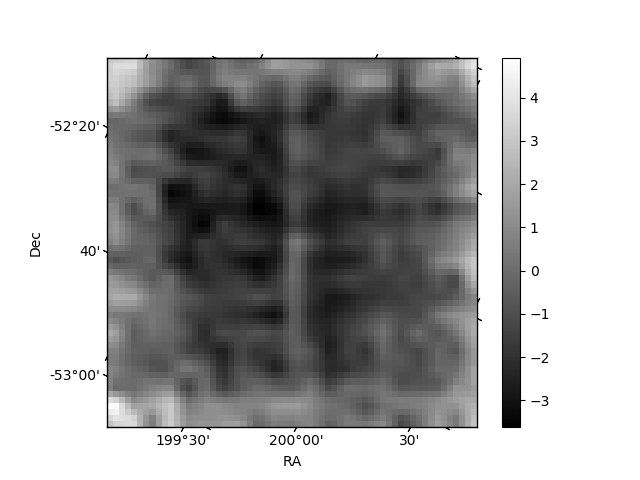
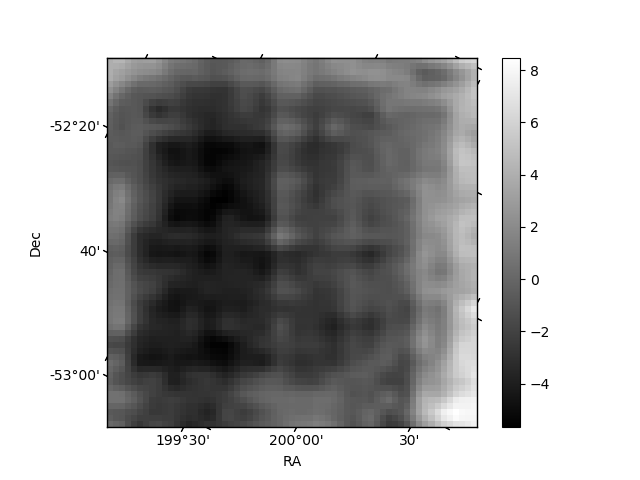
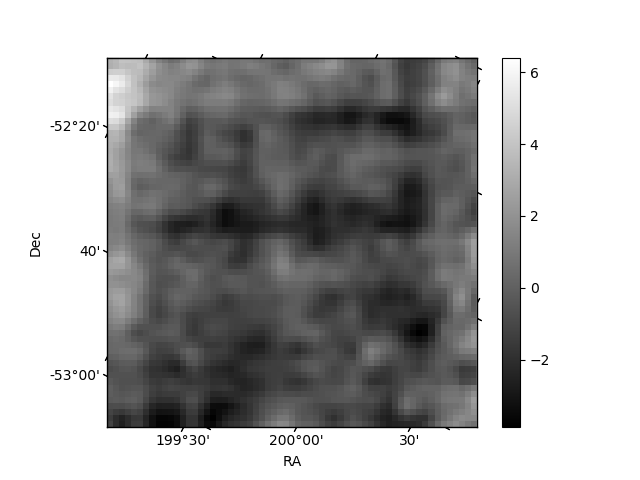
Histogram calculated using DETX and DETY for each event in the final _common_clean file
| Quadrant A | 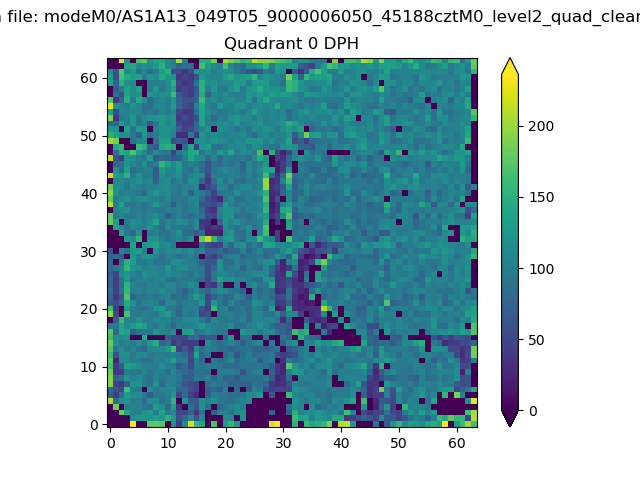 |
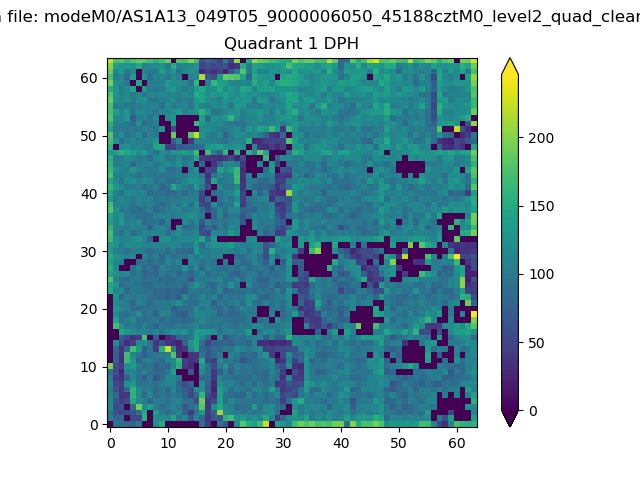 |
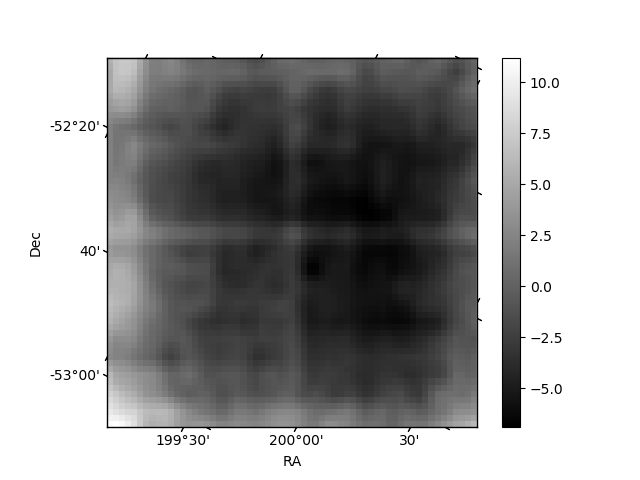
Quadrant B |
|---|---|---|---|
| Quadrant D | 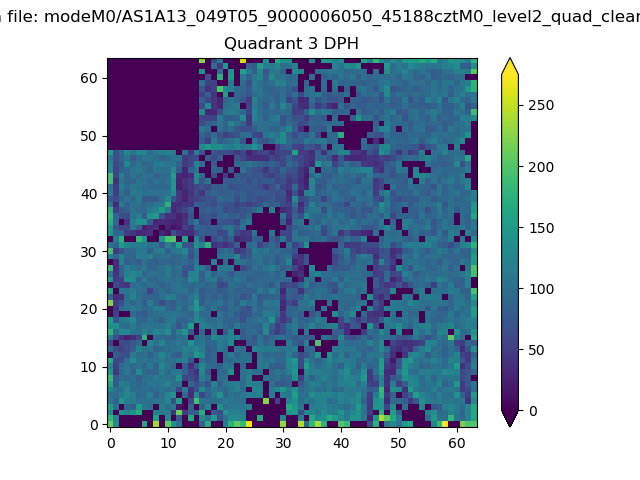 |
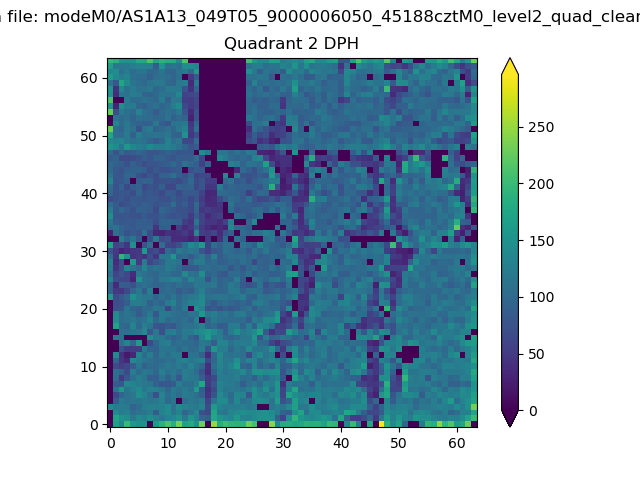 |
Quadrant C |
| Plot type | Count rate plots | Images |
|---|---|---|
| Comparison with Poisson distribution Blue bars denote a histogram of data divided into 1 sec bins. Red curve is a Poisson curve with rate = median count rate of data. |
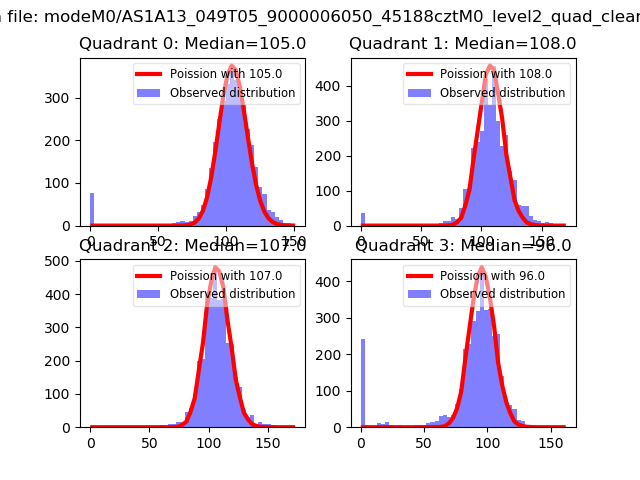 |
 |
| Quadrant-wise count rates Data is divided into 100 sec bins |
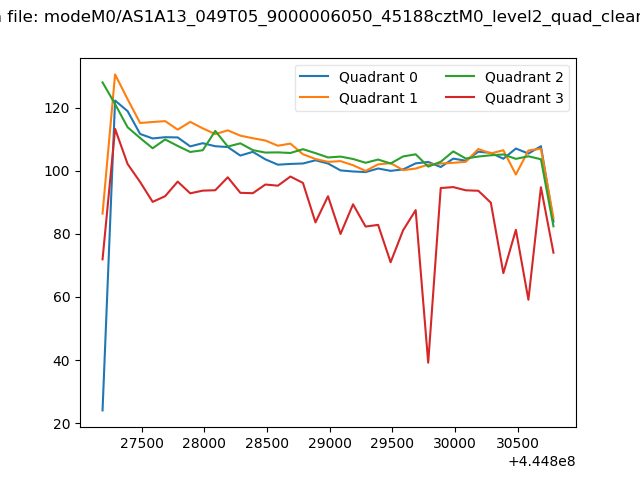 |
|
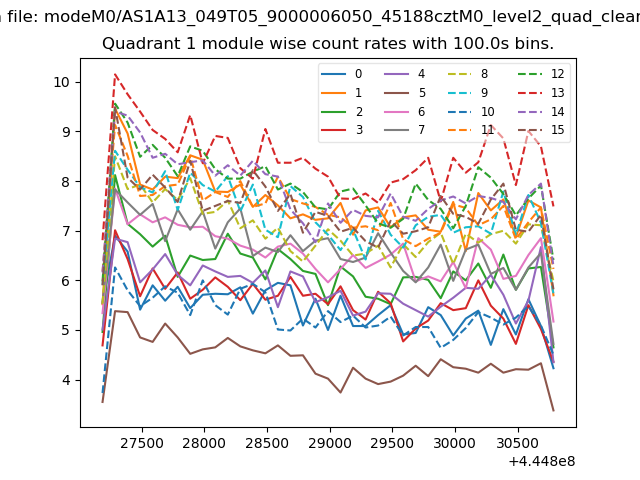
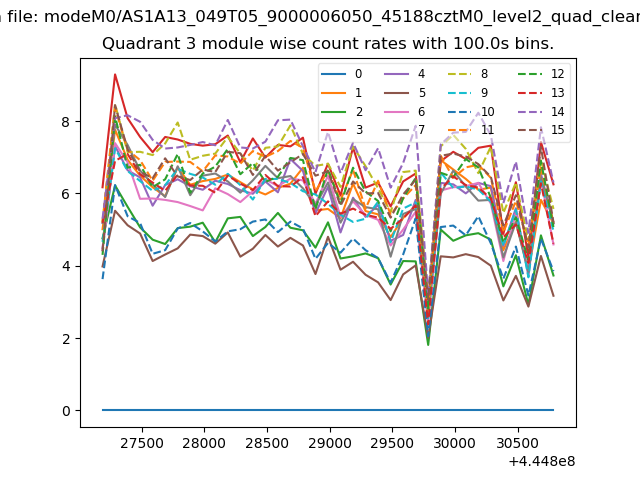
| Module-wise count rates for Quadrant A Data is divided into 100 sec bins |
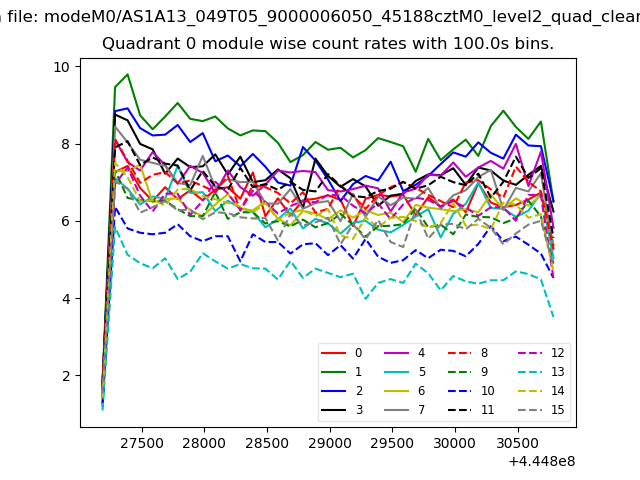 |
 |
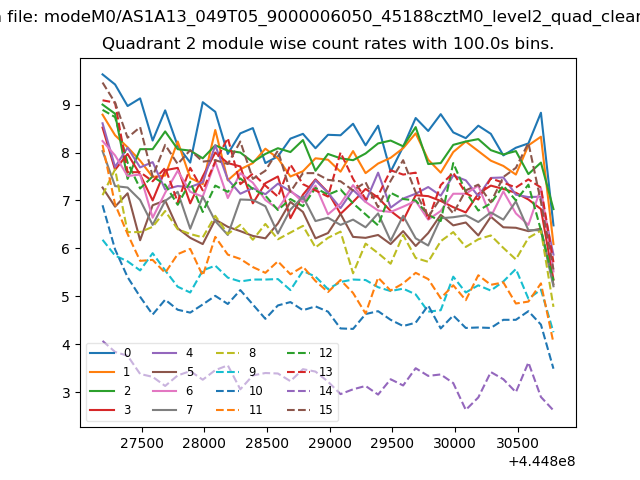
| Module-wise count rates for Quadrant B Data is divided into 100 sec bins |
 |
 |
| Module-wise count rates for Quadrant C Data is divided into 100 sec bins |
 |
 |
| Module-wise count rates for Quadrant D Data is divided into 100 sec bins |
 |
 |
| Parameter | Plot |
|---|---|
| CZT HV Monitor | 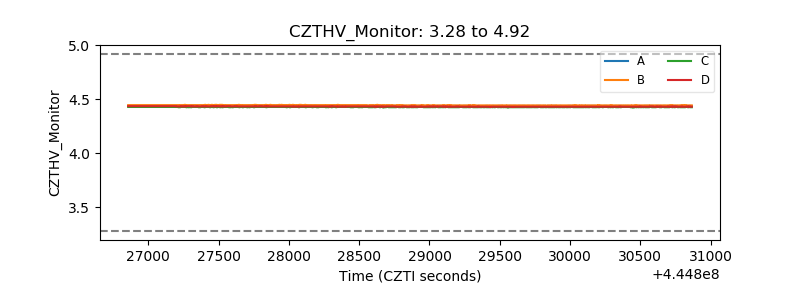 |
| D_VDD | 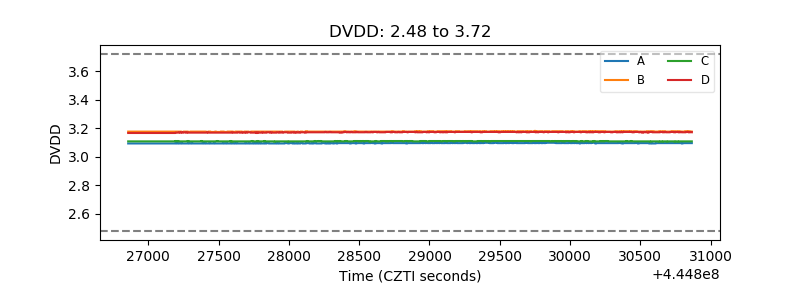 |
| Temperature 1 | 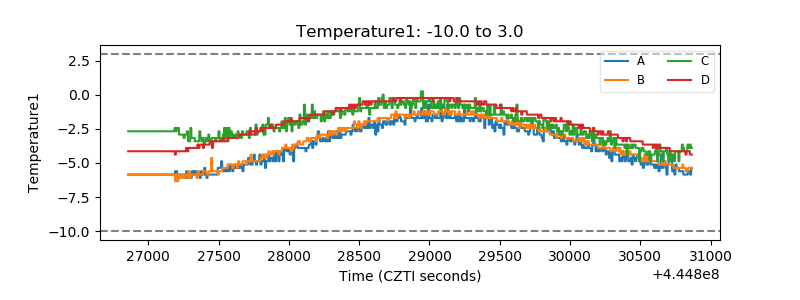 |
| Veto HV Monitor | 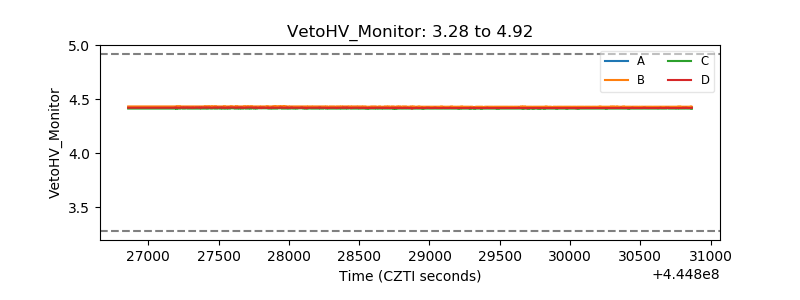 |
| Veto LLD | 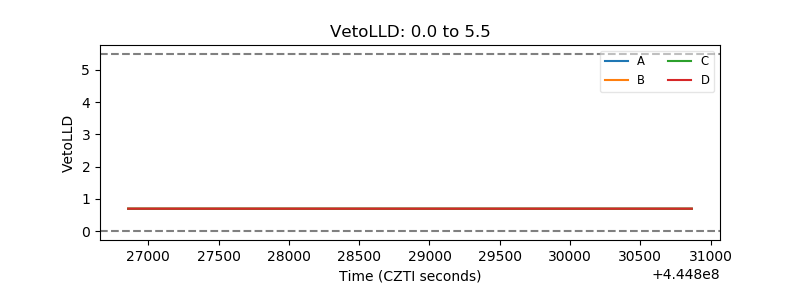 |
| Alpha Counter | 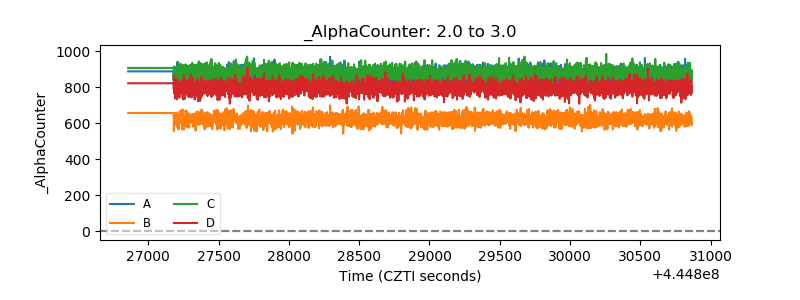 |
| _CPM_Rate | 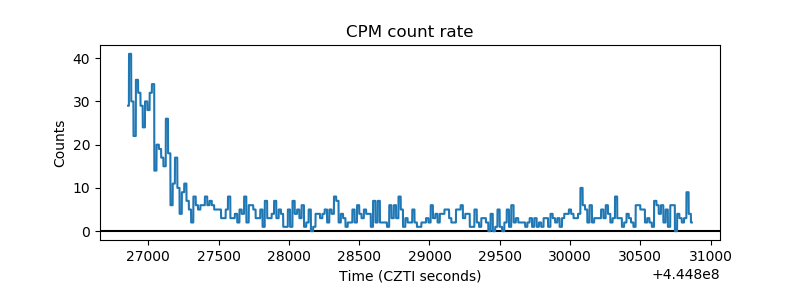 |
| CZT Counter | 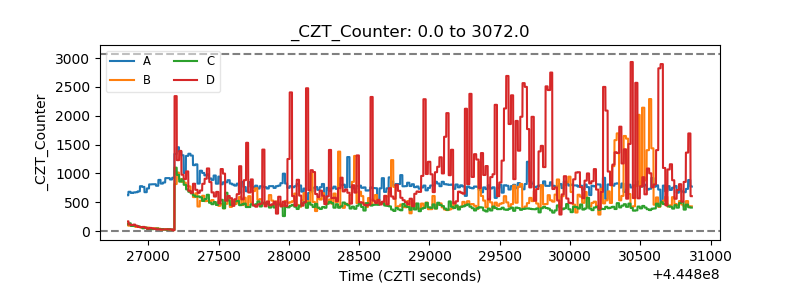 |
| +2.5 Volts monitor | 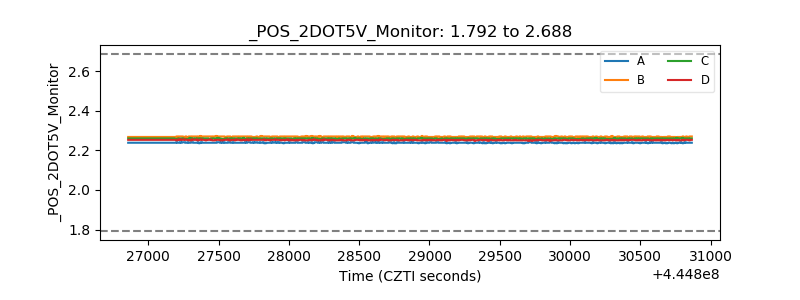 |
| +5 Volts monitor | 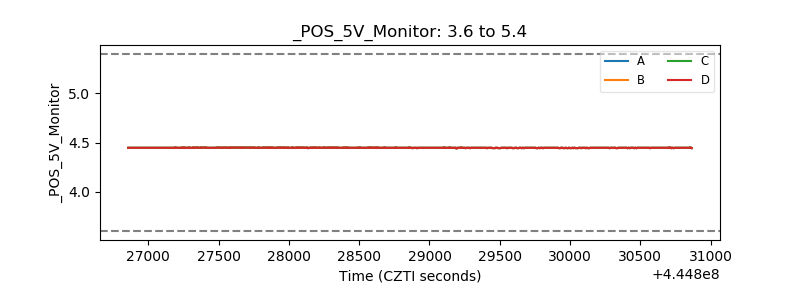 |
| _ROLL_ROT | 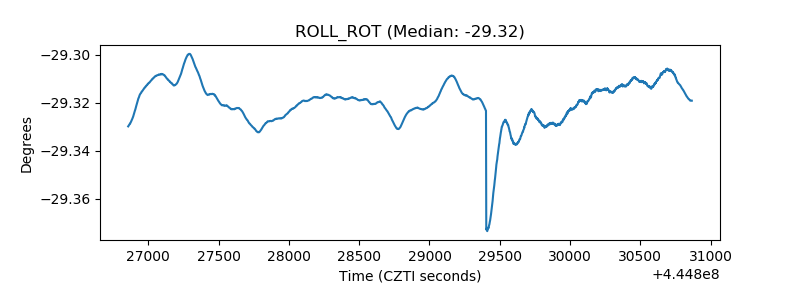 |
| _Roll_DEC | 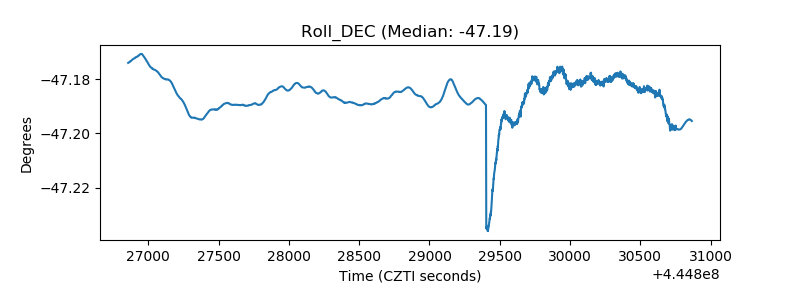 |
| _Roll_RA | 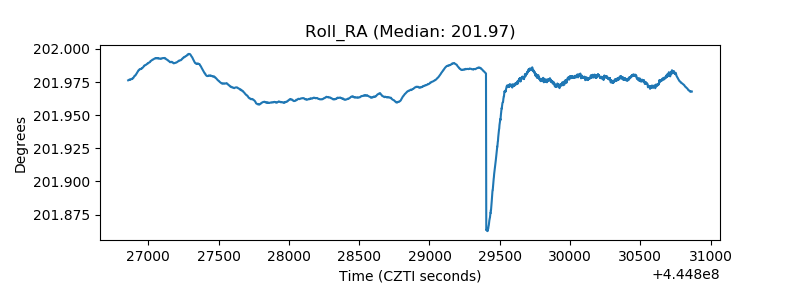 |
| Veto Counter | 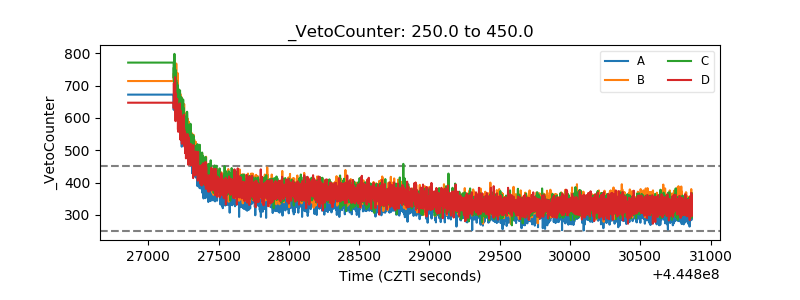 |