| Param | Original file | Final file |
|---|---|---|
| Filename | modeM0/AS1A13_042T05_9000006052_45188cztM0_level2.fits | modeM0/AS1A13_042T05_9000006052_45188cztM0_level2_quad_clean.evt |
| Size (bytes) | 303,684,480 | 59,209,920 |
| Size | 289.6 MB | 56.5 MB |
| Events in quadrant A | 3,105,891 | 382,108 |
| Events in quadrant B | 2,573,067 | 392,782 |
| Events in quadrant C | 1,951,482 | 411,810 |
| Events in quadrant D | 3,317,432 | 340,045 |
| Mode M0 | |||
|---|---|---|---|
| Quadrant | BADHDUFLAG | Total packets | Discarded packets |
| A | 0 | 11976 | 0 |
| B | 0 | 10129 | 0 |
| C | 0 | 8402 | 0 |
| D | 0 | 12458 | 0 |
| Mode SS | |||
|---|---|---|---|
| Quadrant | BADHDUFLAG | Total packets | Discarded packets |
| A | 0 | 76 | 0 |
| B | 0 | 76 | 0 |
| C | 0 | 76 | 0 |
| D | 0 | 76 | 0 |
| Quadrant | Total seconds | Saturated seconds | Saturation percentage |
|---|---|---|---|
| A | 3760 | 357 | 9.494681% |
| B | 3760 | 397 | 10.558511% |
| C | 3760 | 107 | 2.845745% |
| D | 3760 | 494 | 13.138298% |
Noise dominated data is calculated using 1-second bins in cleaned event files. If a bin has >2000 counts, and if more than 50% of those come from <1% of pixels, then it is considered to be noise-dominated and hence unusable.
| Quadrant | # 1 sec bins | Bins with >0 counts | Bins with >2000 counts | High rate bins dominated by noise | Noise dominated (total time) | Noise dominated (detector-on time) | Marked lightcurve |
|---|---|---|---|---|---|---|---|
| A | 3760 | 3760 | 12 | 12 | 0.32% | 0.32% | 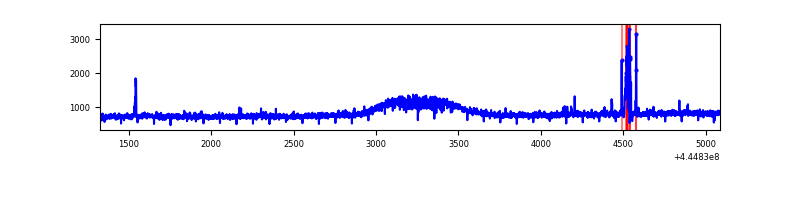 |
| B | 3760 | 3760 | 84 | 84 | 2.23% | 2.23% | 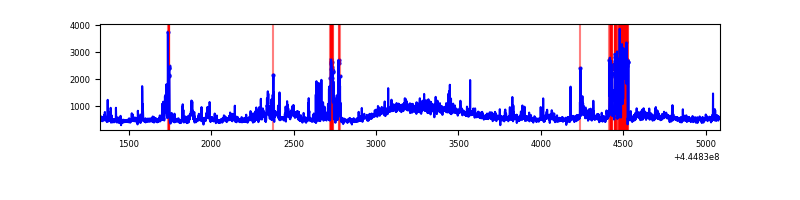 |
| C | 3760 | 3760 | 2 | 2 | 0.05% | 0.05% | 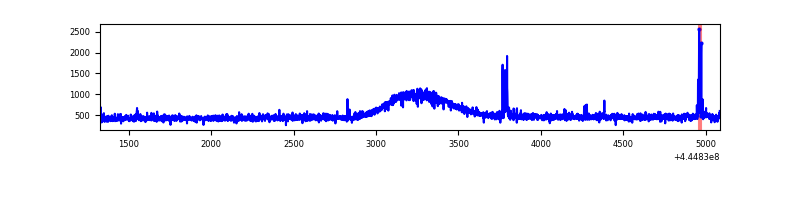 |
| D | 3760 | 3760 | 246 | 246 | 6.54% | 6.54% | 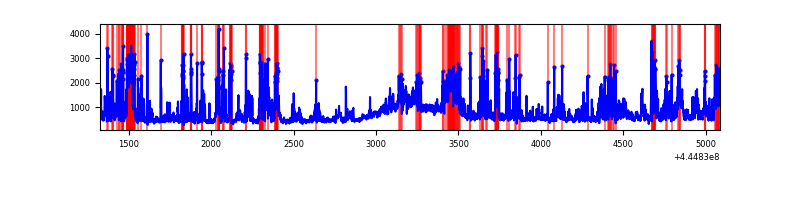 |
Top three noisy pixels from each quadrant. If the there are fewer than three noisy pixels in the level2.evt file, extra rows are filled as -1
| Pixel properties | Quadrant properties | ||||||
|---|---|---|---|---|---|---|---|
| Quadrant | DetID | PixID | Counts | Sigma | Mean | Median | Sigma |
| A | 10 | 83 | 1169129 | 11195.27 | 482 | 468 | 104.4 |
| A | 15 | 174 | 50759 | 481.77 | 482 | 468 | 104.4 |
| A | 0 | 243 | 12156 | 111.97 | 482 | 468 | 104.4 |
| B | 3 | 112 | 453768 | 4615.55 | 473 | 458 | 98.2 |
| B | 4 | 170 | 140483 | 1425.72 | 473 | 458 | 98.2 |
| B | 5 | 255 | 45058 | 454.11 | 473 | 458 | 98.2 |
| C | 1 | 3 | 22824 | 191.18 | 485 | 488 | 116.8 |
| C | 12 | 249 | 19689 | 164.35 | 485 | 488 | 116.8 |
| C | 3 | 233 | 13181 | 108.64 | 485 | 488 | 116.8 |
| D | 13 | 249 | 1087493 | 9050.1 | 464 | 450 | 120.1 |
| D | 1 | 47 | 152746 | 1267.93 | 464 | 450 | 120.1 |
| D | 5 | 222 | 112776 | 935.16 | 464 | 450 | 120.1 |
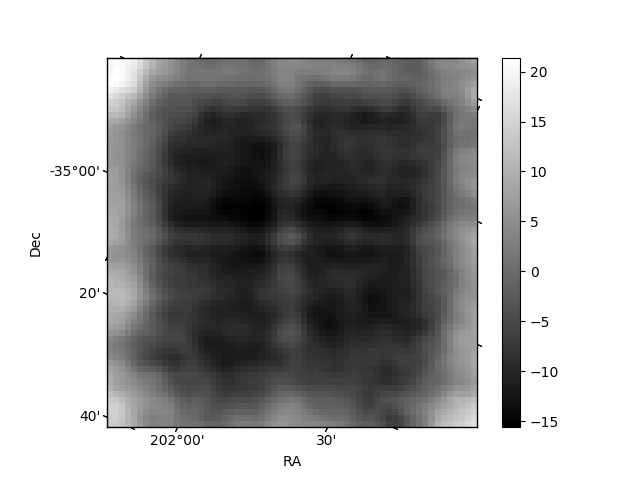
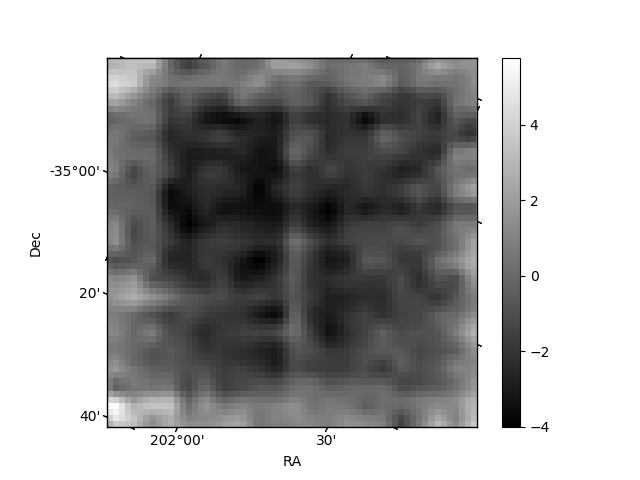
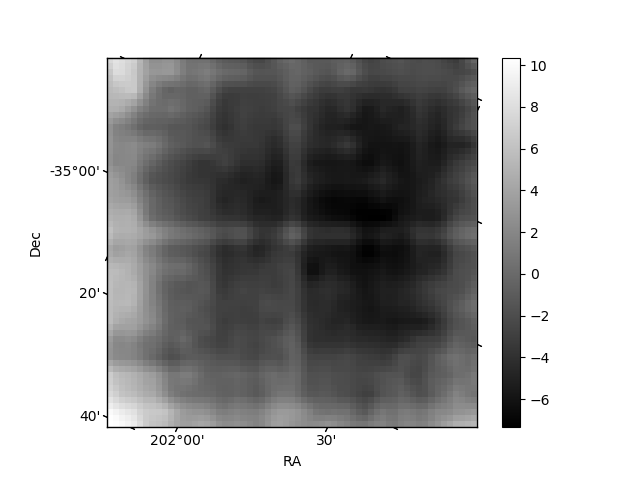
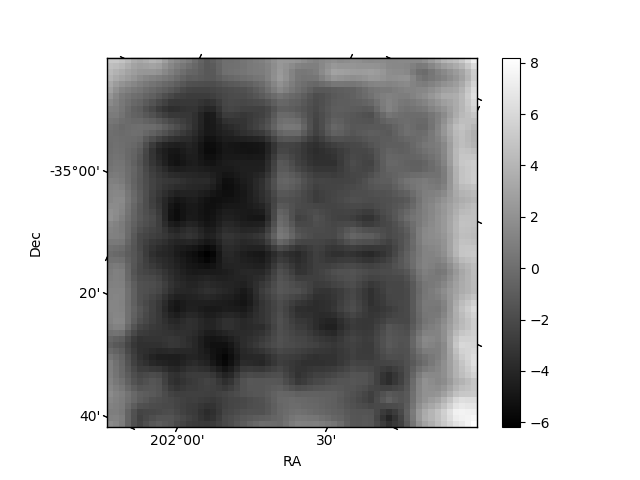
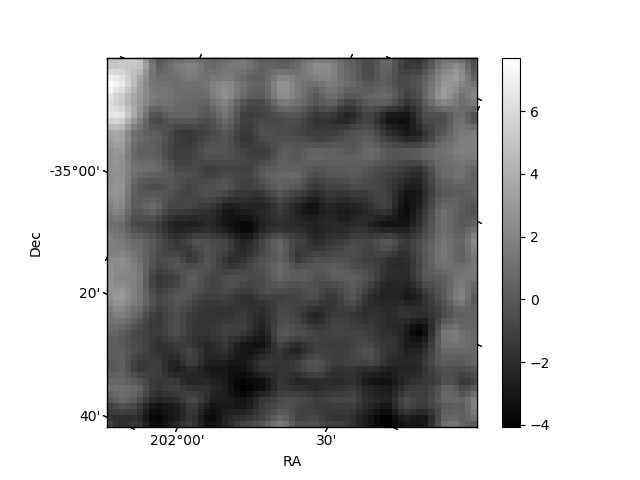
Histogram calculated using DETX and DETY for each event in the final _common_clean file
| Quadrant A | 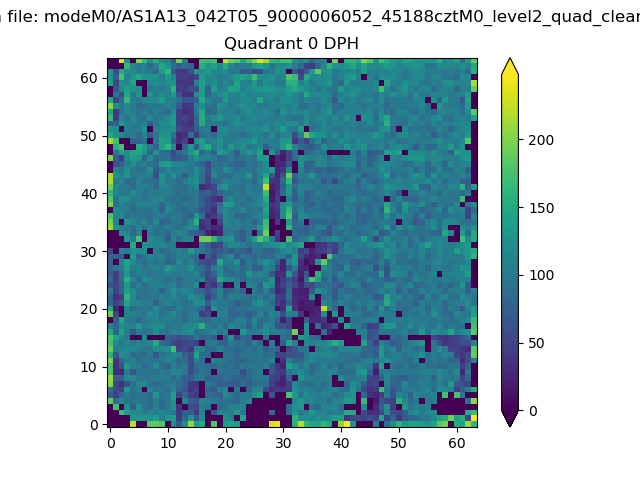 |
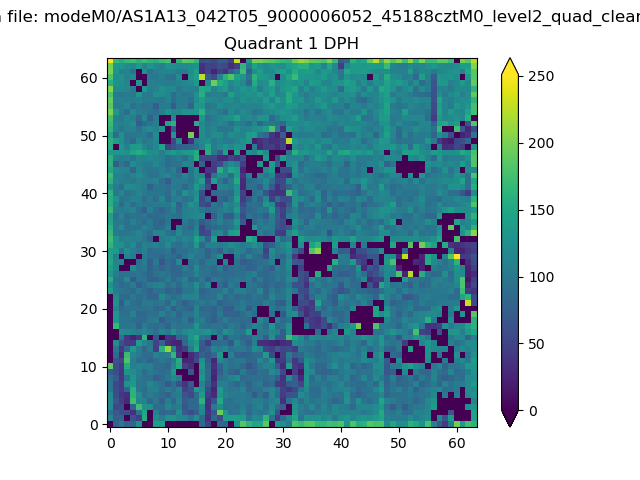 |
Quadrant B |
|---|---|---|---|
| Quadrant D | 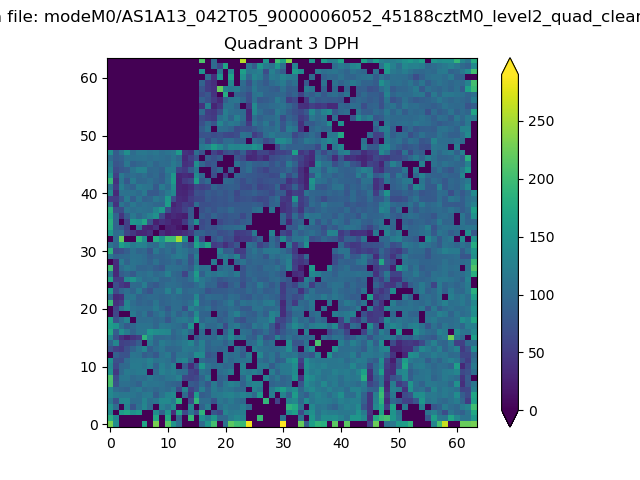 |
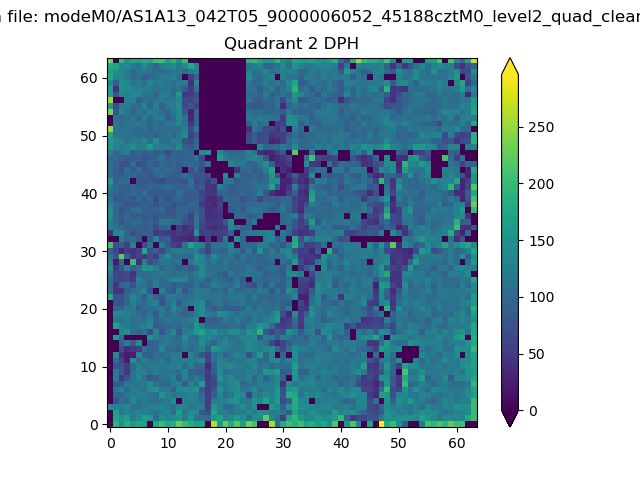 |
Quadrant C |
| Plot type | Count rate plots | Images |
|---|---|---|
| Comparison with Poisson distribution Blue bars denote a histogram of data divided into 1 sec bins. Red curve is a Poisson curve with rate = median count rate of data. |
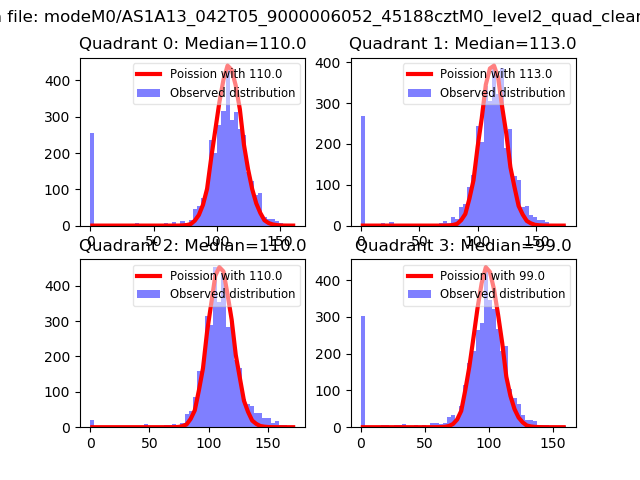 |
 |
| Quadrant-wise count rates Data is divided into 100 sec bins |
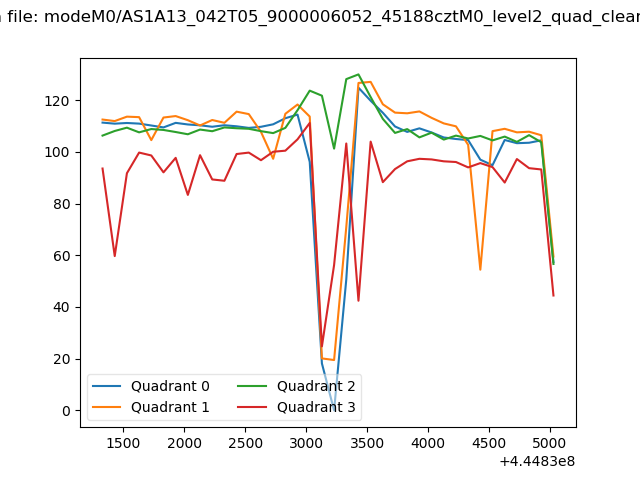 |
|
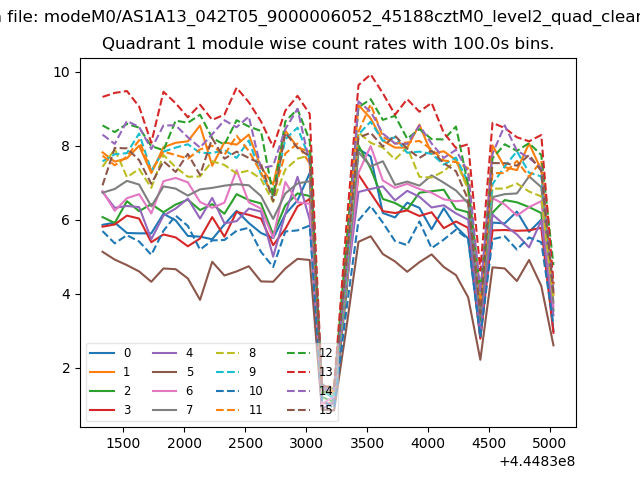
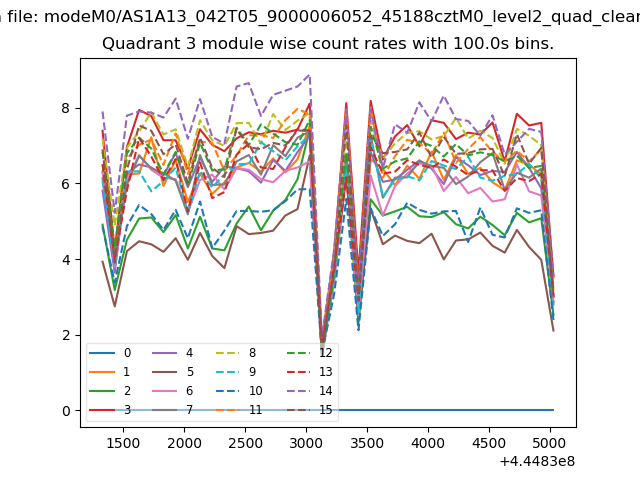
| Module-wise count rates for Quadrant A Data is divided into 100 sec bins |
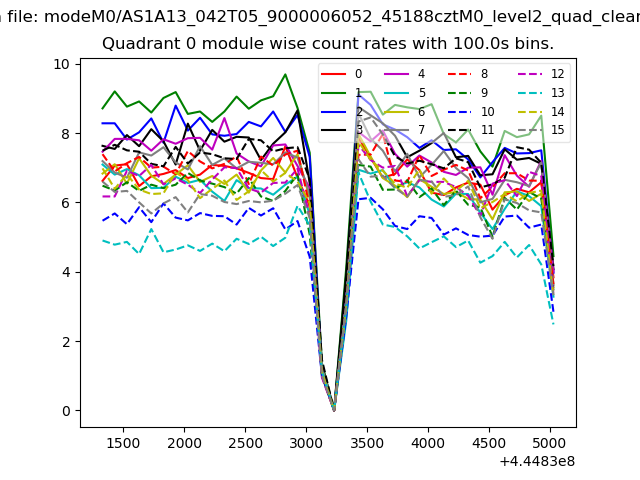 |
 |
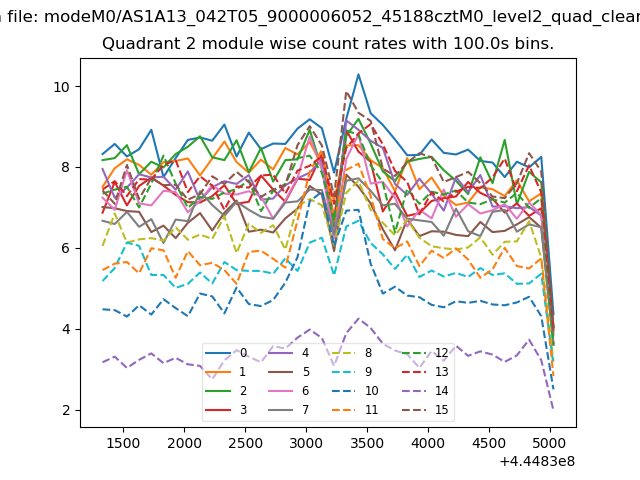
| Module-wise count rates for Quadrant B Data is divided into 100 sec bins |
 |
 |
| Module-wise count rates for Quadrant C Data is divided into 100 sec bins |
 |
 |
| Module-wise count rates for Quadrant D Data is divided into 100 sec bins |
 |
 |
| Parameter | Plot |
|---|---|
| CZT HV Monitor | 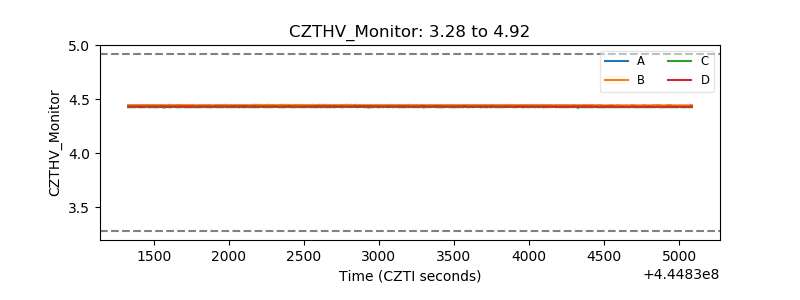 |
| D_VDD | 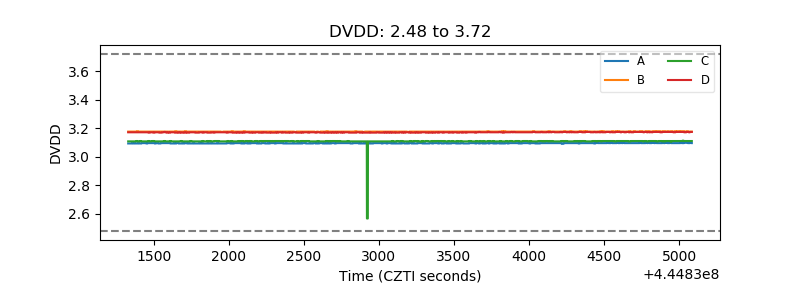 |
| Temperature 1 | 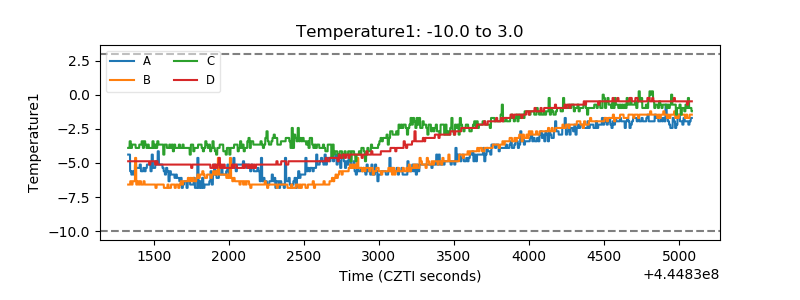 |
| Veto HV Monitor |  |
| Veto LLD | 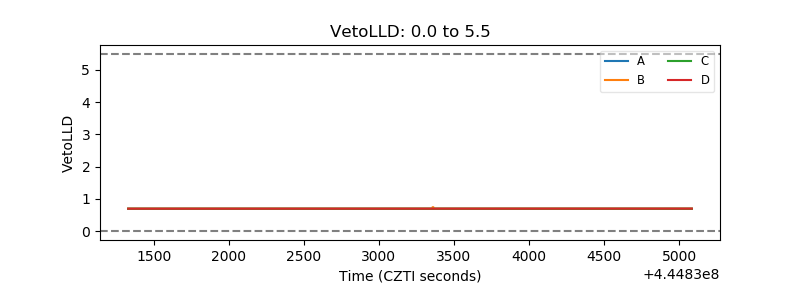 |
| Alpha Counter | 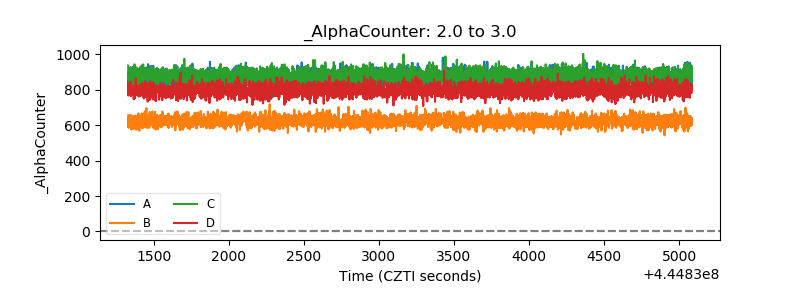 |
| _CPM_Rate | 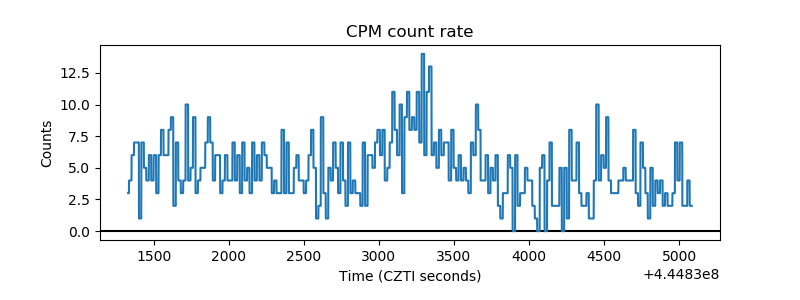 |
| CZT Counter | 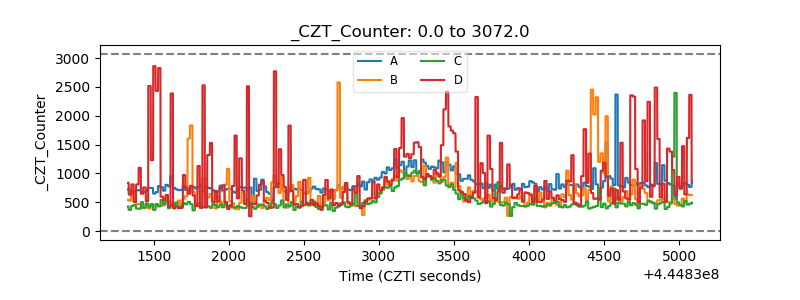 |
| +2.5 Volts monitor | 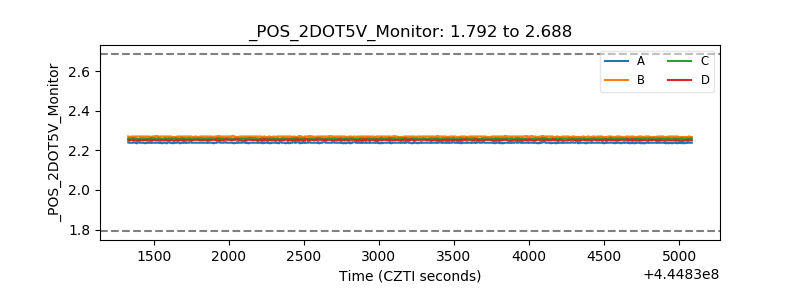 |
| +5 Volts monitor | 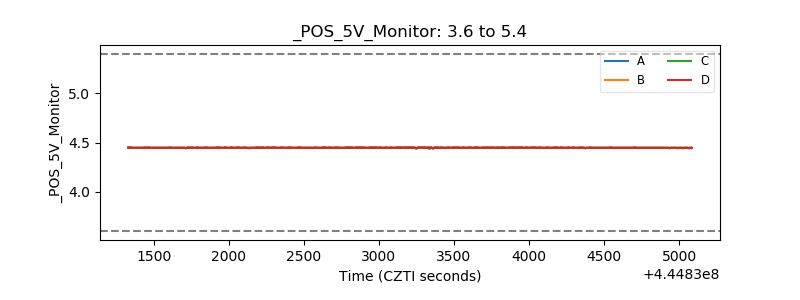 |
| _ROLL_ROT | 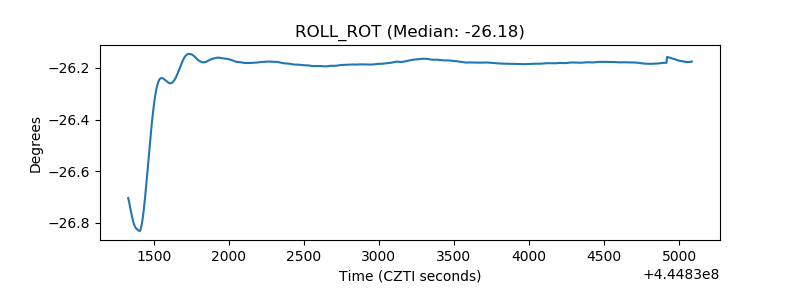 |
| _Roll_DEC | 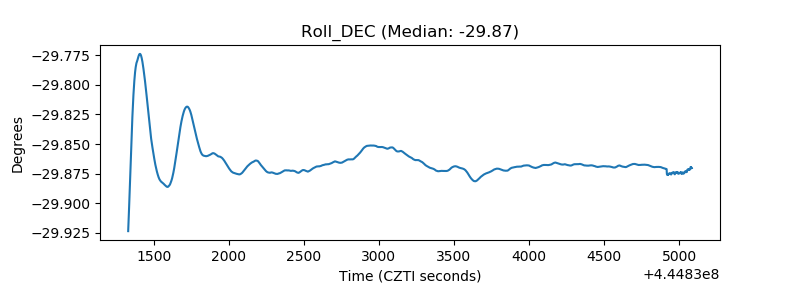 |
| _Roll_RA | 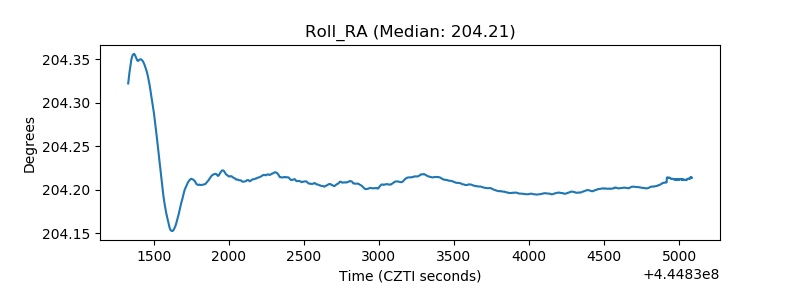 |
| Veto Counter | 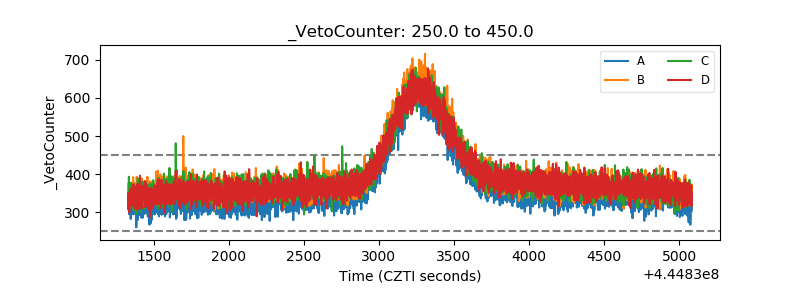 |