| Param | Original file | Final file |
|---|---|---|
| Filename | modeM0/AS1A13_042T05_9000006052_45189cztM0_level2.fits | modeM0/AS1A13_042T05_9000006052_45189cztM0_level2_quad_clean.evt |
| Size (bytes) | 450,947,520 | 101,491,200 |
| Size | 430.1 MB | 96.8 MB |
| Events in quadrant A | 6,733,915 | 866,502 |
| Events in quadrant B | 5,381,483 | 881,423 |
| Events in quadrant C | 4,083,576 | 882,127 |
| Events in quadrant D | 11,802 | 5 |
| Mode M0 | |||
|---|---|---|---|
| Quadrant | BADHDUFLAG | Total packets | Discarded packets |
| A | 0 | 25854 | 2 |
| B | 0 | 21401 | 3 |
| C | 0 | 17978 | 0 |
| D | 0 | 48 | 2 |
| Mode SS | |||
|---|---|---|---|
| Quadrant | BADHDUFLAG | Total packets | Discarded packets |
| A | 0 | 166 | 0 |
| B | 0 | 166 | 0 |
| C | 0 | 166 | 0 |
| D | 0 | 166 | 0 |
| Quadrant | Total seconds | Saturated seconds | Saturation percentage |
|---|---|---|---|
| A | 8272 | 305 | 3.687137% |
| B | 8270 | 429 | 5.187424% |
| C | 8273 | 109 | 1.317539% |
| D | 12 | 6 | 50.000000% |
Noise dominated data is calculated using 1-second bins in cleaned event files. If a bin has >2000 counts, and if more than 50% of those come from <1% of pixels, then it is considered to be noise-dominated and hence unusable.
| Quadrant | # 1 sec bins | Bins with >0 counts | Bins with >2000 counts | High rate bins dominated by noise | Noise dominated (total time) | Noise dominated (detector-on time) | Marked lightcurve |
|---|---|---|---|---|---|---|---|
| A | 8272 | 8272 | 22 | 22 | 0.27% | 0.27% | 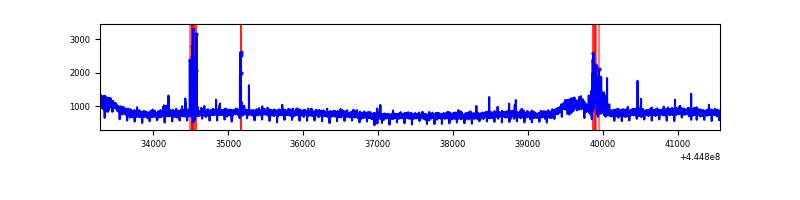 |
| B | 8272 | 8271 | 154 | 154 | 1.86% | 1.86% | 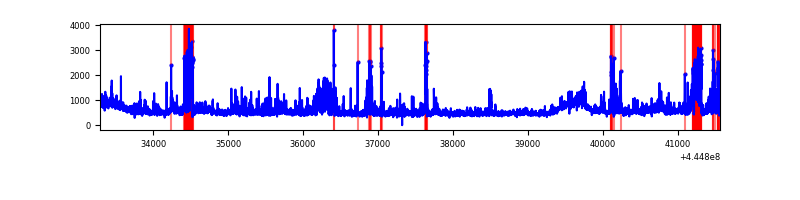 |
| C | 8273 | 8273 | 60 | 60 | 0.73% | 0.73% | 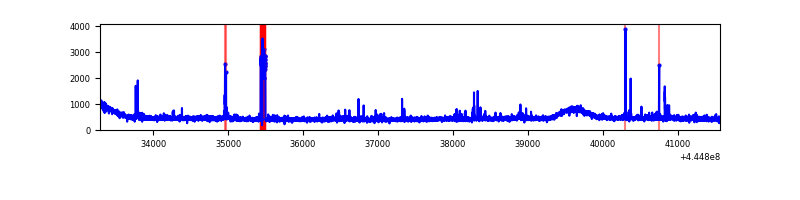 |
| D | 12 | 12 | 0 | 0 | 0.00% | 0.00% |  |
Top three noisy pixels from each quadrant. If the there are fewer than three noisy pixels in the level2.evt file, extra rows are filled as -1
| Pixel properties | Quadrant properties | ||||||
|---|---|---|---|---|---|---|---|
| Quadrant | DetID | PixID | Counts | Sigma | Mean | Median | Sigma |
| A | 10 | 83 | 2771615 | 13462.49 | 980 | 955 | 205.8 |
| A | 13 | 248 | 94412 | 454.1 | 980 | 955 | 205.8 |
| A | 15 | 174 | 52001 | 248.03 | 980 | 955 | 205.8 |
| B | 3 | 112 | 702222 | 3622.83 | 964 | 934 | 193.6 |
| B | 4 | 170 | 492695 | 2540.42 | 964 | 934 | 193.6 |
| B | 5 | 255 | 133783 | 686.29 | 964 | 934 | 193.6 |
| C | 0 | 207 | 144584 | 624.72 | 966 | 972 | 229.9 |
| C | 3 | 233 | 67034 | 287.37 | 966 | 972 | 229.9 |
| C | 2 | 14 | 34190 | 144.5 | 966 | 972 | 229.9 |
| D | 13 | 249 | 88 | 46.48 | 3 | 2 | 1.9 |
| D | 2 | 234 | 61 | 31.89 | 3 | 2 | 1.9 |
| D | 13 | 171 | 38 | 19.46 | 3 | 2 | 1.9 |
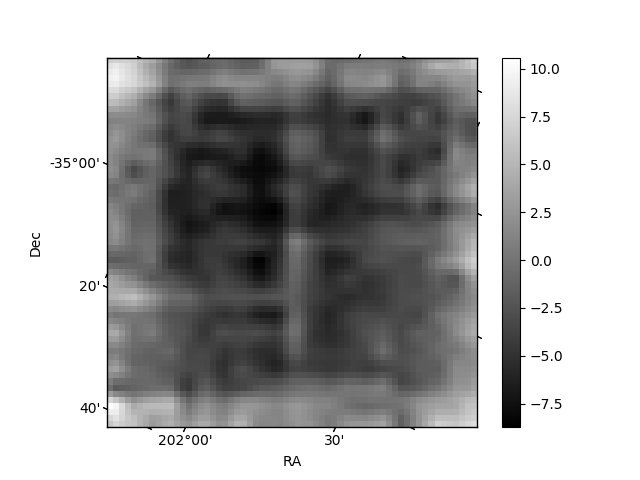
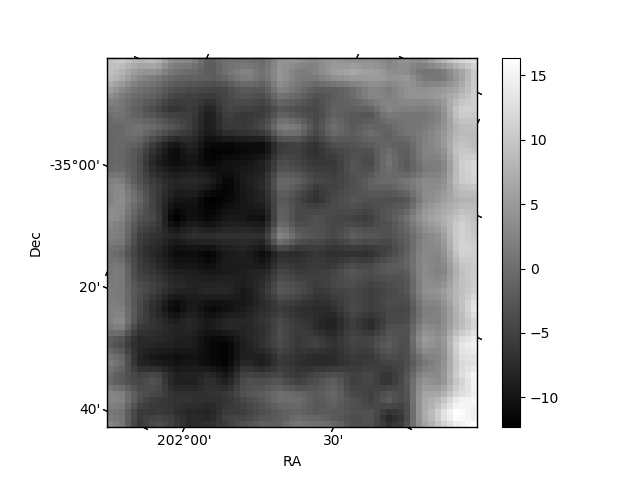
Histogram calculated using DETX and DETY for each event in the final _common_clean file
| Quadrant A | 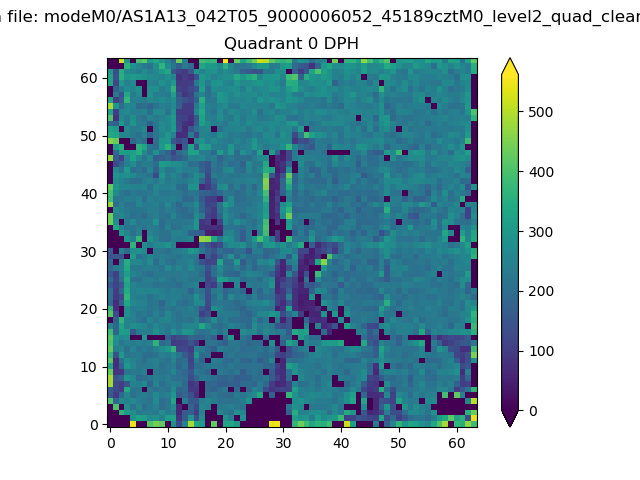 |
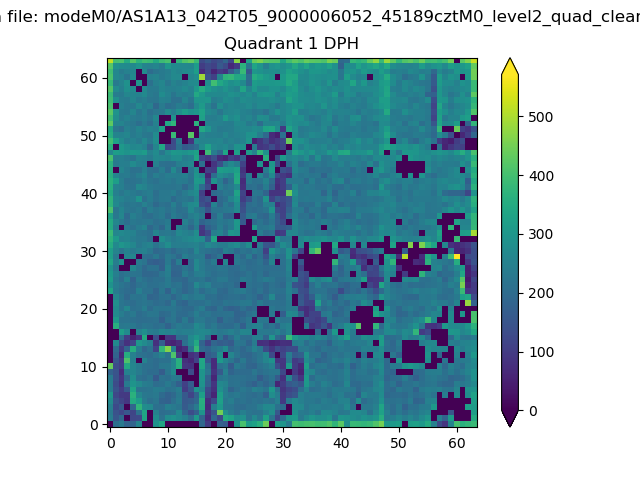 |
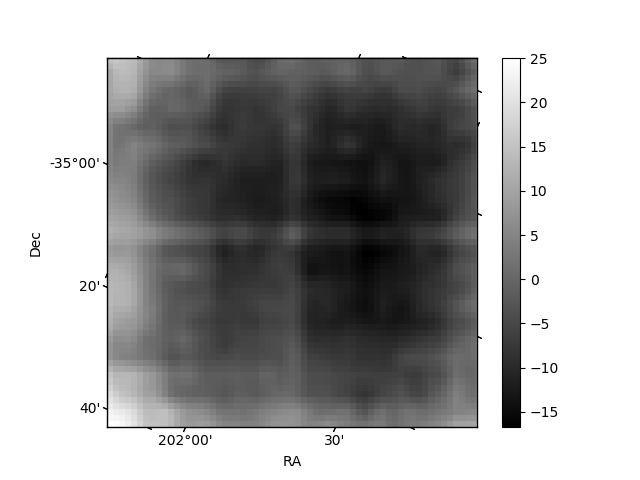
Quadrant B |
|---|---|---|---|
| Quadrant D | 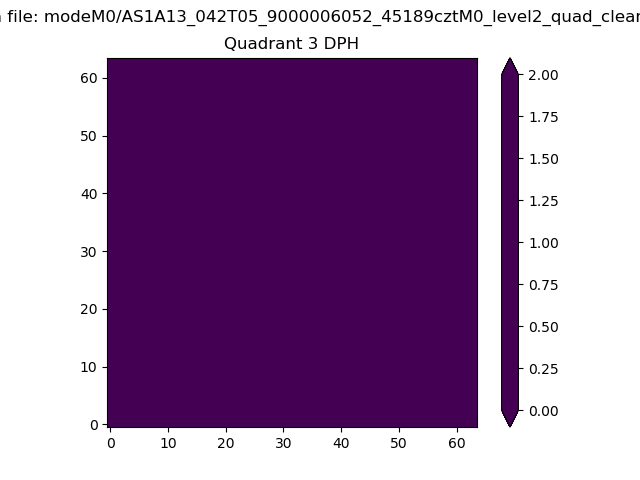 |
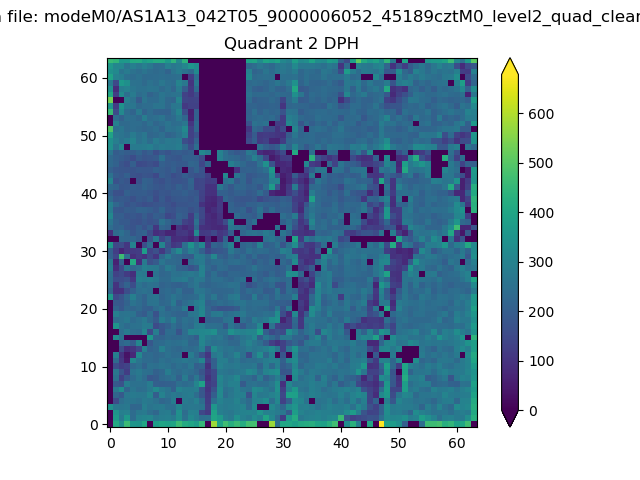 |
Quadrant C |
| Plot type | Count rate plots | Images |
|---|---|---|
| Comparison with Poisson distribution Blue bars denote a histogram of data divided into 1 sec bins. Red curve is a Poisson curve with rate = median count rate of data. |
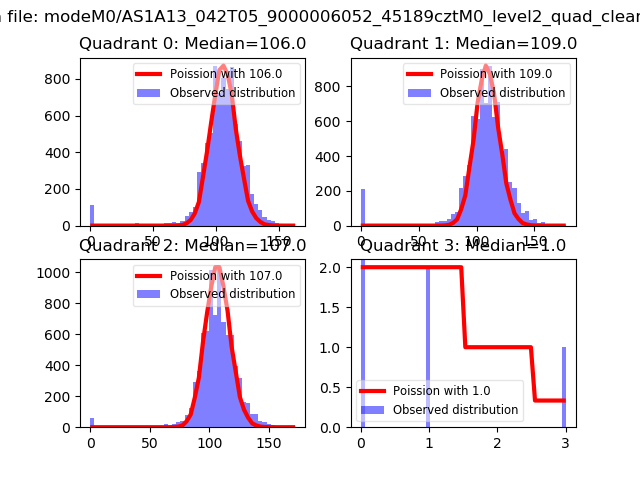 |
 |
| Quadrant-wise count rates Data is divided into 100 sec bins |
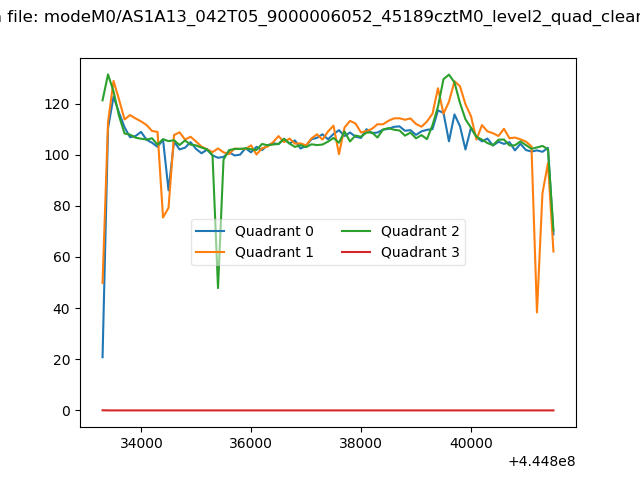 |
|
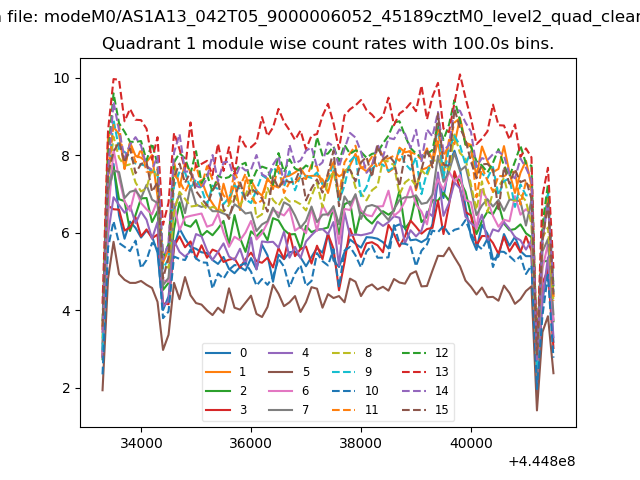
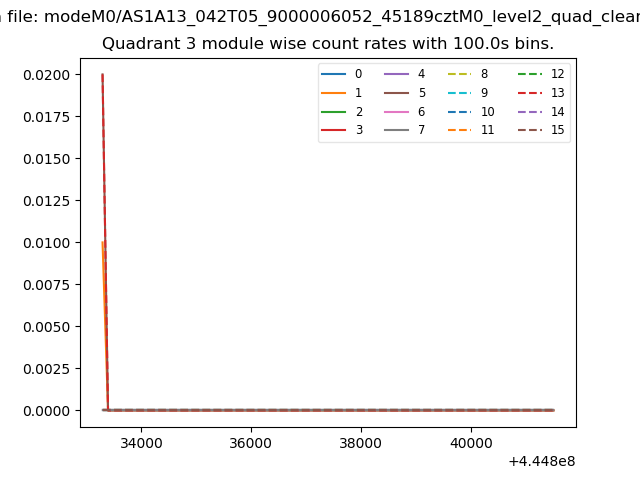
| Module-wise count rates for Quadrant A Data is divided into 100 sec bins |
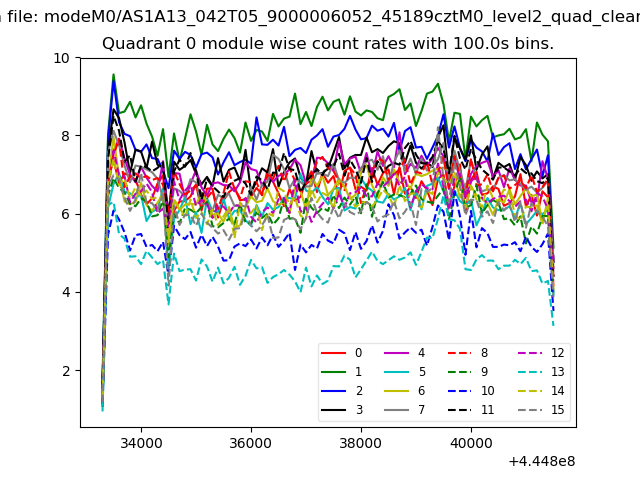 |
 |
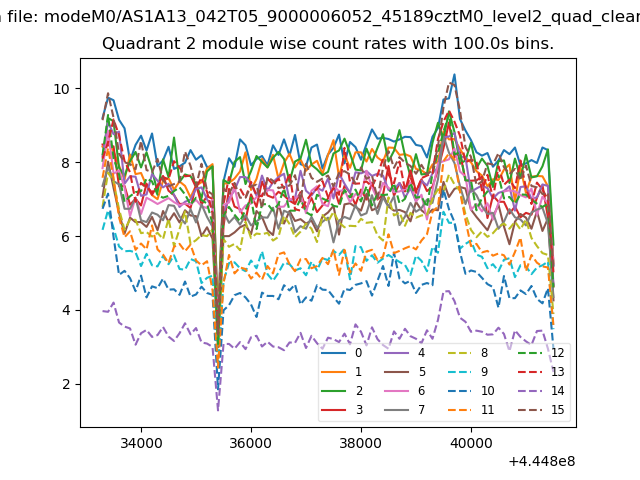
| Module-wise count rates for Quadrant B Data is divided into 100 sec bins |
 |
 |
| Module-wise count rates for Quadrant C Data is divided into 100 sec bins |
 |
 |
| Module-wise count rates for Quadrant D Data is divided into 100 sec bins |
 |
 |
| Parameter | Plot |
|---|---|
| CZT HV Monitor | 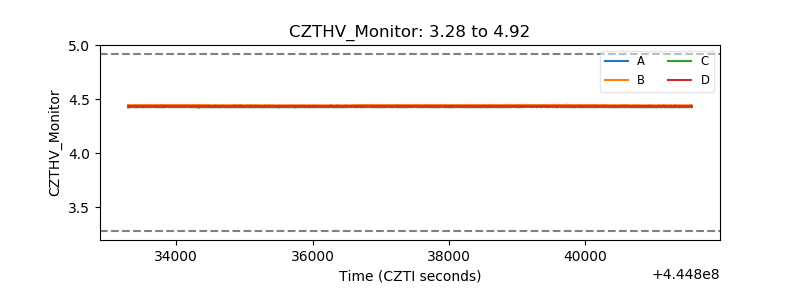 |
| D_VDD | 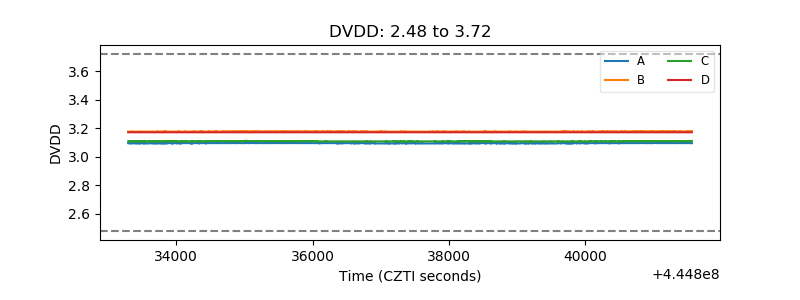 |
| Temperature 1 | 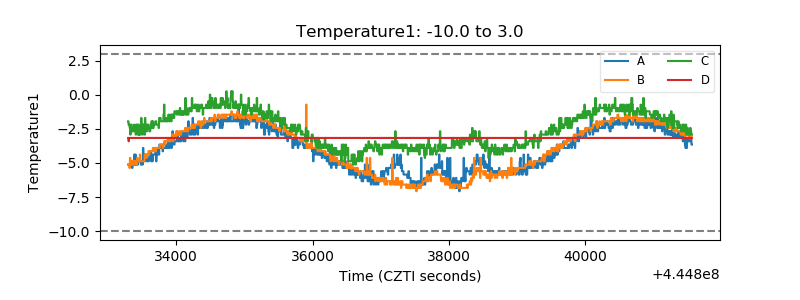 |
| Veto HV Monitor | 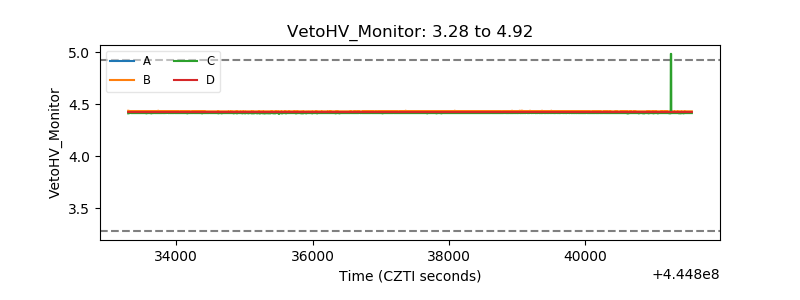 |
| Veto LLD | 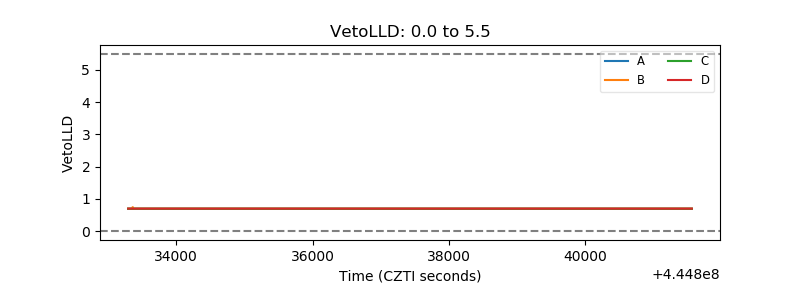 |
| Alpha Counter | 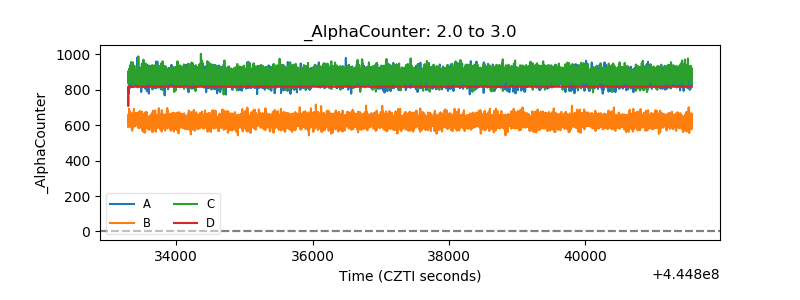 |
| _CPM_Rate | 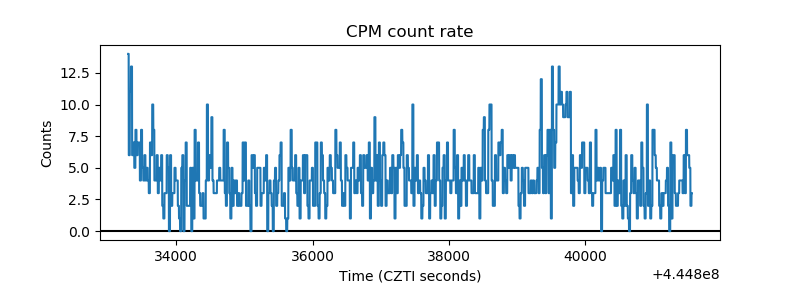 |
| CZT Counter | 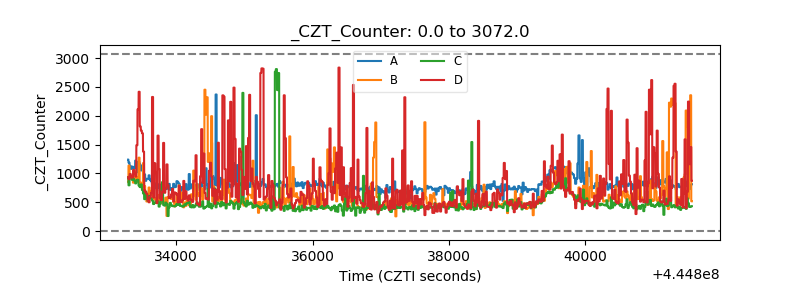 |
| +2.5 Volts monitor | 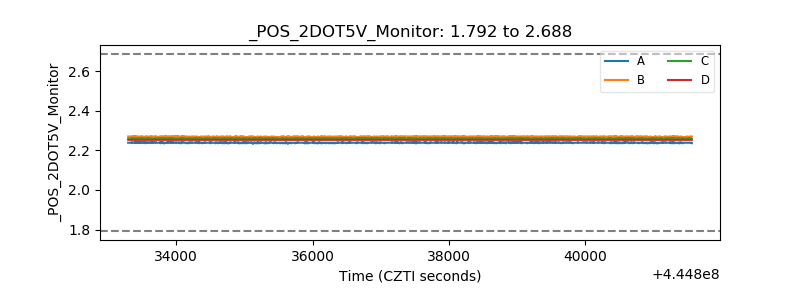 |
| +5 Volts monitor | 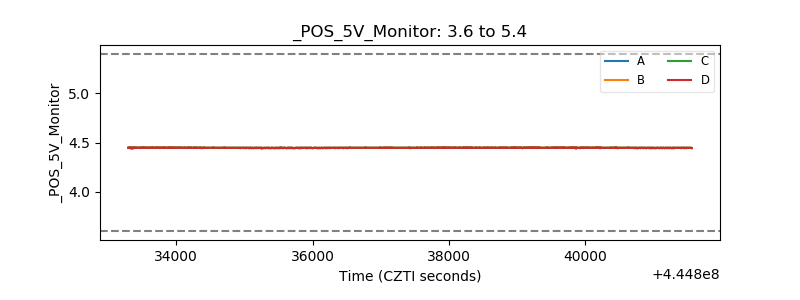 |
| _ROLL_ROT | 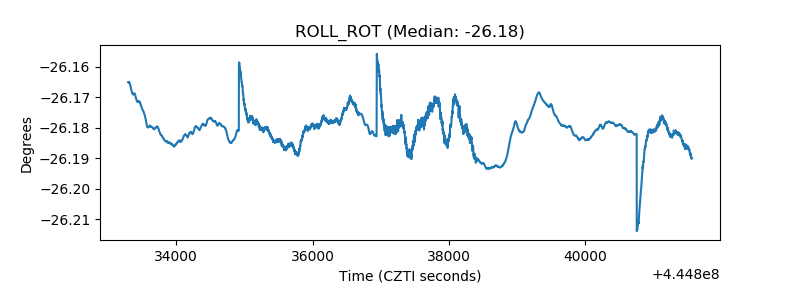 |
| _Roll_DEC | 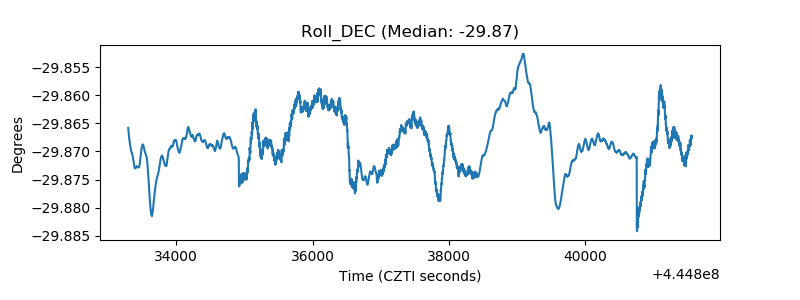 |
| _Roll_RA | 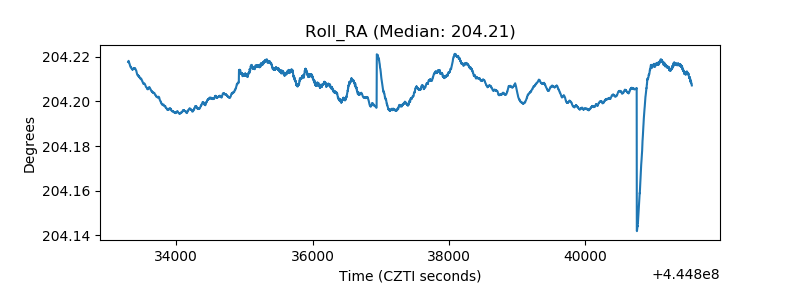 |
| Veto Counter | 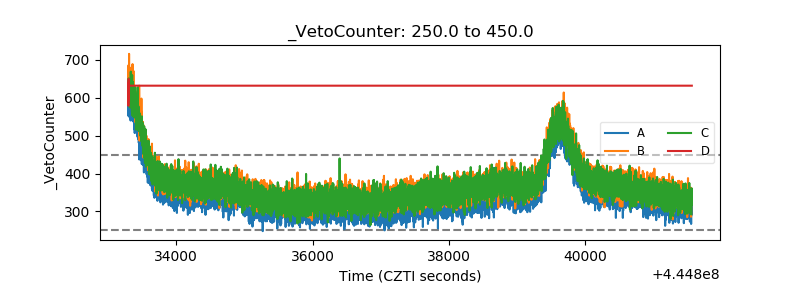 |