| Param | Original file | Final file |
|---|---|---|
| Filename | modeM0/AS1A13_042T05_9000006052_45194cztM0_level2.fits | modeM0/AS1A13_042T05_9000006052_45194cztM0_level2_quad_clean.evt |
| Size (bytes) | 1,565,642,880 | 277,819,200 |
| Size | 1.5 GB | 264.9 MB |
| Events in quadrant A | 15,196,421 | 1,932,425 |
| Events in quadrant B | 10,330,530 | 1,973,530 |
| Events in quadrant C | 8,898,330 | 1,973,768 |
| Events in quadrant D | 22,071,515 | 1,231,933 |
| Mode M9 | |||
|---|---|---|---|
| Quadrant | BADHDUFLAG | Total packets | Discarded packets |
| A | 0 | 10 | 0 |
| B | 0 | 10 | 0 |
| C | 0 | 10 | 0 |
| D | 0 | 10 | 0 |
| Mode M0 | |||
|---|---|---|---|
| Quadrant | BADHDUFLAG | Total packets | Discarded packets |
| A | 0 | 58895 | 2 |
| B | 0 | 43236 | 2 |
| C | 0 | 39787 | 2 |
| D | 0 | 78427 | 2 |
| Mode SS | |||
|---|---|---|---|
| Quadrant | BADHDUFLAG | Total packets | Discarded packets |
| A | 0 | 382 | 0 |
| B | 0 | 382 | 0 |
| C | 0 | 382 | 0 |
| D | 0 | 382 | 0 |
| Quadrant | Total seconds | Saturated seconds | Saturation percentage |
|---|---|---|---|
| A | 18856 | 664 | 3.521426% |
| B | 18857 | 631 | 3.346237% |
| C | 18857 | 224 | 1.187888% |
| D | 18857 | 5698 | 30.216896% |
Noise dominated data is calculated using 1-second bins in cleaned event files. If a bin has >2000 counts, and if more than 50% of those come from <1% of pixels, then it is considered to be noise-dominated and hence unusable.
| Quadrant | # 1 sec bins | Bins with >0 counts | Bins with >2000 counts | High rate bins dominated by noise | Noise dominated (total time) | Noise dominated (detector-on time) | Marked lightcurve |
|---|---|---|---|---|---|---|---|
| A | 19856 | 18858 | 19 | 19 | 0.10% | 0.10% | 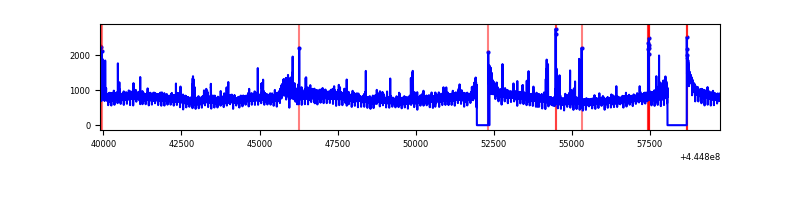 |
| B | 19857 | 18858 | 120 | 120 | 0.60% | 0.64% | 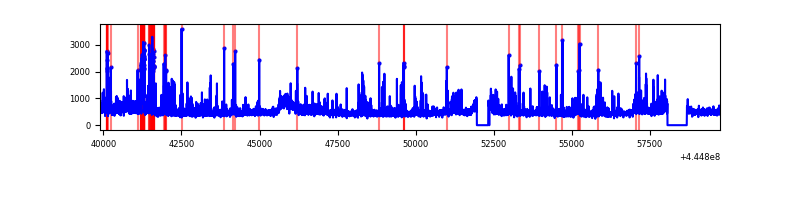 |
| C | 19857 | 18860 | 62 | 62 | 0.31% | 0.33% | 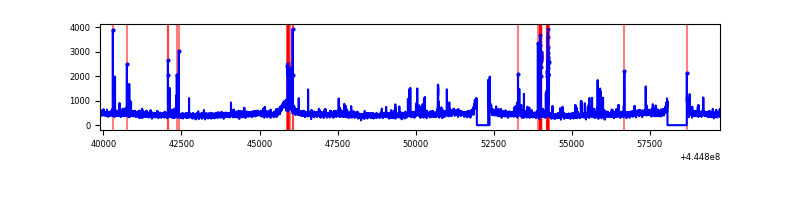 |
| D | 19857 | 18859 | 4049 | 4049 | 20.39% | 21.47% | 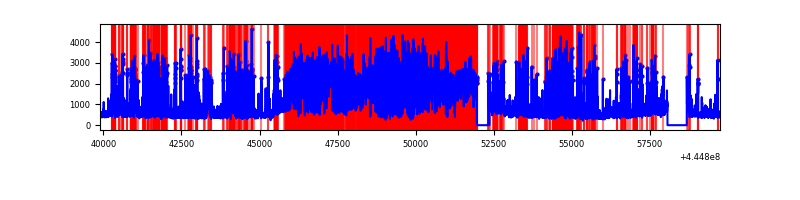 |
Top three noisy pixels from each quadrant. If the there are fewer than three noisy pixels in the level2.evt file, extra rows are filled as -1
| Pixel properties | Quadrant properties | ||||||
|---|---|---|---|---|---|---|---|
| Quadrant | DetID | PixID | Counts | Sigma | Mean | Median | Sigma |
| A | 10 | 83 | 6550088 | 14727.01 | 2139 | 2089 | 444.6 |
| A | 13 | 248 | 182273 | 405.25 | 2139 | 2089 | 444.6 |
| A | 2 | 79 | 128171 | 283.57 | 2139 | 2089 | 444.6 |
| B | 4 | 170 | 909311 | 2120.75 | 2136 | 2066 | 427.8 |
| B | 3 | 112 | 563996 | 1313.55 | 2136 | 2066 | 427.8 |
| B | 0 | 183 | 128195 | 294.83 | 2136 | 2066 | 427.8 |
| C | 3 | 233 | 261407 | 521.19 | 2119 | 2131 | 497.5 |
| C | 6 | 247 | 143341 | 283.86 | 2119 | 2131 | 497.5 |
| C | 12 | 2 | 111449 | 219.75 | 2119 | 2131 | 497.5 |
| D | 4 | 221 | 9695134 | 22396.77 | 1696 | 1641 | 432.8 |
| D | 13 | 249 | 1868938 | 4314.38 | 1696 | 1641 | 432.8 |
| D | 5 | 235 | 1231013 | 2840.46 | 1696 | 1641 | 432.8 |
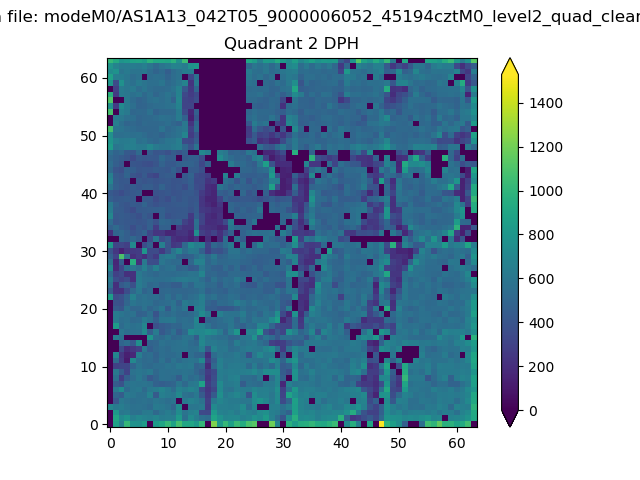
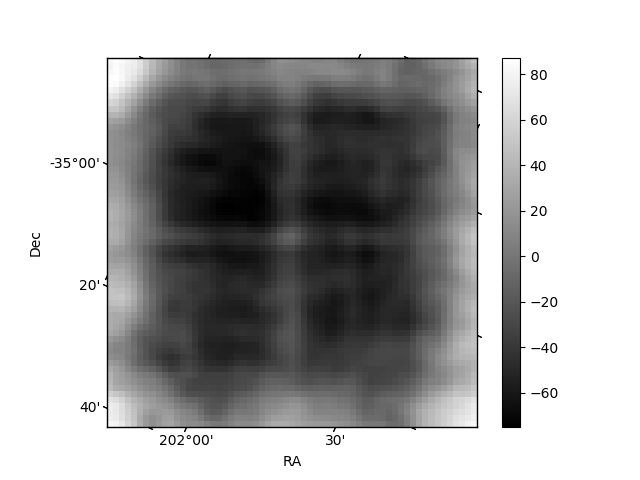
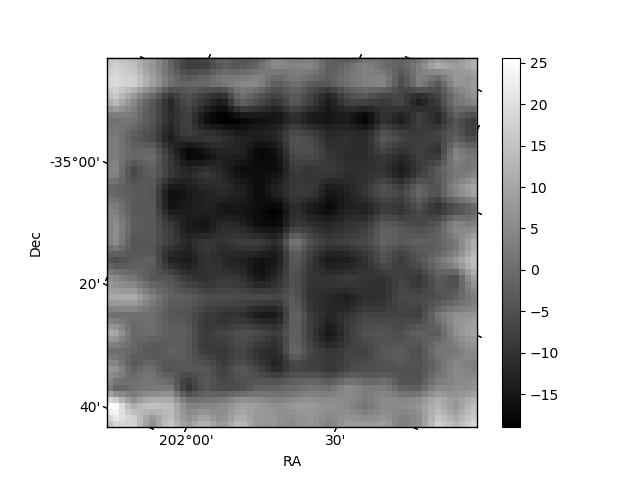
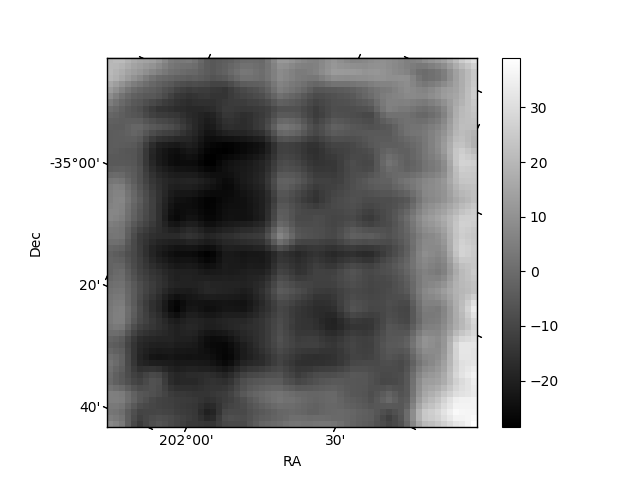
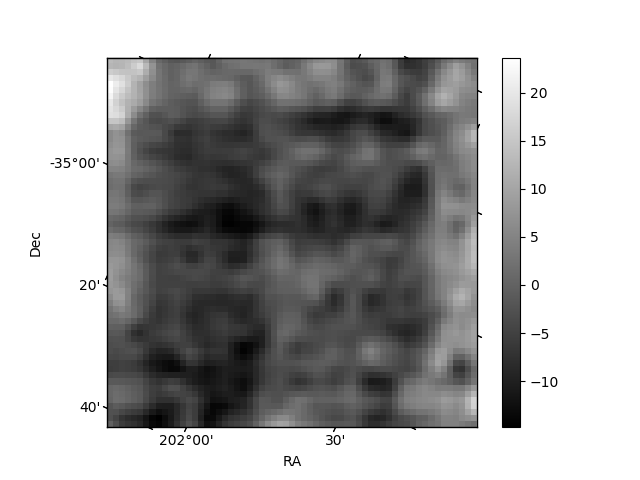
Histogram calculated using DETX and DETY for each event in the final _common_clean file
| Quadrant A | 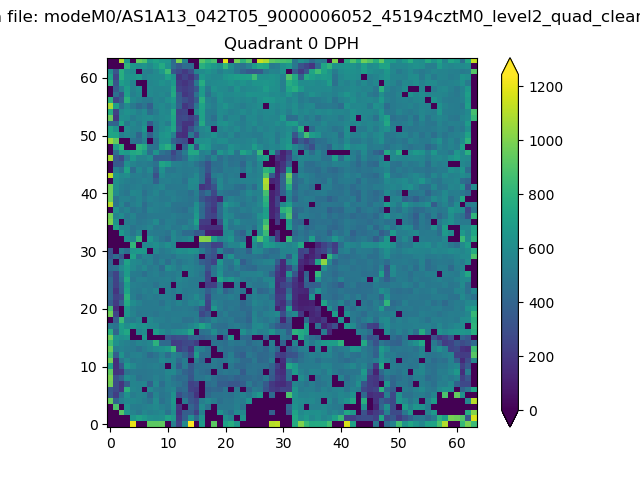 |
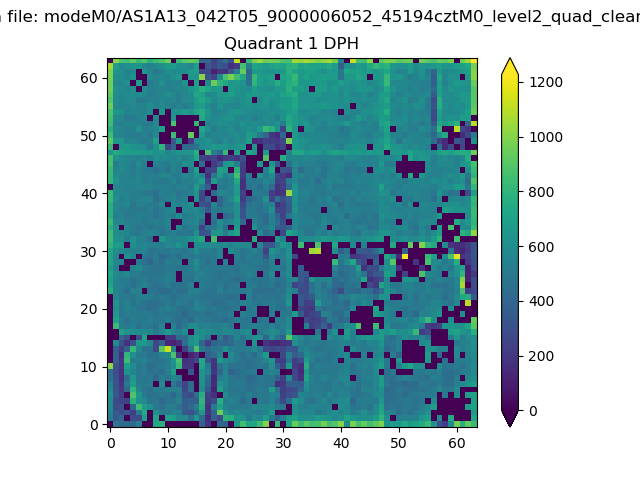 |
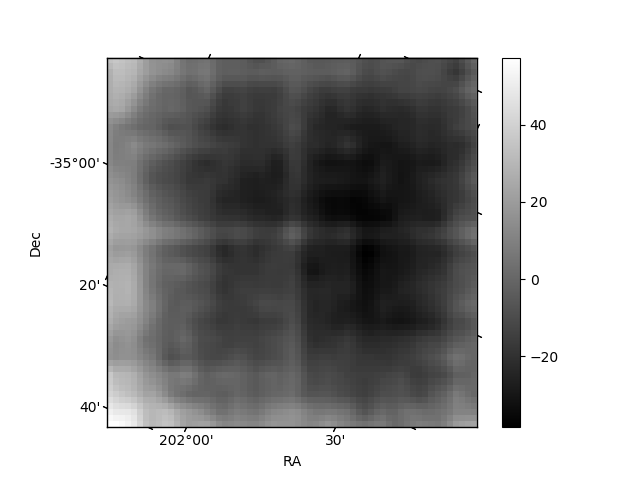
Quadrant B |
|---|---|---|---|
| Quadrant D | 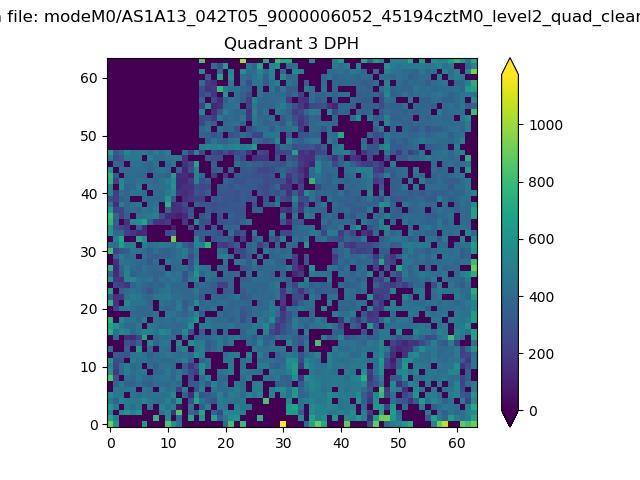 |
 |
Quadrant C |
| Plot type | Count rate plots | Images |
|---|---|---|
| Comparison with Poisson distribution Blue bars denote a histogram of data divided into 1 sec bins. Red curve is a Poisson curve with rate = median count rate of data. |
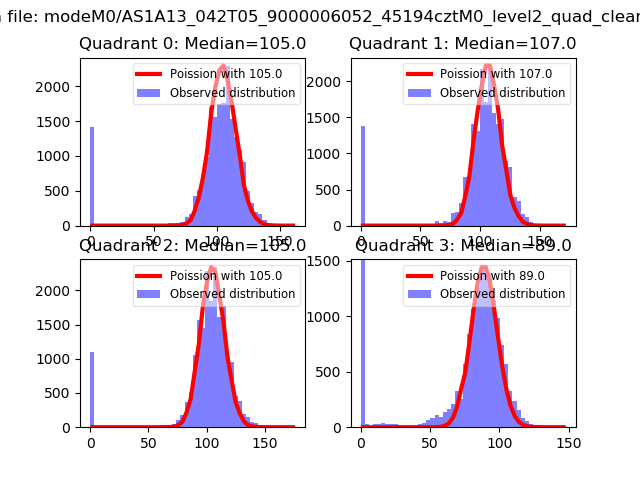 |
 |
| Quadrant-wise count rates Data is divided into 100 sec bins |
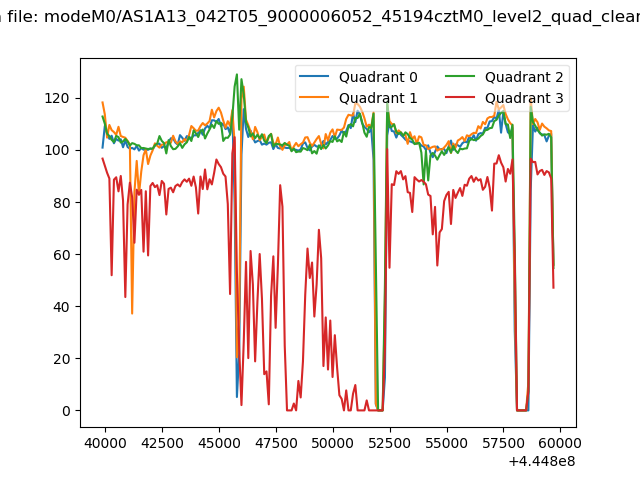 |
|
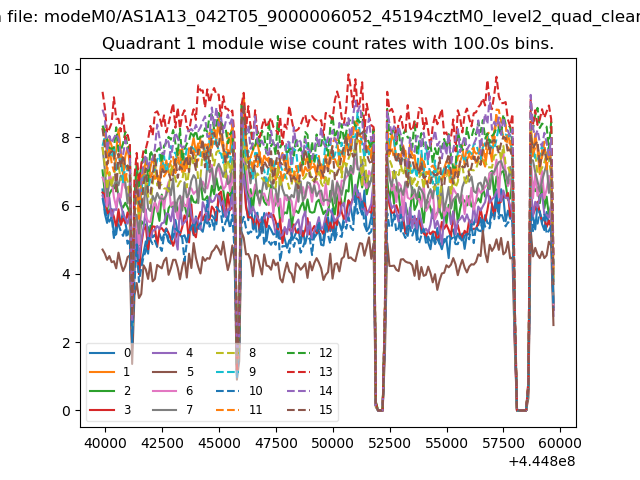
| Module-wise count rates for Quadrant A Data is divided into 100 sec bins |
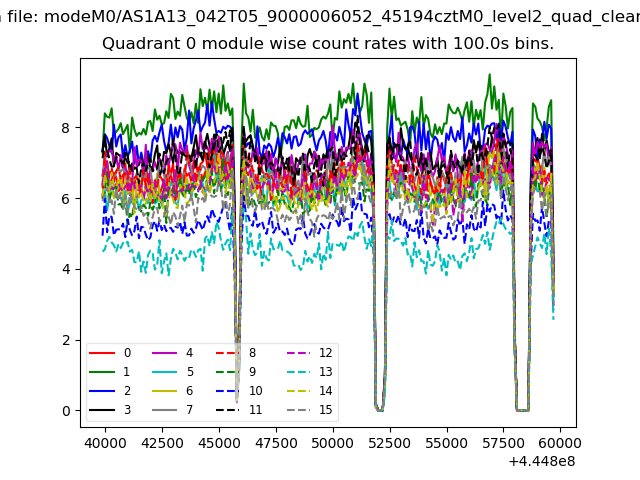 |
 |
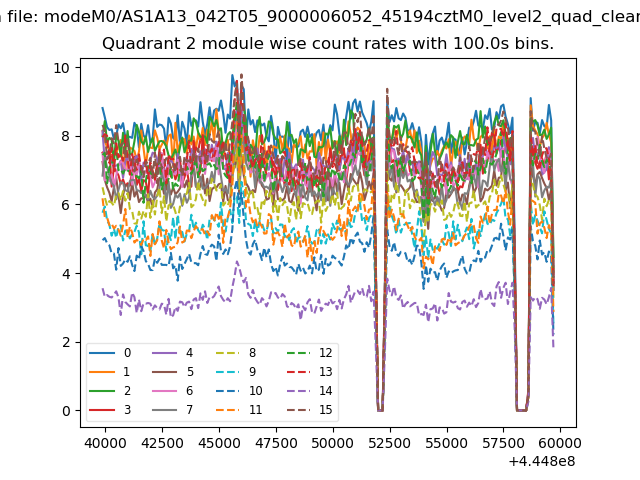
| Module-wise count rates for Quadrant B Data is divided into 100 sec bins |
 |
 |
| Module-wise count rates for Quadrant C Data is divided into 100 sec bins |
 |
 |
| Module-wise count rates for Quadrant D Data is divided into 100 sec bins |
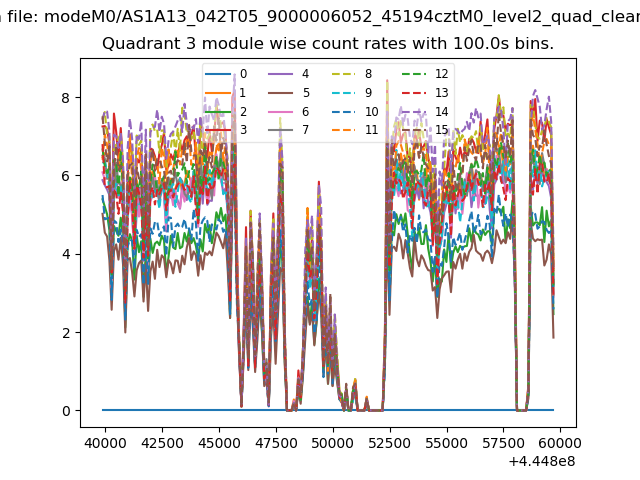 |
 |
| Parameter | Plot |
|---|---|
| CZT HV Monitor | 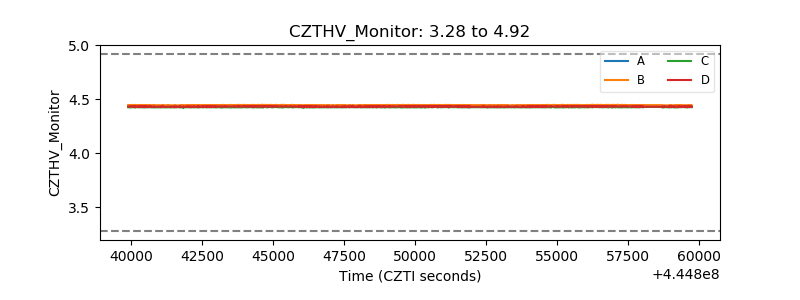 |
| D_VDD | 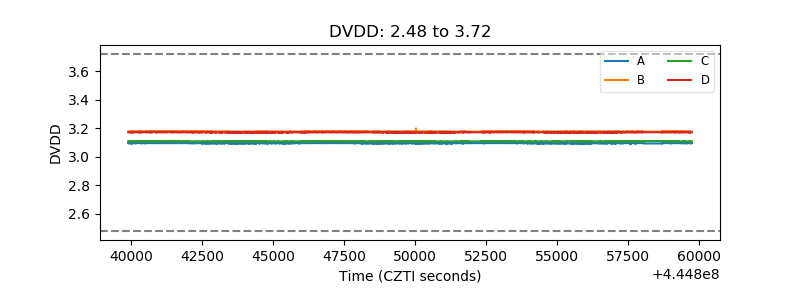 |
| Temperature 1 | 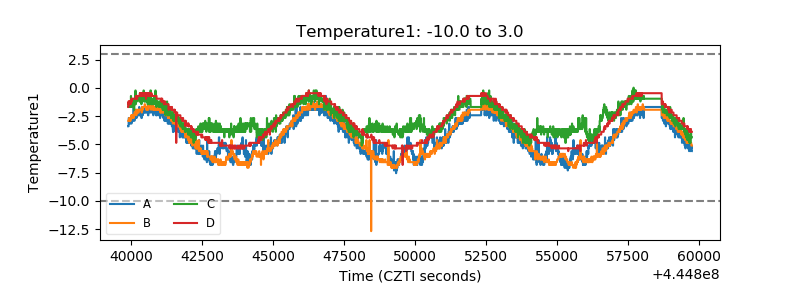 |
| Veto HV Monitor | 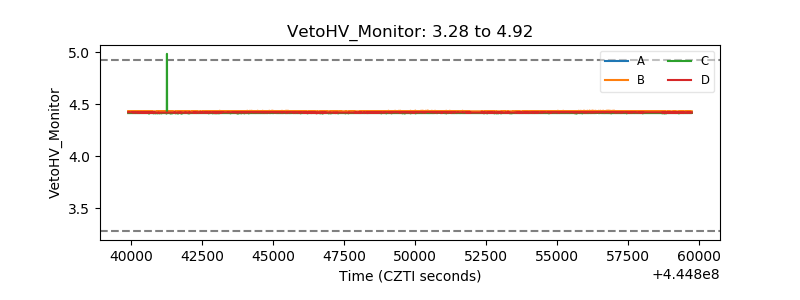 |
| Veto LLD | 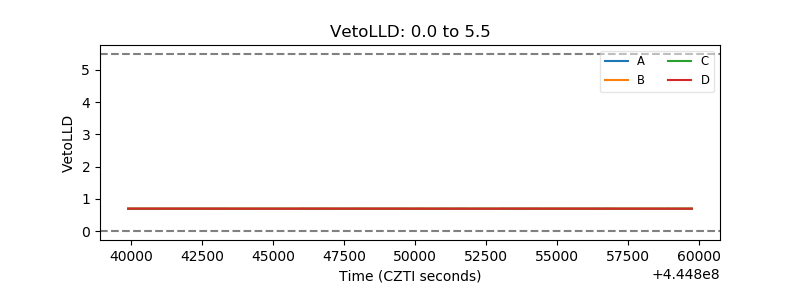 |
| Alpha Counter | 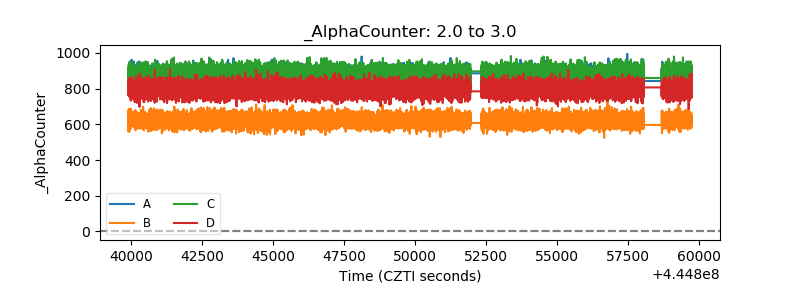 |
| _CPM_Rate | 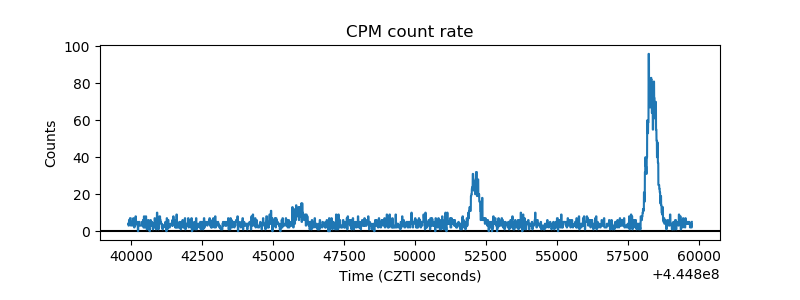 |
| CZT Counter | 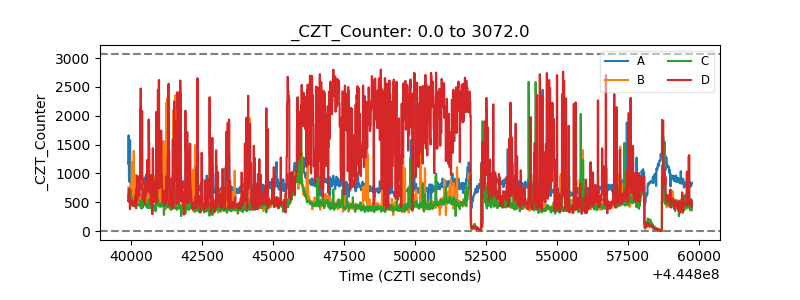 |
| +2.5 Volts monitor | 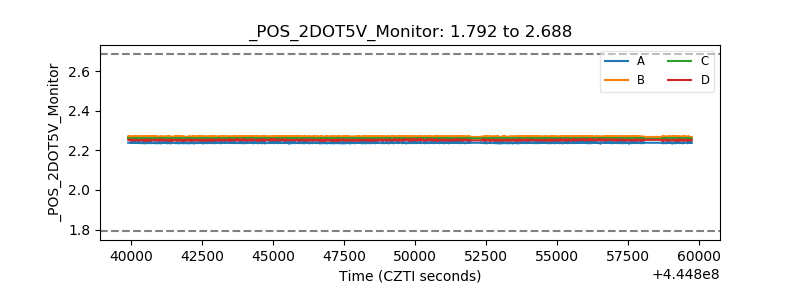 |
| +5 Volts monitor | 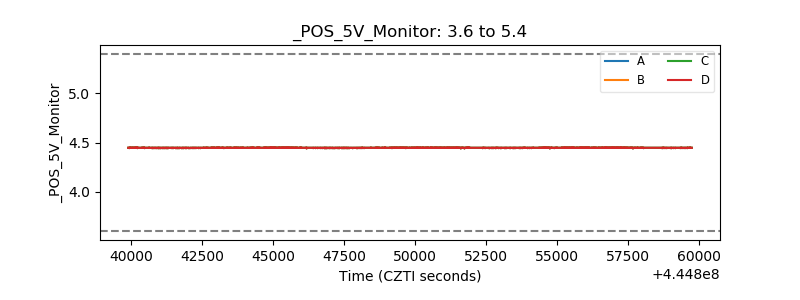 |
| _ROLL_ROT | 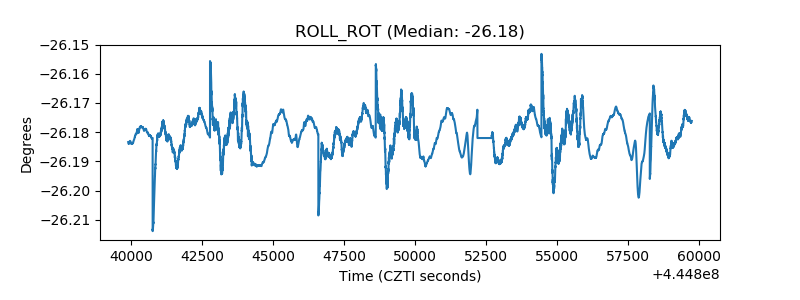 |
| _Roll_DEC | 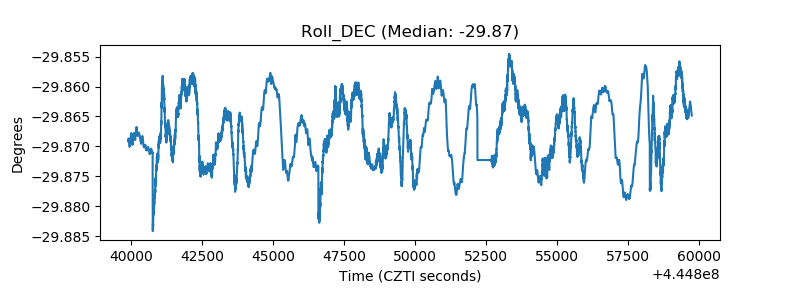 |
| _Roll_RA | 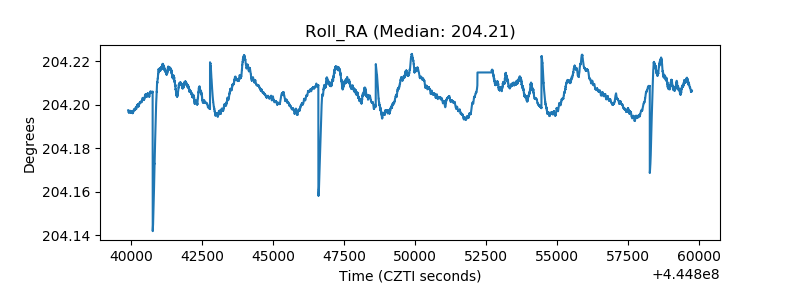 |
| Veto Counter | 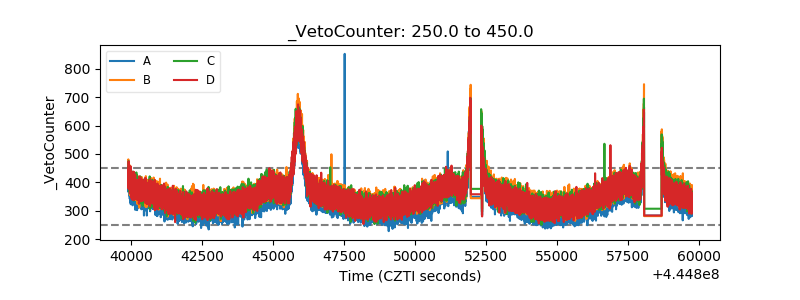 |