| Param | Original file | Final file |
|---|---|---|
| Filename | modeM0/AS1A13_049T06_9000006054_45196cztM0_level2.fits | modeM0/AS1A13_049T06_9000006054_45196cztM0_level2_quad_clean.evt |
| Size (bytes) | 1,099,307,520 | 253,877,760 |
| Size | 1.0 GB | 242.1 MB |
| Events in quadrant A | 12,830,290 | 1,671,985 |
| Events in quadrant B | 8,464,863 | 1,755,404 |
| Events in quadrant C | 7,181,792 | 1,691,982 |
| Events in quadrant D | 10,992,310 | 1,475,359 |
| Mode M0 | |||
|---|---|---|---|
| Quadrant | BADHDUFLAG | Total packets | Discarded packets |
| A | 0 | 50931 | 3 |
| B | 0 | 35967 | 3 |
| C | 0 | 32789 | 3 |
| D | 0 | 43816 | 14 |
| Mode M9 | |||
|---|---|---|---|
| Quadrant | BADHDUFLAG | Total packets | Discarded packets |
| A | 0 | 29 | 0 |
| B | 0 | 29 | 0 |
| C | 0 | 29 | 0 |
| D | 0 | 29 | 0 |
| Mode SS | |||
|---|---|---|---|
| Quadrant | BADHDUFLAG | Total packets | Discarded packets |
| A | 0 | 324 | 0 |
| B | 0 | 324 | 0 |
| C | 0 | 324 | 0 |
| D | 0 | 324 | 0 |
| Quadrant | Total seconds | Saturated seconds | Saturation percentage |
|---|---|---|---|
| A | 15822 | 416 | 2.629250% |
| B | 15822 | 233 | 1.472633% |
| C | 15823 | 42 | 0.265436% |
| D | 15819 | 731 | 4.621025% |
Noise dominated data is calculated using 1-second bins in cleaned event files. If a bin has >2000 counts, and if more than 50% of those come from <1% of pixels, then it is considered to be noise-dominated and hence unusable.
| Quadrant | # 1 sec bins | Bins with >0 counts | Bins with >2000 counts | High rate bins dominated by noise | Noise dominated (total time) | Noise dominated (detector-on time) | Marked lightcurve |
|---|---|---|---|---|---|---|---|
| A | 18732 | 15825 | 119 | 119 | 0.64% | 0.75% | 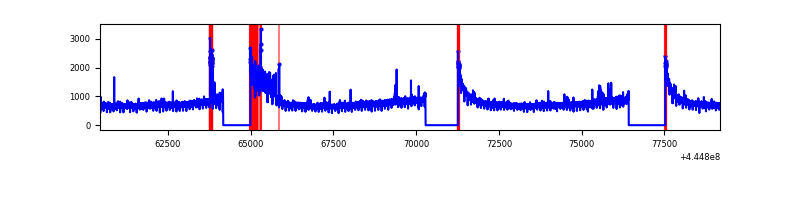 |
| B | 18732 | 15825 | 98 | 98 | 0.52% | 0.62% | 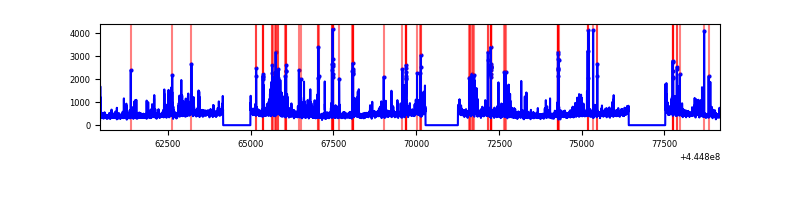 |
| C | 18733 | 15826 | 18 | 18 | 0.10% | 0.11% | 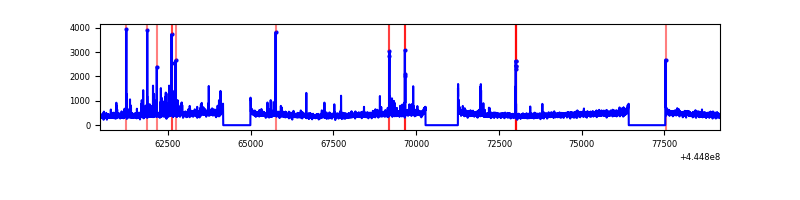 |
| D | 18733 | 15823 | 662 | 662 | 3.53% | 4.18% | 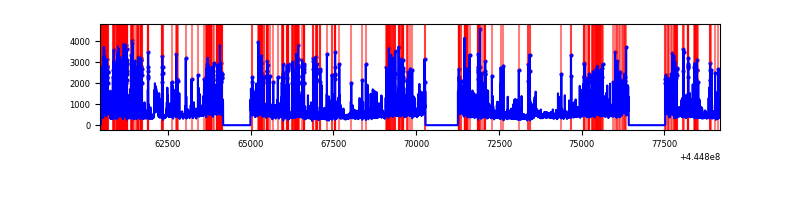 |
Top three noisy pixels from each quadrant. If the there are fewer than three noisy pixels in the level2.evt file, extra rows are filled as -1
| Pixel properties | Quadrant properties | ||||||
|---|---|---|---|---|---|---|---|
| Quadrant | DetID | PixID | Counts | Sigma | Mean | Median | Sigma |
| A | 10 | 83 | 5540339 | 15585.79 | 1731 | 1695 | 355.4 |
| A | 7 | 192 | 373220 | 1045.47 | 1731 | 1695 | 355.4 |
| A | 15 | 174 | 136227 | 378.57 | 1731 | 1695 | 355.4 |
| B | 4 | 170 | 781613 | 2283.82 | 1749 | 1692 | 341.5 |
| B | 3 | 112 | 315694 | 919.48 | 1749 | 1692 | 341.5 |
| B | 5 | 32 | 86336 | 247.86 | 1749 | 1692 | 341.5 |
| C | 12 | 2 | 183853 | 448.79 | 1736 | 1745 | 405.8 |
| C | 3 | 233 | 114856 | 278.75 | 1736 | 1745 | 405.8 |
| C | 2 | 14 | 64948 | 155.76 | 1736 | 1745 | 405.8 |
| D | 13 | 249 | 2090404 | 4915.7 | 1690 | 1643 | 424.9 |
| D | 1 | 47 | 743355 | 1745.55 | 1690 | 1643 | 424.9 |
| D | 5 | 235 | 456491 | 1070.44 | 1690 | 1643 | 424.9 |
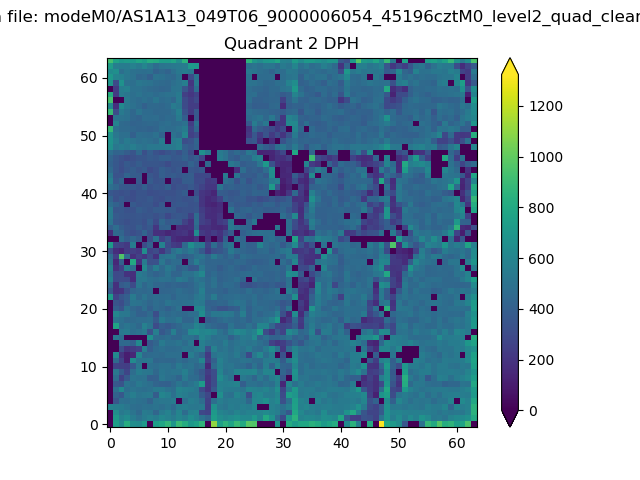
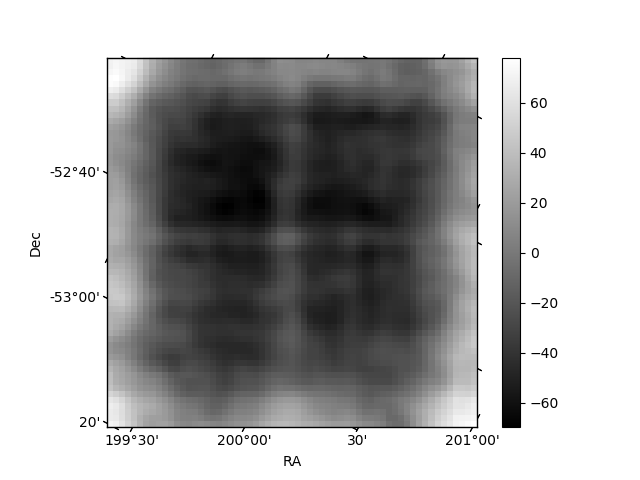
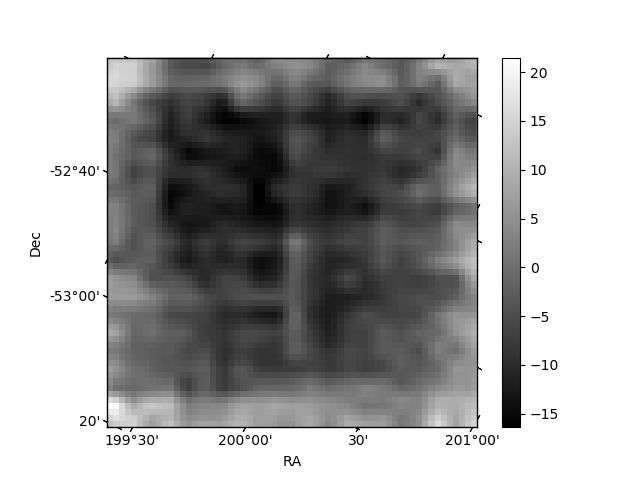
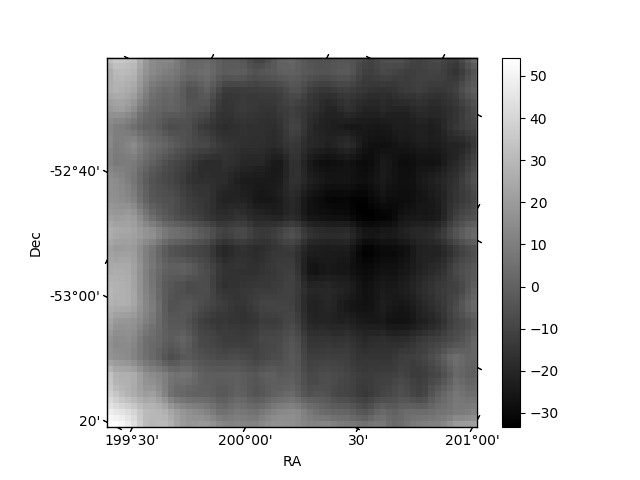
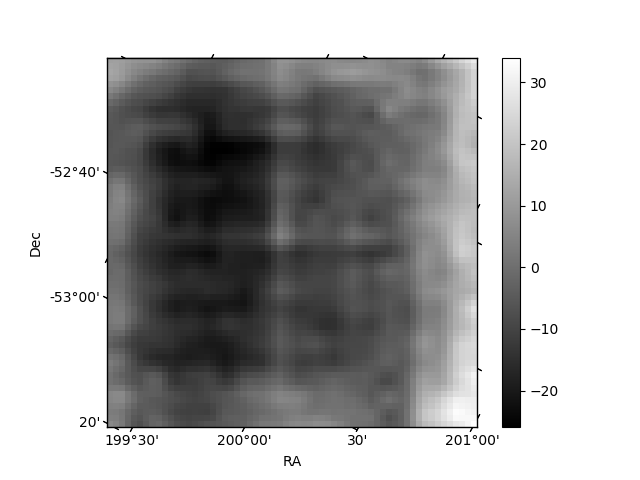
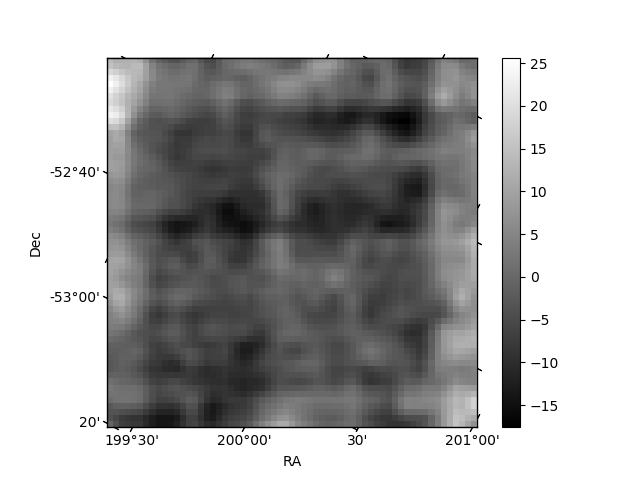
Histogram calculated using DETX and DETY for each event in the final _common_clean file
| Quadrant A | 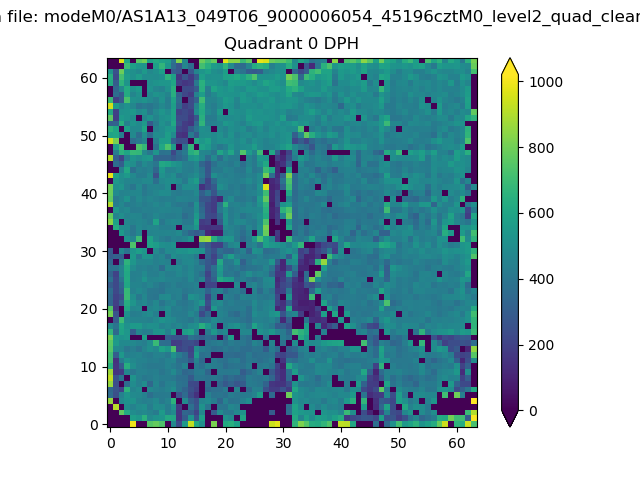 |
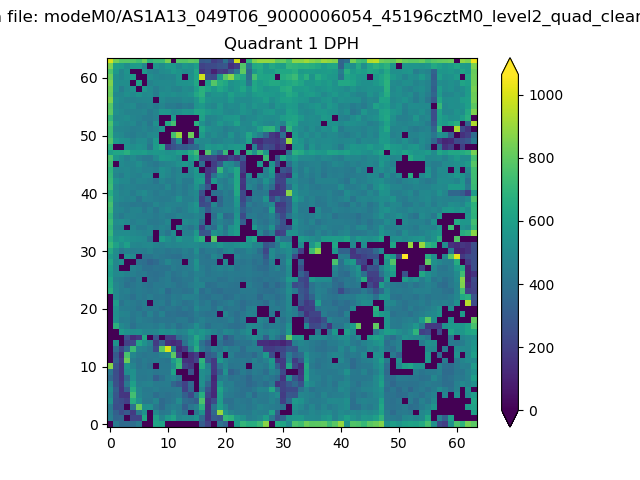 |
Quadrant B |
|---|---|---|---|
| Quadrant D | 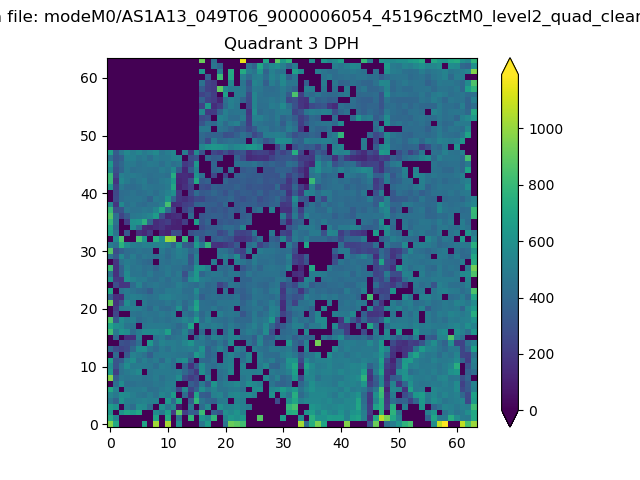 |
 |
Quadrant C |
| Plot type | Count rate plots | Images |
|---|---|---|
| Comparison with Poisson distribution Blue bars denote a histogram of data divided into 1 sec bins. Red curve is a Poisson curve with rate = median count rate of data. |
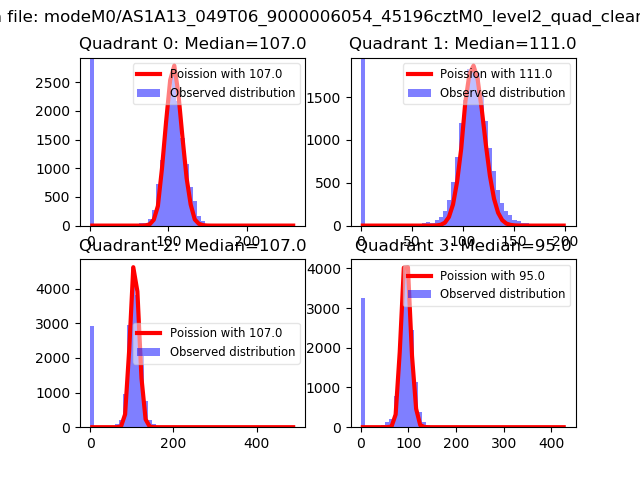 |
 |
| Quadrant-wise count rates Data is divided into 100 sec bins |
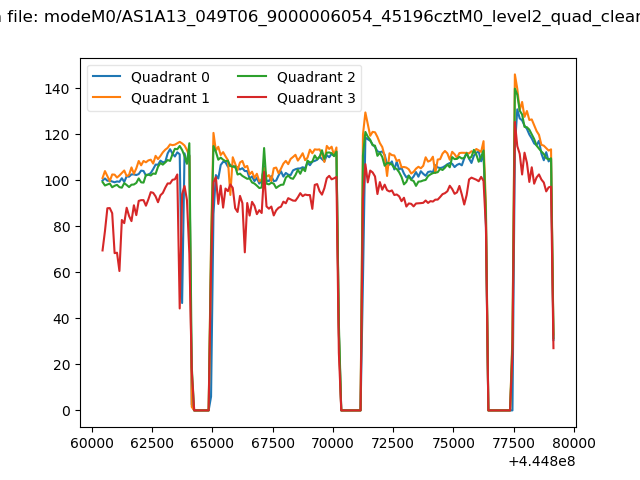 |
|
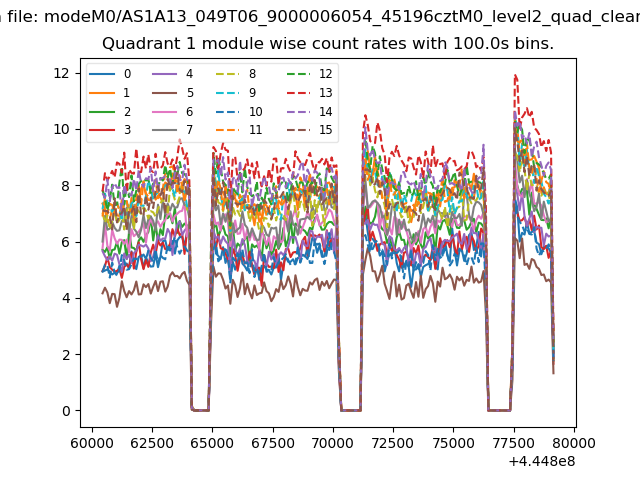
| Module-wise count rates for Quadrant A Data is divided into 100 sec bins |
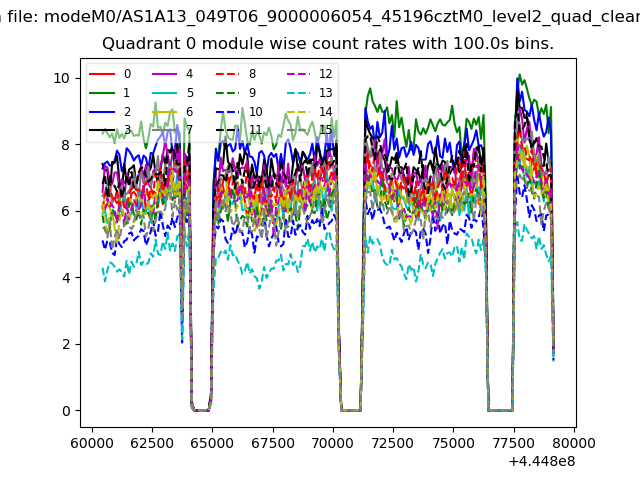 |
 |
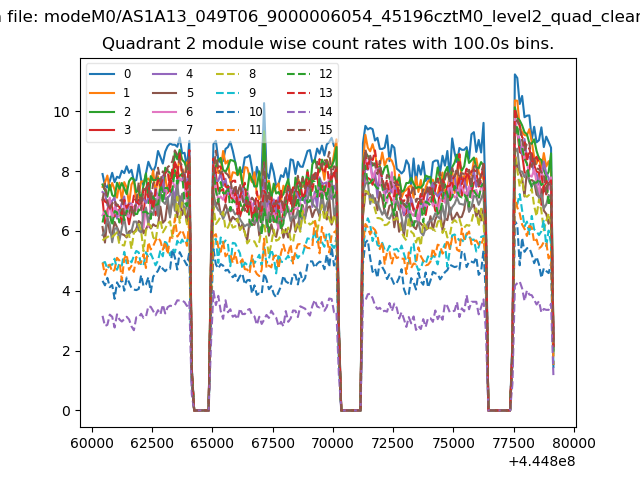
| Module-wise count rates for Quadrant B Data is divided into 100 sec bins |
 |
 |
| Module-wise count rates for Quadrant C Data is divided into 100 sec bins |
 |
 |
| Module-wise count rates for Quadrant D Data is divided into 100 sec bins |
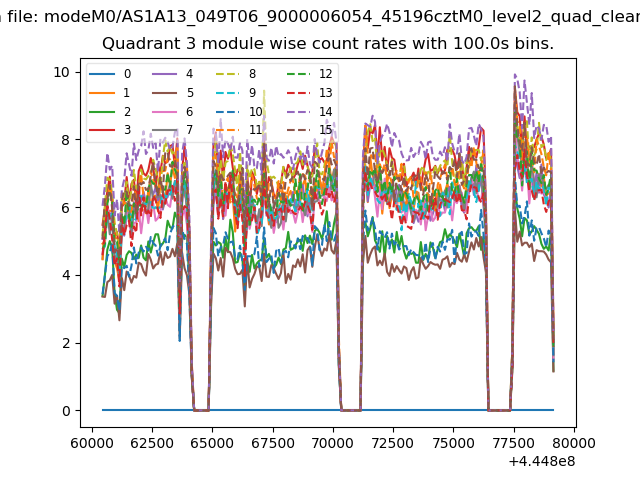 |
 |
| Parameter | Plot |
|---|---|
| CZT HV Monitor | 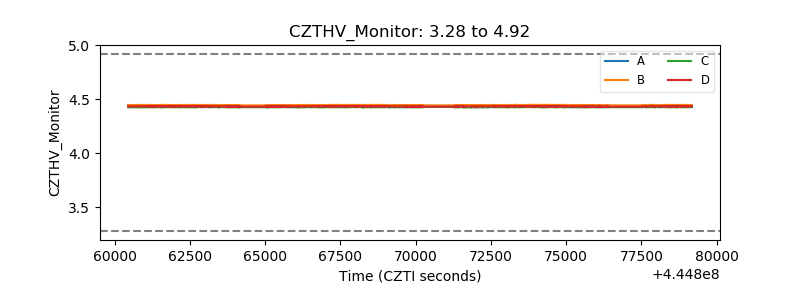 |
| D_VDD | 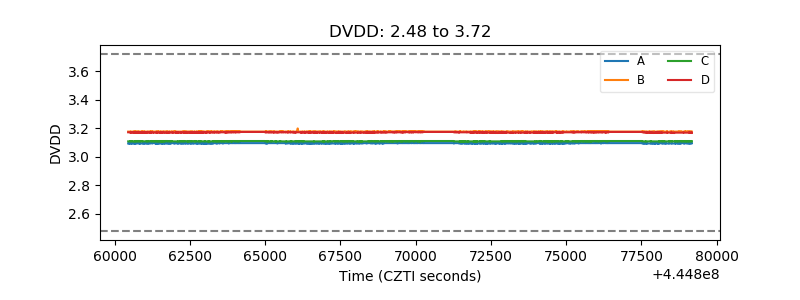 |
| Temperature 1 |  |
| Veto HV Monitor | 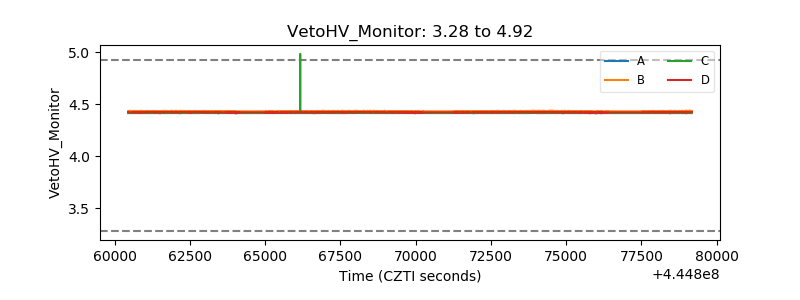 |
| Veto LLD | 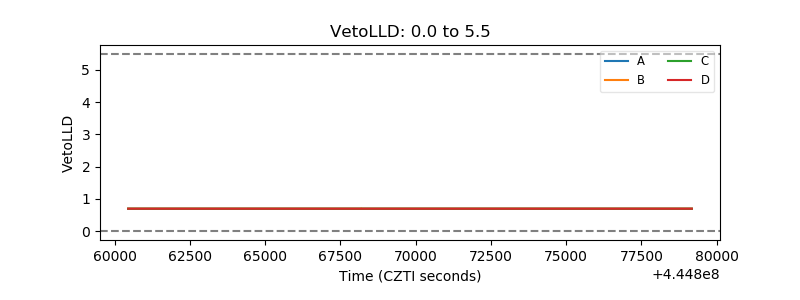 |
| Alpha Counter | 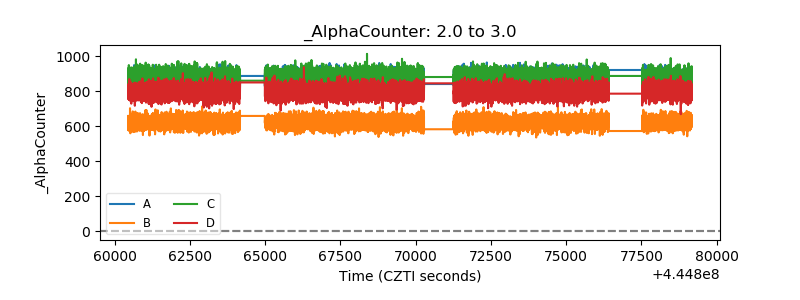 |
| _CPM_Rate | 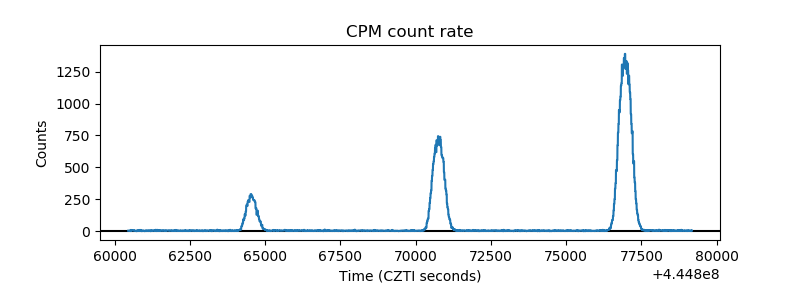 |
| CZT Counter | 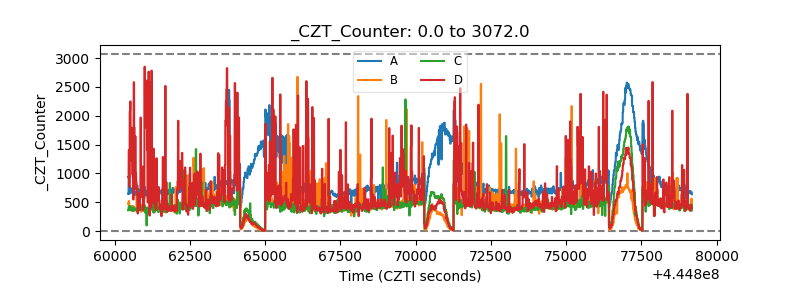 |
| +2.5 Volts monitor | 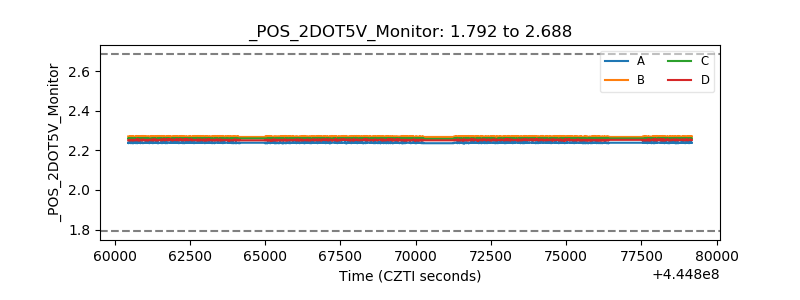 |
| +5 Volts monitor | 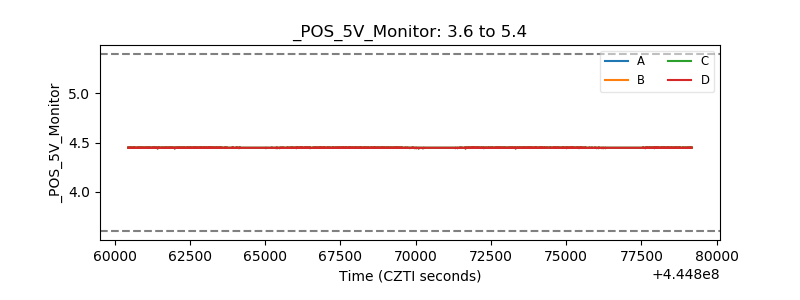 |
| _ROLL_ROT | 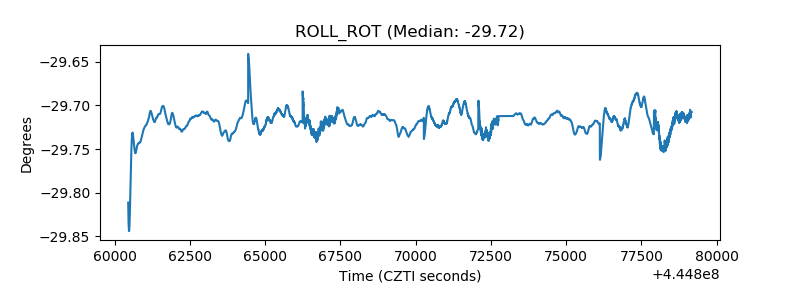 |
| _Roll_DEC | 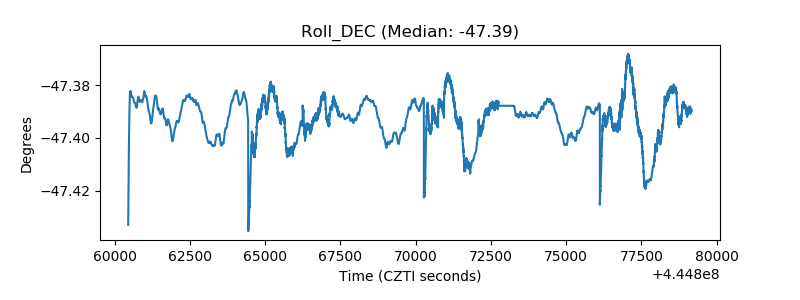 |
| _Roll_RA | 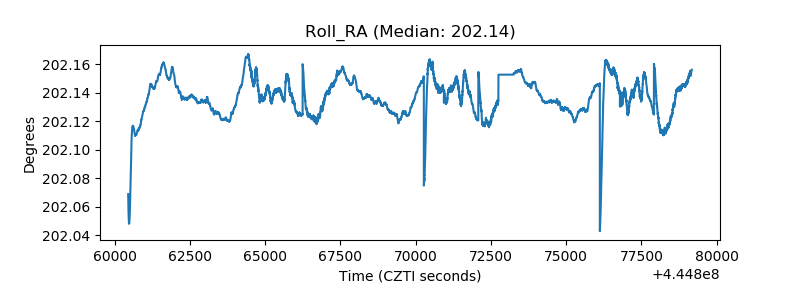 |
| Veto Counter | 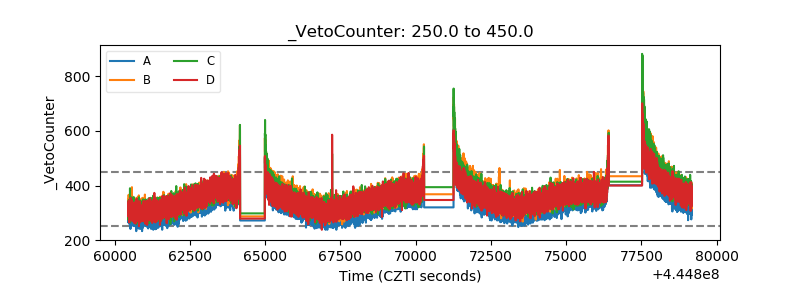 |