| Param | Original file | Final file |
|---|---|---|
| Filename | modeM0/AS1A13_049T06_9000006054_45197cztM0_level2.fits | modeM0/AS1A13_049T06_9000006054_45197cztM0_level2_quad_clean.evt |
| Size (bytes) | 447,045,120 | 107,291,520 |
| Size | 426.3 MB | 102.3 MB |
| Events in quadrant A | 4,959,942 | 715,185 |
| Events in quadrant B | 3,258,323 | 755,655 |
| Events in quadrant C | 3,262,141 | 724,371 |
| Events in quadrant D | 4,582,051 | 617,361 |
| Mode M0 | |||
|---|---|---|---|
| Quadrant | BADHDUFLAG | Total packets | Discarded packets |
| A | 0 | 19603 | 1 |
| B | 0 | 13855 | 1 |
| C | 0 | 13998 | 1 |
| D | 0 | 18015 | 1 |
| Mode M9 | |||
|---|---|---|---|
| Quadrant | BADHDUFLAG | Total packets | Discarded packets |
| A | 0 | 12 | 0 |
| B | 0 | 12 | 0 |
| C | 0 | 12 | 0 |
| D | 0 | 12 | 0 |
| Mode SS | |||
|---|---|---|---|
| Quadrant | BADHDUFLAG | Total packets | Discarded packets |
| A | 0 | 126 | 0 |
| B | 0 | 126 | 0 |
| C | 0 | 126 | 0 |
| D | 0 | 126 | 0 |
| Quadrant | Total seconds | Saturated seconds | Saturation percentage |
|---|---|---|---|
| A | 6256 | 87 | 1.390665% |
| B | 6256 | 56 | 0.895141% |
| C | 6256 | 48 | 0.767263% |
| D | 6257 | 450 | 7.191945% |
Noise dominated data is calculated using 1-second bins in cleaned event files. If a bin has >2000 counts, and if more than 50% of those come from <1% of pixels, then it is considered to be noise-dominated and hence unusable.
| Quadrant | # 1 sec bins | Bins with >0 counts | Bins with >2000 counts | High rate bins dominated by noise | Noise dominated (total time) | Noise dominated (detector-on time) | Marked lightcurve |
|---|---|---|---|---|---|---|---|
| A | 7431 | 6257 | 16 | 16 | 0.22% | 0.26% | 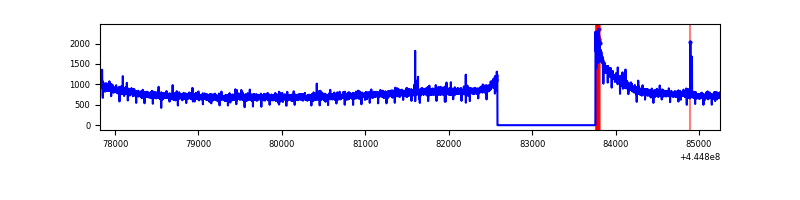 |
| B | 7431 | 6257 | 23 | 23 | 0.31% | 0.37% | 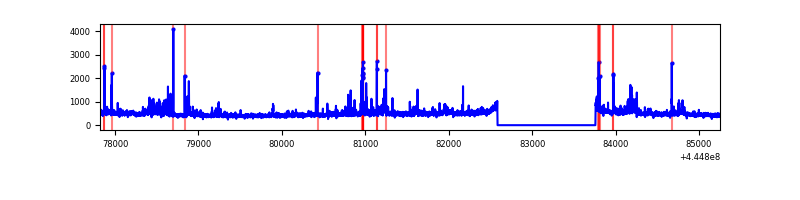 |
| C | 7431 | 6257 | 37 | 37 | 0.50% | 0.59% | 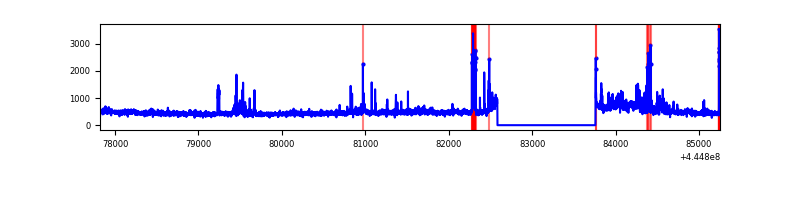 |
| D | 7431 | 6256 | 388 | 388 | 5.22% | 6.20% | 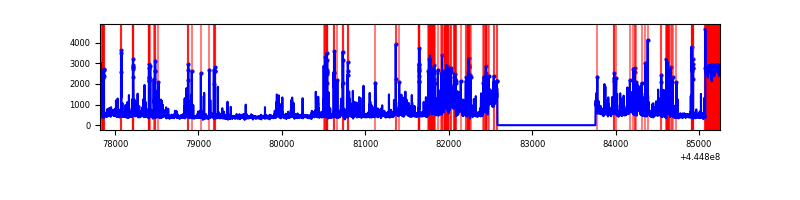 |
Top three noisy pixels from each quadrant. If the there are fewer than three noisy pixels in the level2.evt file, extra rows are filled as -1
| Pixel properties | Quadrant properties | ||||||
|---|---|---|---|---|---|---|---|
| Quadrant | DetID | PixID | Counts | Sigma | Mean | Median | Sigma |
| A | 10 | 83 | 2185871 | 14831.74 | 711 | 695 | 147.3 |
| A | 12 | 227 | 14638 | 94.64 | 711 | 695 | 147.3 |
| A | 13 | 248 | 10432 | 66.09 | 711 | 695 | 147.3 |
| B | 4 | 170 | 164551 | 1182.0 | 717 | 693 | 138.6 |
| B | 3 | 112 | 85690 | 613.13 | 717 | 693 | 138.6 |
| B | 0 | 183 | 38943 | 275.92 | 717 | 693 | 138.6 |
| C | 12 | 2 | 305973 | 1824.64 | 718 | 721 | 167.3 |
| C | 2 | 14 | 95767 | 568.14 | 718 | 721 | 167.3 |
| C | 3 | 233 | 44415 | 261.18 | 718 | 721 | 167.3 |
| D | 13 | 249 | 506800 | 2967.97 | 682 | 661 | 170.5 |
| D | 13 | 112 | 467451 | 2737.23 | 682 | 661 | 170.5 |
| D | 5 | 171 | 274680 | 1606.83 | 682 | 661 | 170.5 |
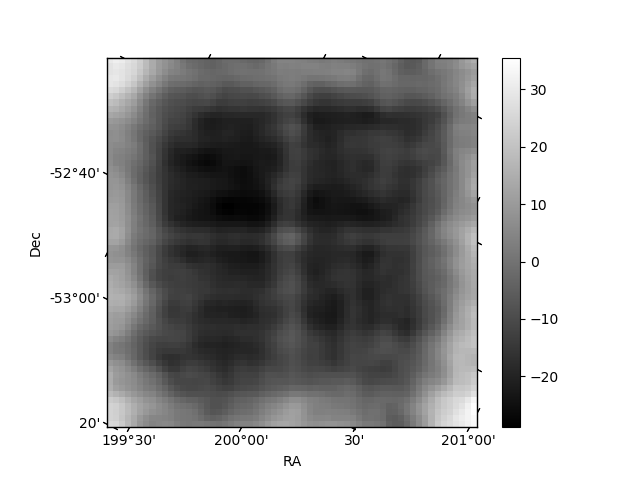
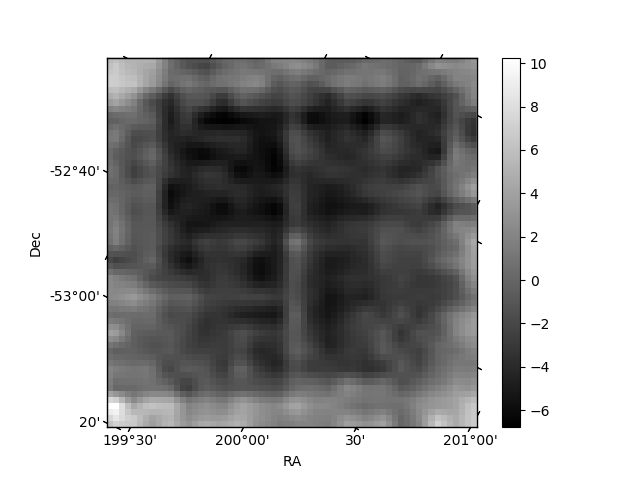
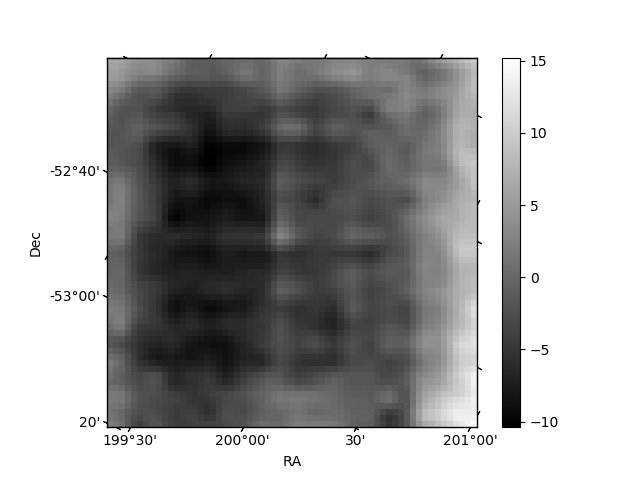
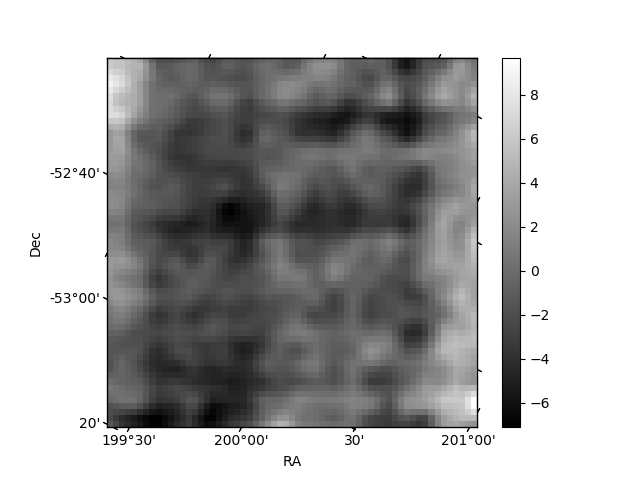
Histogram calculated using DETX and DETY for each event in the final _common_clean file
| Quadrant A | 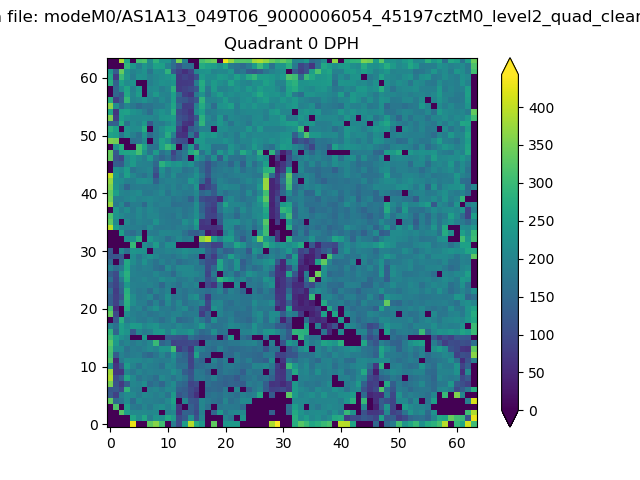 |
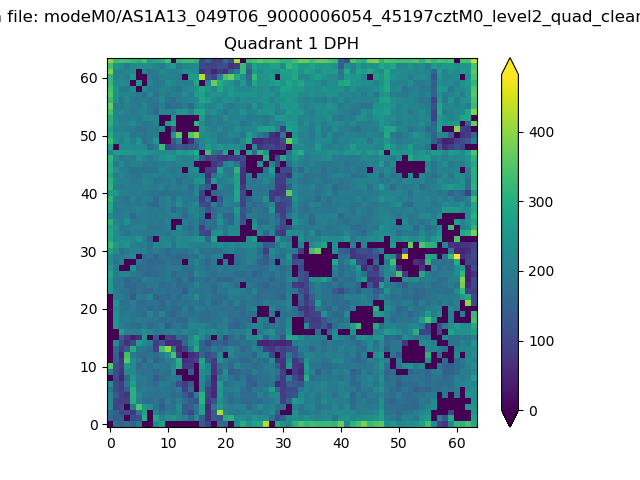 |
Quadrant B |
|---|---|---|---|
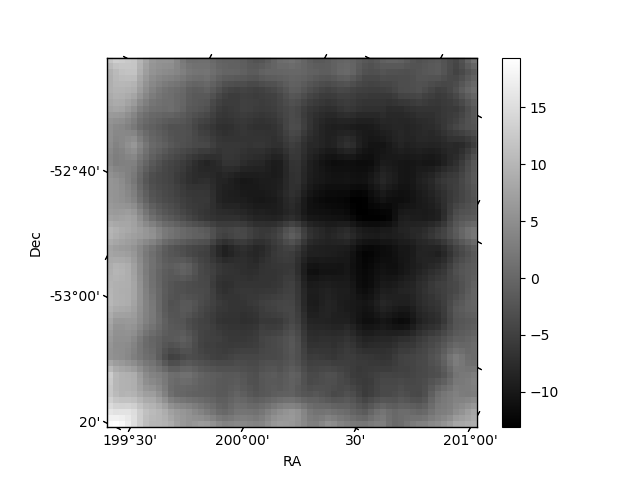
| Quadrant D | 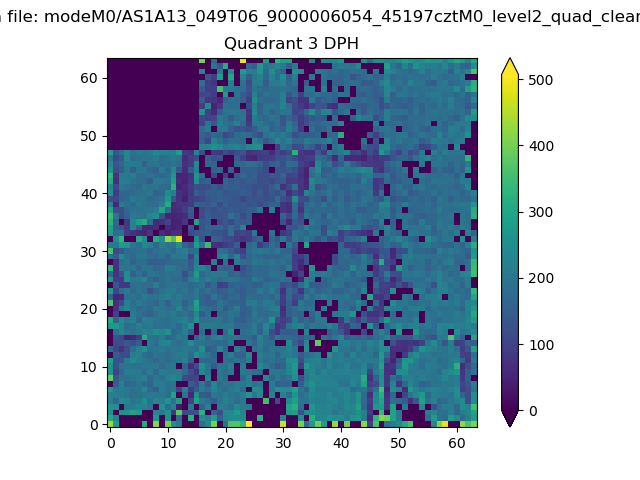 |
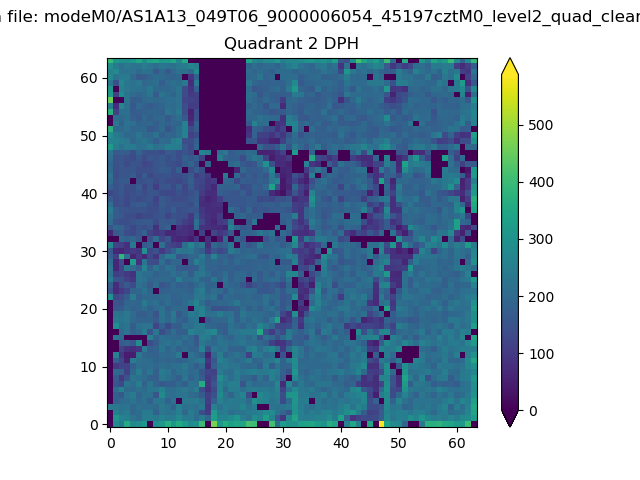 |
Quadrant C |
| Plot type | Count rate plots | Images |
|---|---|---|
| Comparison with Poisson distribution Blue bars denote a histogram of data divided into 1 sec bins. Red curve is a Poisson curve with rate = median count rate of data. |
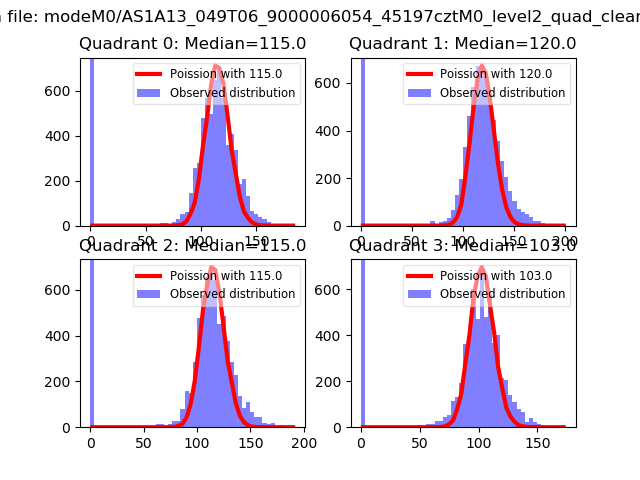 |
 |
| Quadrant-wise count rates Data is divided into 100 sec bins |
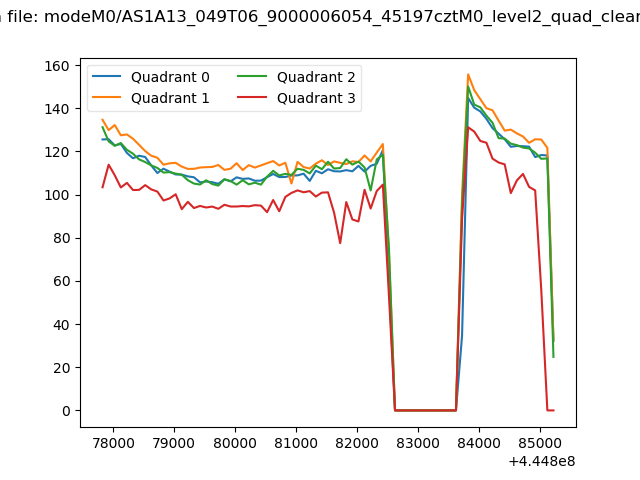 |
|
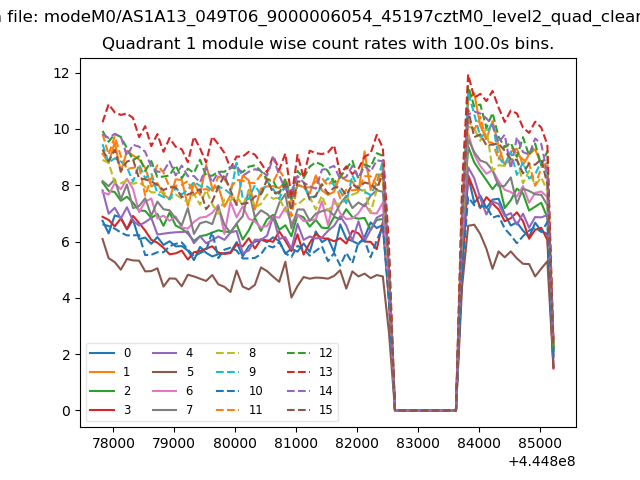
| Module-wise count rates for Quadrant A Data is divided into 100 sec bins |
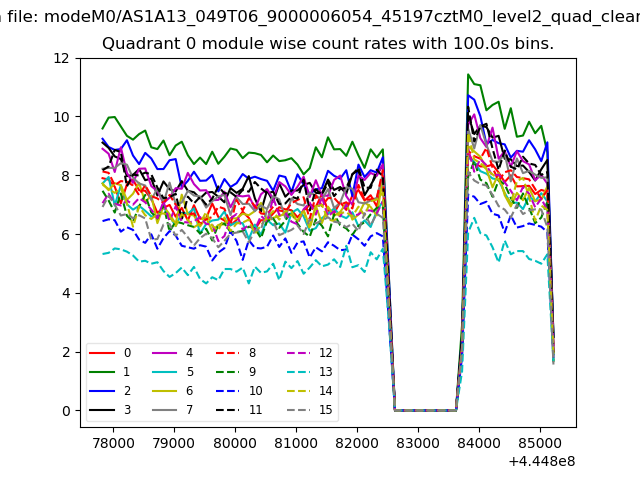 |
 |
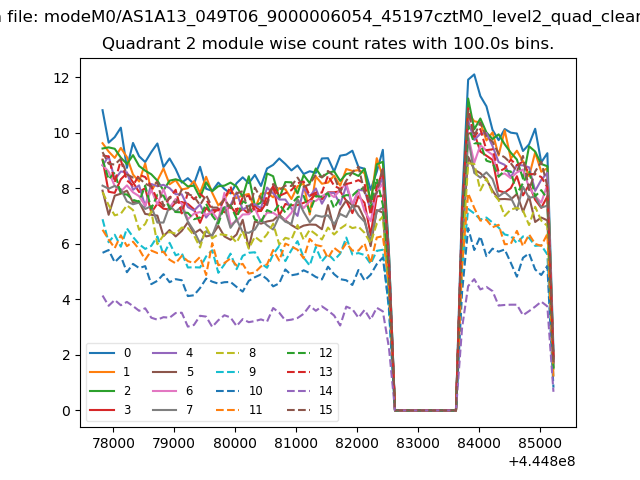
| Module-wise count rates for Quadrant B Data is divided into 100 sec bins |
 |
 |
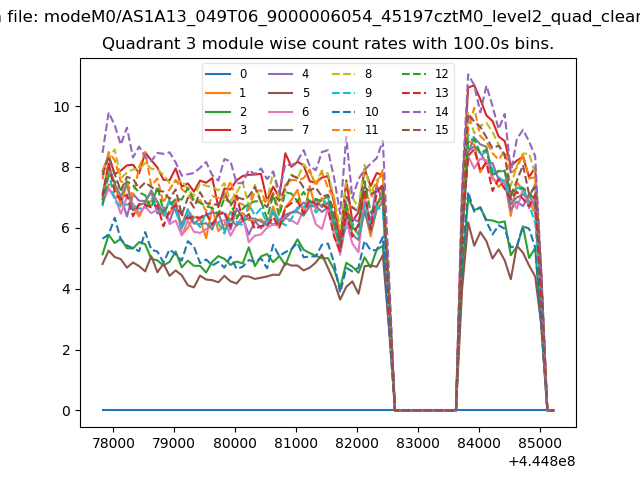
| Module-wise count rates for Quadrant C Data is divided into 100 sec bins |
 |
 |
| Module-wise count rates for Quadrant D Data is divided into 100 sec bins |
 |
 |
| Parameter | Plot |
|---|---|
| CZT HV Monitor |  |
| D_VDD | 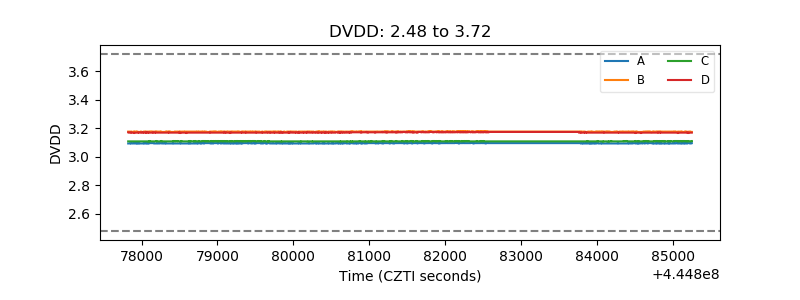 |
| Temperature 1 | 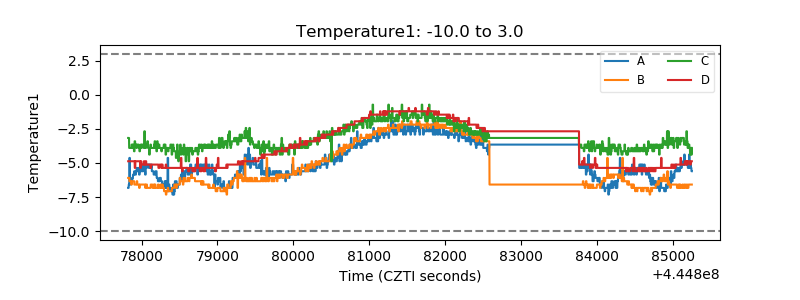 |
| Veto HV Monitor | 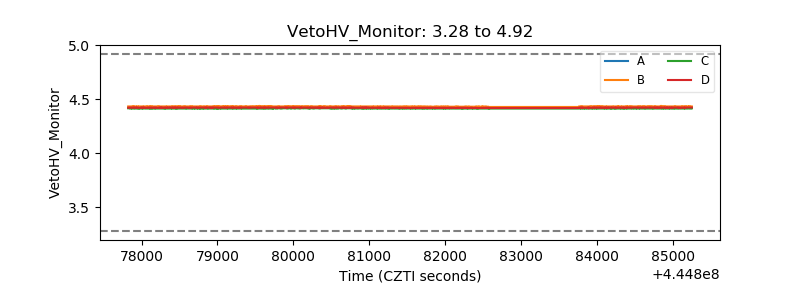 |
| Veto LLD | 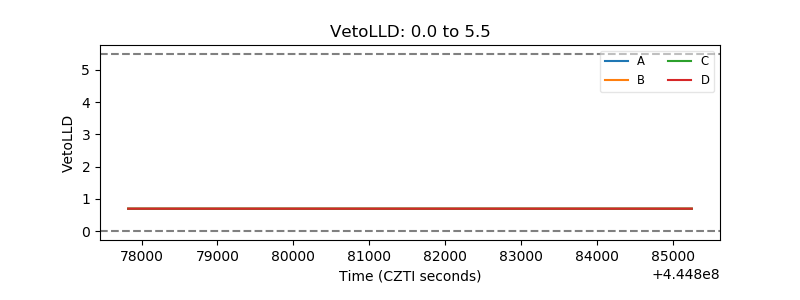 |
| Alpha Counter | 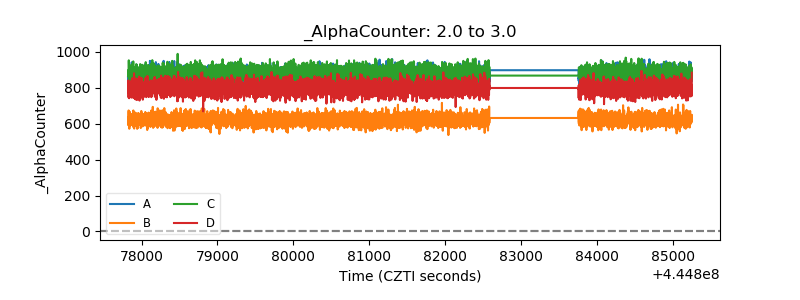 |
| _CPM_Rate | 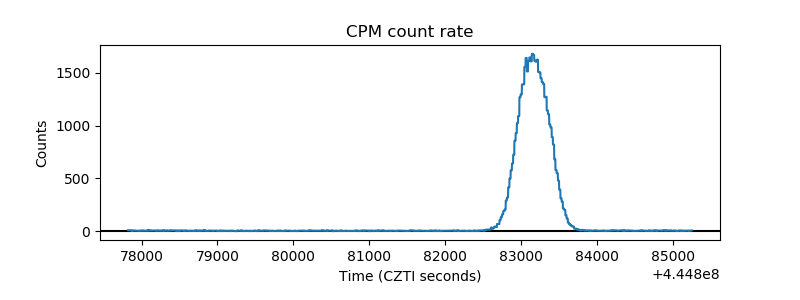 |
| CZT Counter | 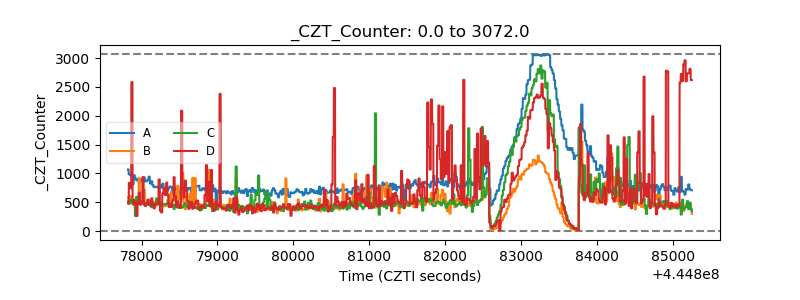 |
| +2.5 Volts monitor | 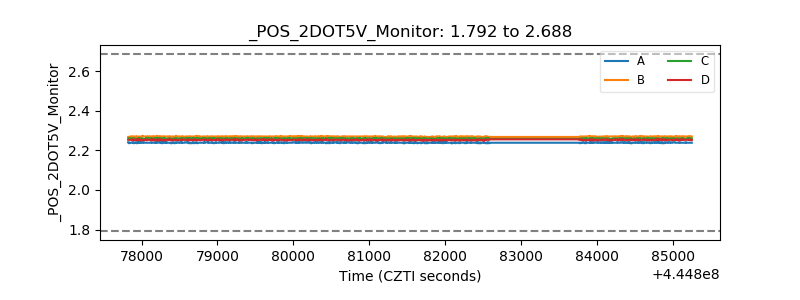 |
| +5 Volts monitor | 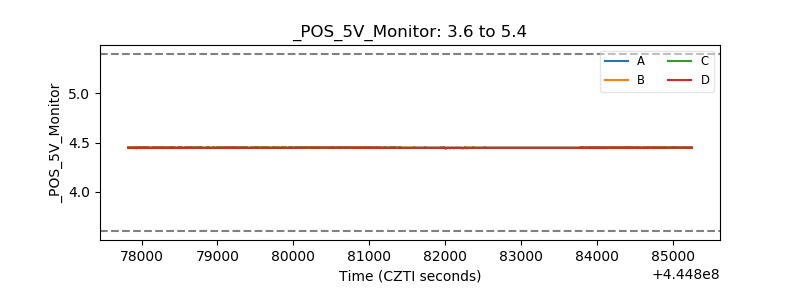 |
| _ROLL_ROT | 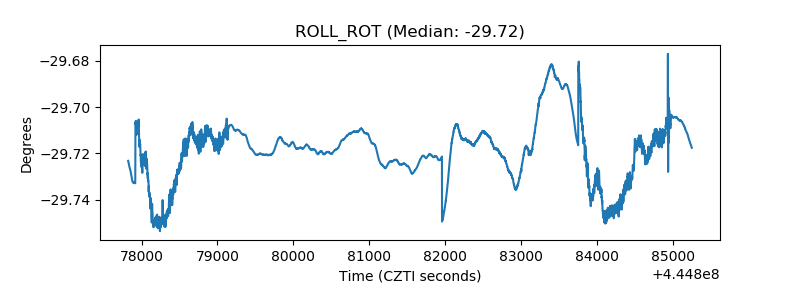 |
| _Roll_DEC | 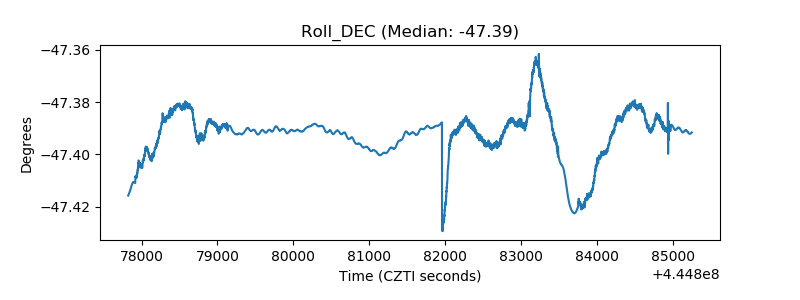 |
| _Roll_RA | 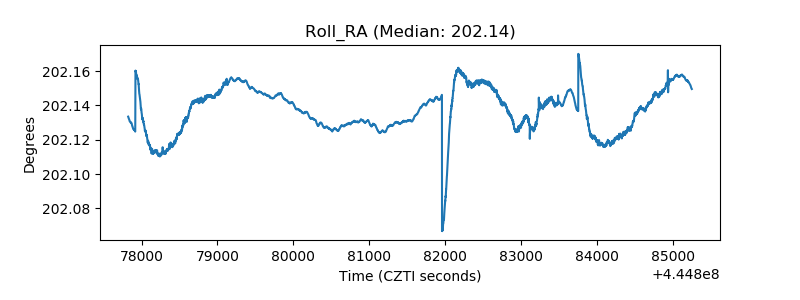 |
| Veto Counter | 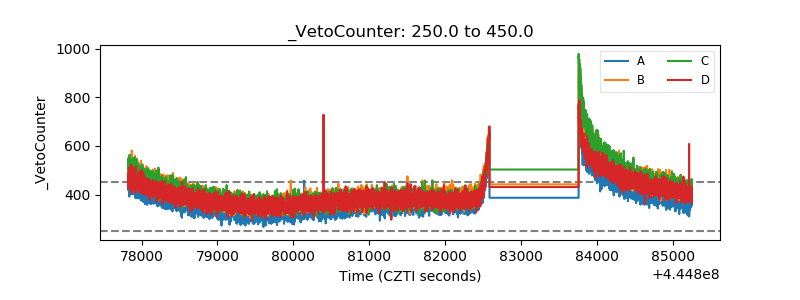 |