| Param | Original file | Final file |
|---|---|---|
| Filename | modeM0/AS1A13_049T06_9000006054_45198cztM0_level2.fits | modeM0/AS1A13_049T06_9000006054_45198cztM0_level2_quad_clean.evt |
| Size (bytes) | 483,796,800 | 113,627,520 |
| Size | 461.4 MB | 108.4 MB |
| Events in quadrant A | 5,420,224 | 760,560 |
| Events in quadrant B | 3,530,700 | 803,057 |
| Events in quadrant C | 3,375,657 | 775,528 |
| Events in quadrant D | 5,085,540 | 655,263 |
| Mode M0 | |||
|---|---|---|---|
| Quadrant | BADHDUFLAG | Total packets | Discarded packets |
| A | 0 | 20699 | 2 |
| B | 0 | 14700 | 2 |
| C | 0 | 14232 | 2 |
| D | 0 | 19463 | 2 |
| Mode M9 | |||
|---|---|---|---|
| Quadrant | BADHDUFLAG | Total packets | Discarded packets |
| A | 0 | 16 | 0 |
| B | 0 | 16 | 0 |
| C | 0 | 17 | 0 |
| D | 0 | 17 | 0 |
| Mode SS | |||
|---|---|---|---|
| Quadrant | BADHDUFLAG | Total packets | Discarded packets |
| A | 0 | 130 | 0 |
| B | 0 | 130 | 0 |
| C | 0 | 130 | 0 |
| D | 0 | 130 | 0 |
| Quadrant | Total seconds | Saturated seconds | Saturation percentage |
|---|---|---|---|
| A | 6399 | 137 | 2.140960% |
| B | 6399 | 65 | 1.015784% |
| C | 6399 | 43 | 0.671980% |
| D | 6399 | 535 | 8.360681% |
Noise dominated data is calculated using 1-second bins in cleaned event files. If a bin has >2000 counts, and if more than 50% of those come from <1% of pixels, then it is considered to be noise-dominated and hence unusable.
| Quadrant | # 1 sec bins | Bins with >0 counts | Bins with >2000 counts | High rate bins dominated by noise | Noise dominated (total time) | Noise dominated (detector-on time) | Marked lightcurve |
|---|---|---|---|---|---|---|---|
| A | 7629 | 6400 | 22 | 22 | 0.29% | 0.34% | 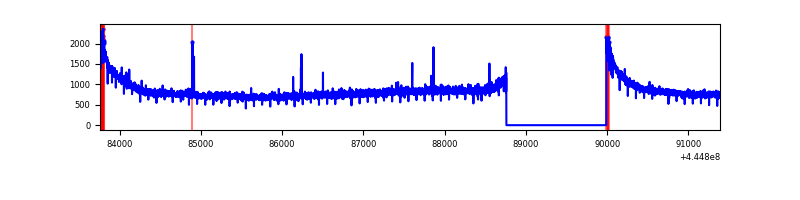 |
| B | 7629 | 6400 | 17 | 17 | 0.22% | 0.27% | 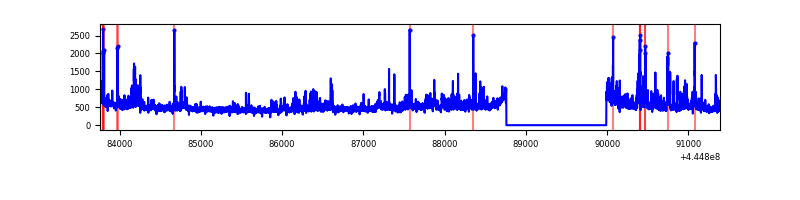 |
| C | 7629 | 6400 | 23 | 23 | 0.30% | 0.36% | 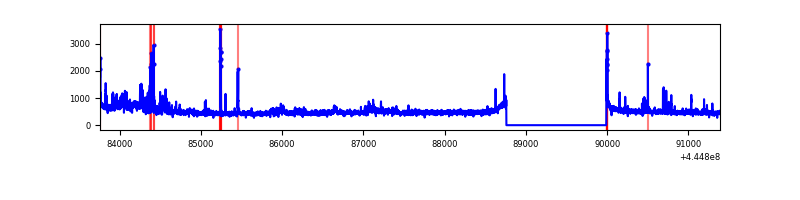 |
| D | 7629 | 6400 | 457 | 457 | 5.99% | 7.14% | 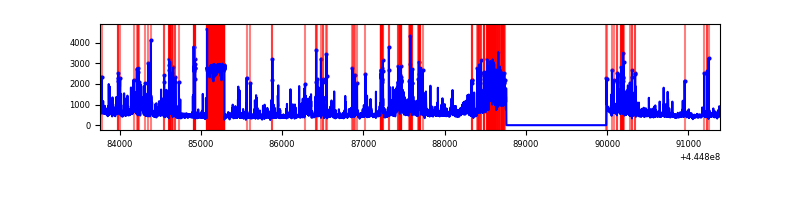 |
Top three noisy pixels from each quadrant. If the there are fewer than three noisy pixels in the level2.evt file, extra rows are filled as -1
| Pixel properties | Quadrant properties | ||||||
|---|---|---|---|---|---|---|---|
| Quadrant | DetID | PixID | Counts | Sigma | Mean | Median | Sigma |
| A | 10 | 83 | 2473830 | 16011.78 | 750 | 734 | 154.5 |
| A | 12 | 227 | 24998 | 157.09 | 750 | 734 | 154.5 |
| A | 13 | 248 | 17410 | 107.96 | 750 | 734 | 154.5 |
| B | 4 | 170 | 242696 | 1645.34 | 758 | 734 | 147.1 |
| B | 3 | 112 | 188619 | 1277.62 | 758 | 734 | 147.1 |
| B | 0 | 183 | 53376 | 357.97 | 758 | 734 | 147.1 |
| C | 12 | 2 | 263053 | 1483.87 | 762 | 768 | 176.8 |
| C | 3 | 233 | 106872 | 600.28 | 762 | 768 | 176.8 |
| C | 1 | 3 | 28154 | 154.94 | 762 | 768 | 176.8 |
| D | 13 | 112 | 567510 | 3141.2 | 722 | 702 | 180.4 |
| D | 4 | 221 | 414960 | 2295.78 | 722 | 702 | 180.4 |
| D | 13 | 249 | 303749 | 1679.46 | 722 | 702 | 180.4 |
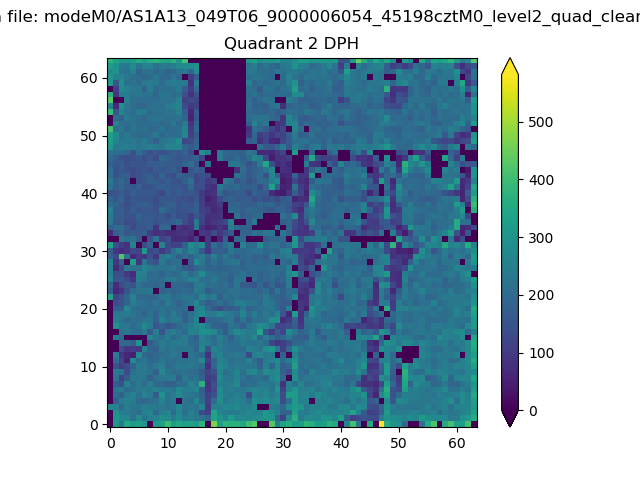
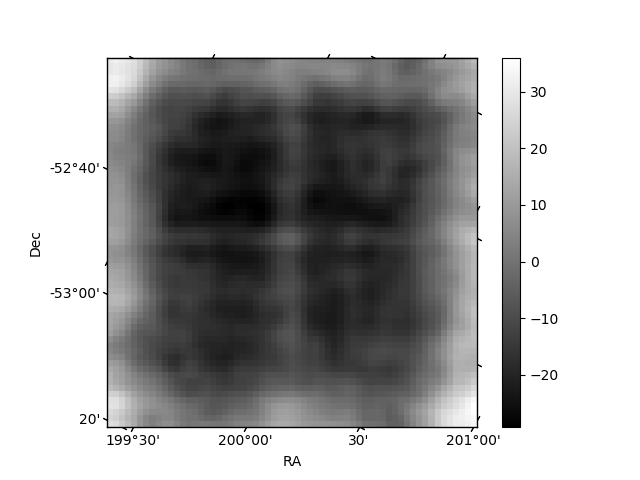
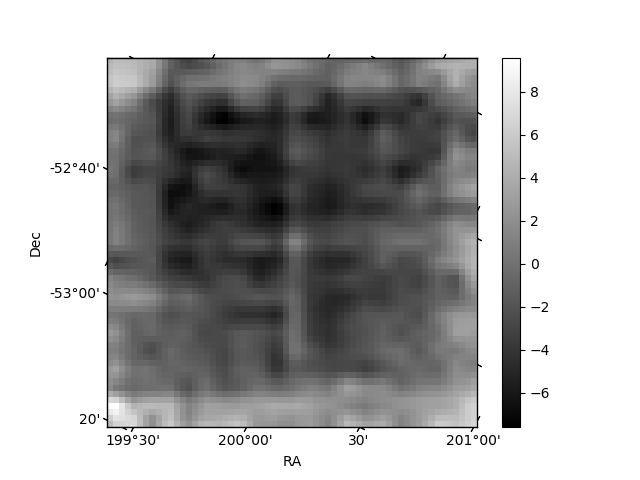
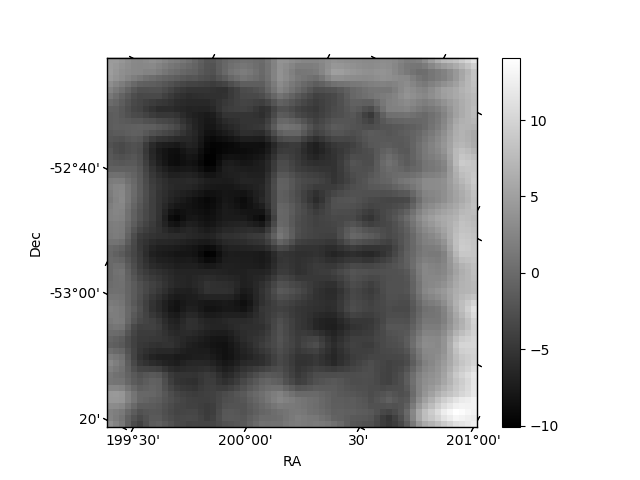
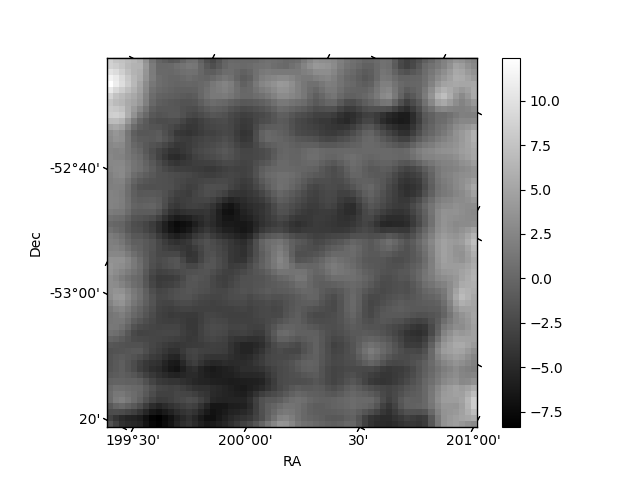
Histogram calculated using DETX and DETY for each event in the final _common_clean file
| Quadrant A | 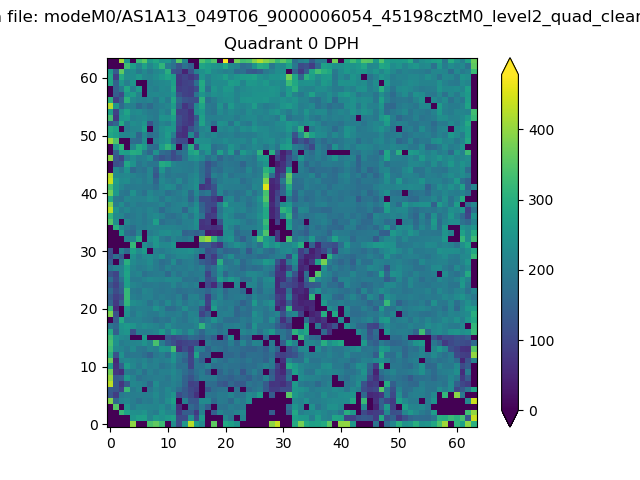 |
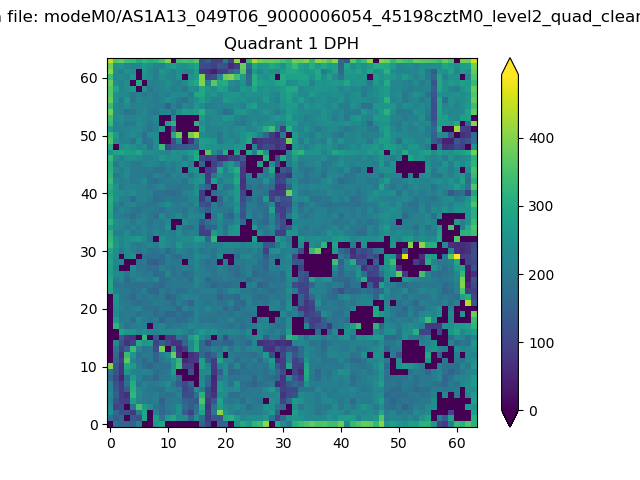 |
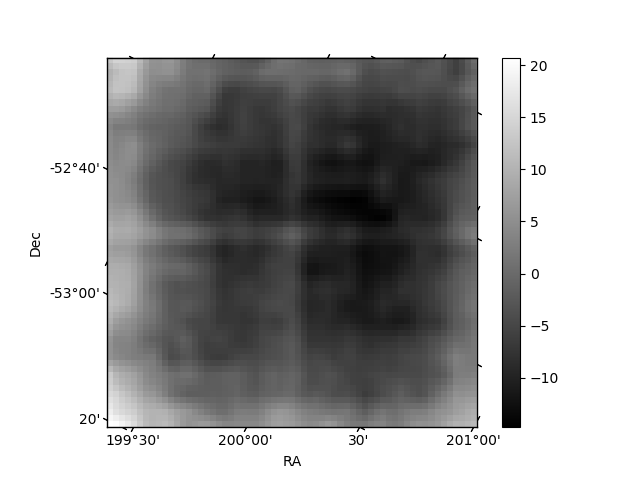
Quadrant B |
|---|---|---|---|
| Quadrant D | 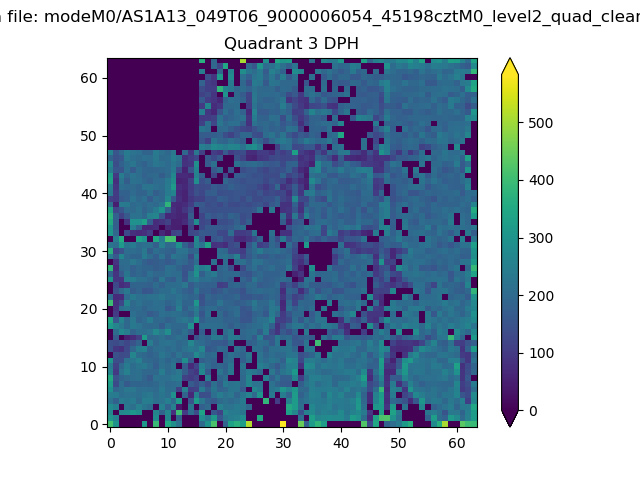 |
 |
Quadrant C |
| Plot type | Count rate plots | Images |
|---|---|---|
| Comparison with Poisson distribution Blue bars denote a histogram of data divided into 1 sec bins. Red curve is a Poisson curve with rate = median count rate of data. |
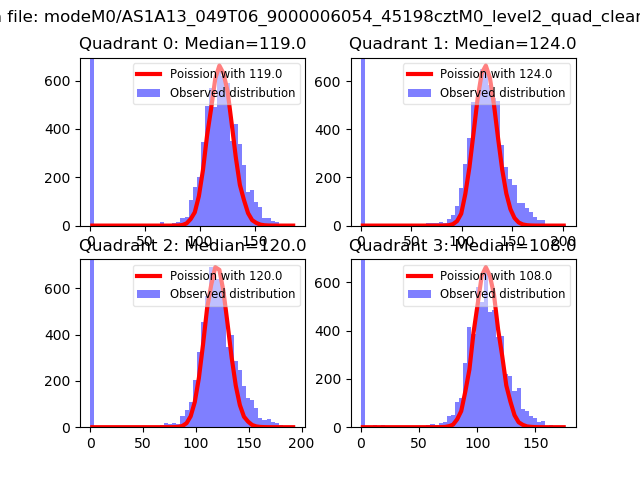 |
 |
| Quadrant-wise count rates Data is divided into 100 sec bins |
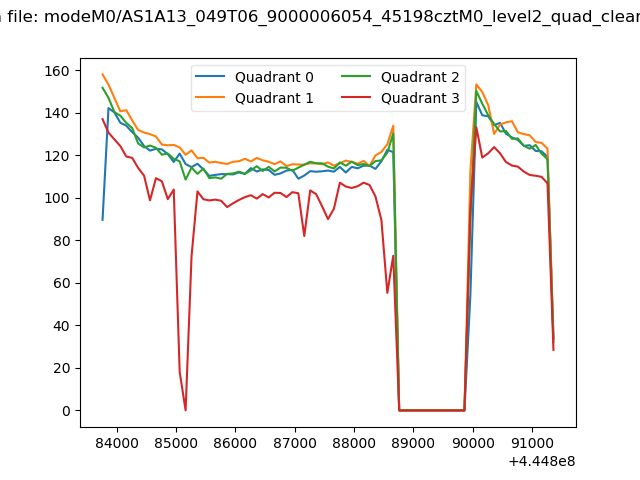 |
|
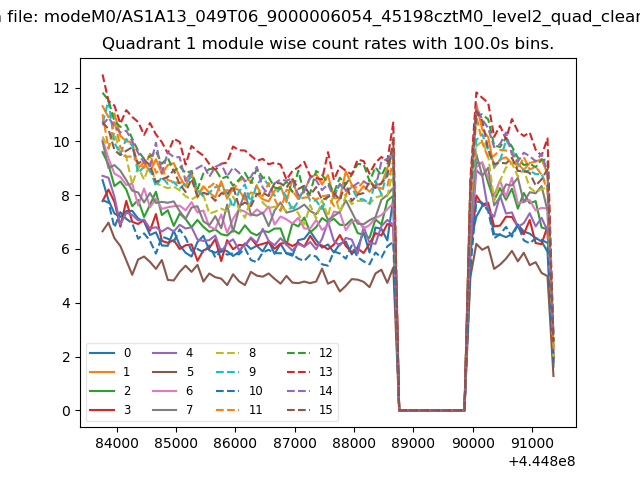
| Module-wise count rates for Quadrant A Data is divided into 100 sec bins |
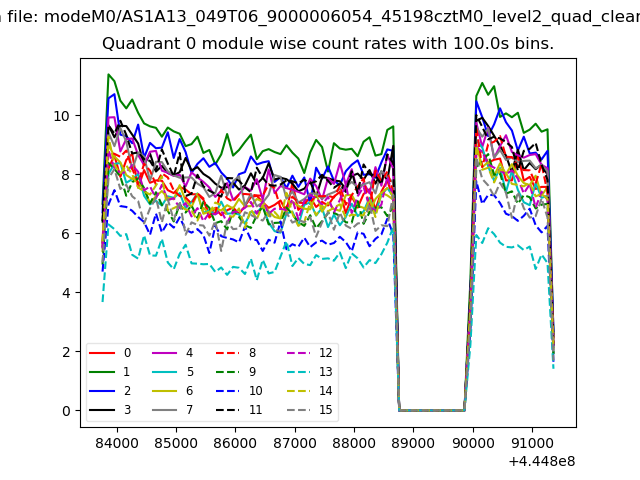 |
 |
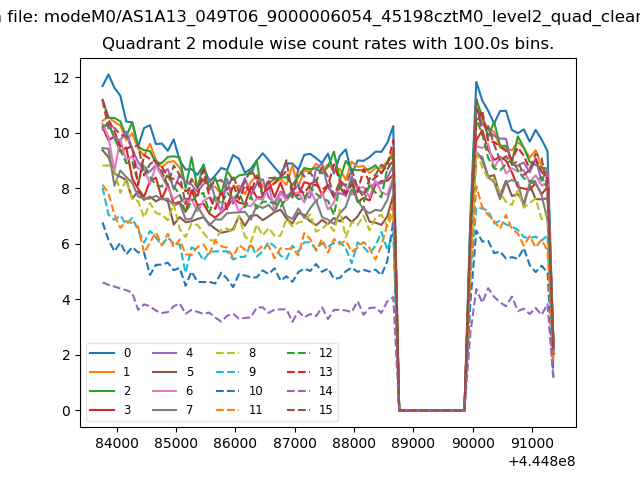
| Module-wise count rates for Quadrant B Data is divided into 100 sec bins |
 |
 |
| Module-wise count rates for Quadrant C Data is divided into 100 sec bins |
 |
 |
| Module-wise count rates for Quadrant D Data is divided into 100 sec bins |
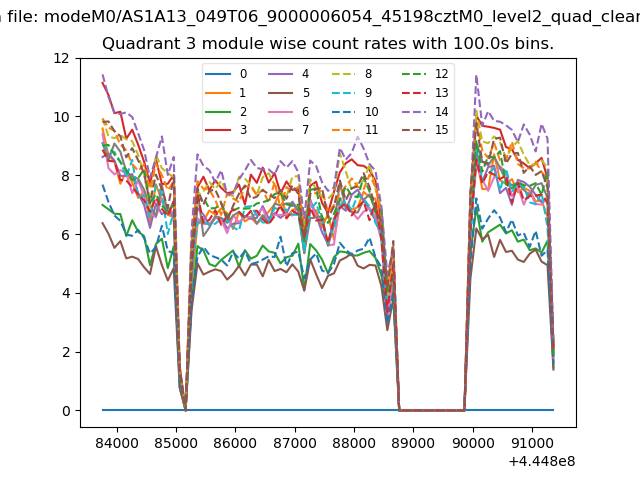 |
 |
| Parameter | Plot |
|---|---|
| CZT HV Monitor | 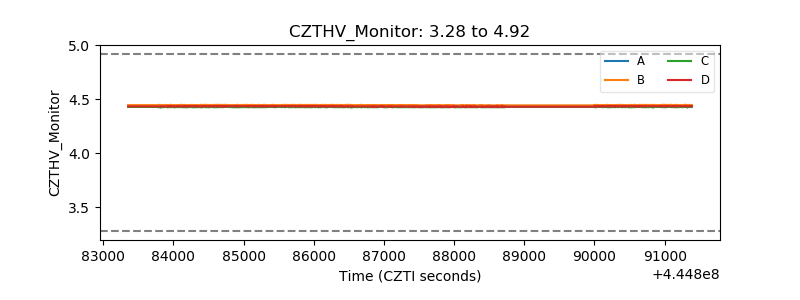 |
| D_VDD | 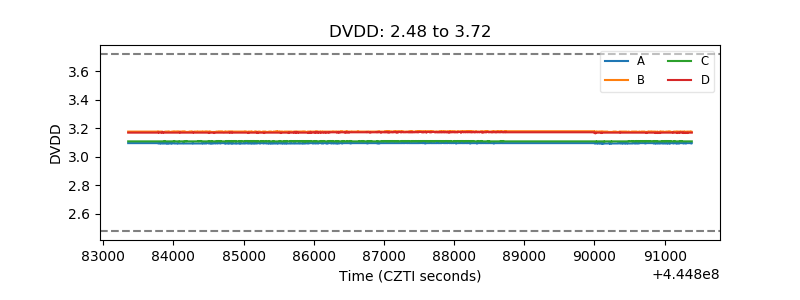 |
| Temperature 1 | 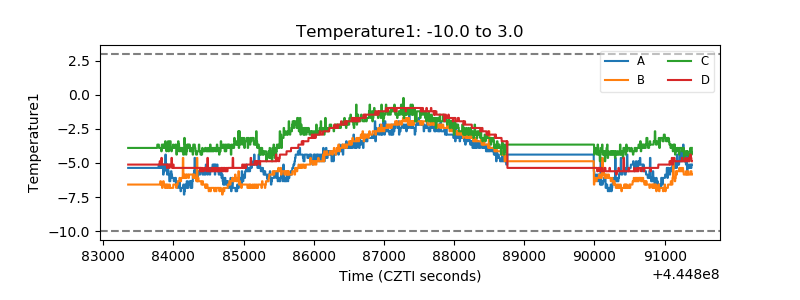 |
| Veto HV Monitor | 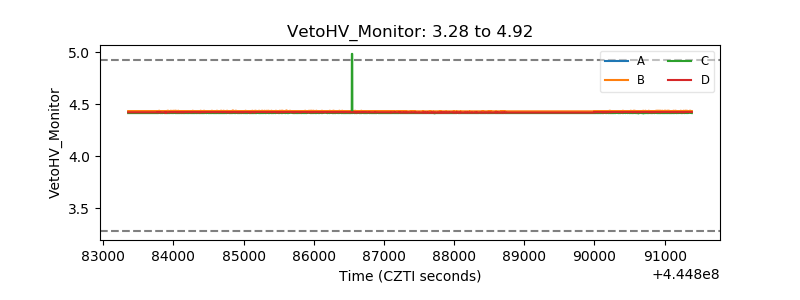 |
| Veto LLD | 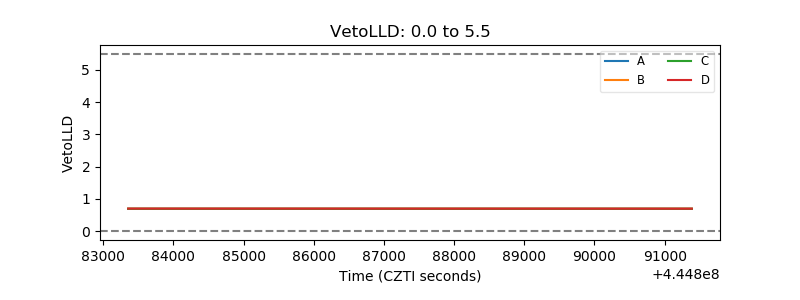 |
| Alpha Counter | 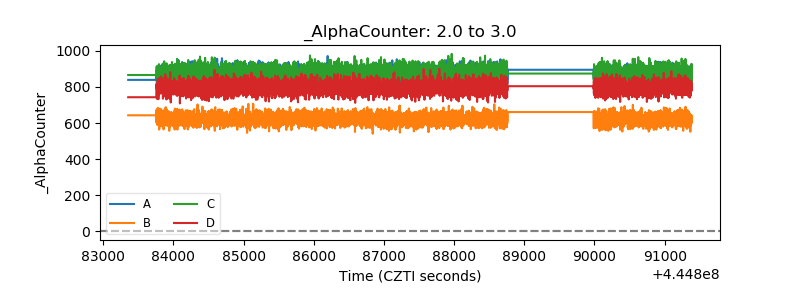 |
| _CPM_Rate | 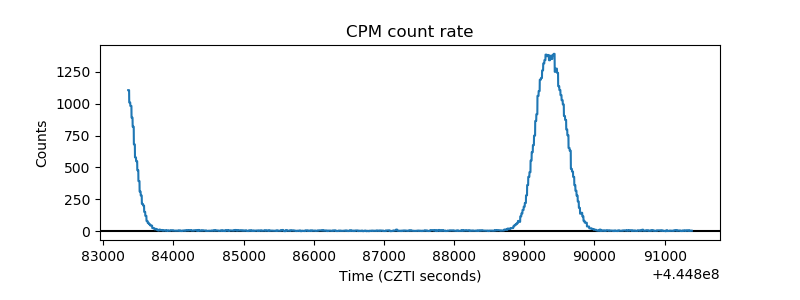 |
| CZT Counter | 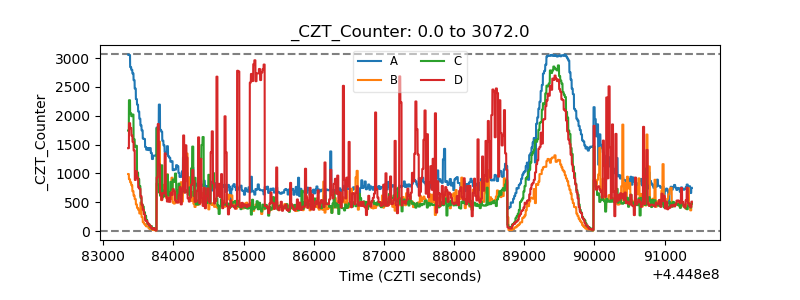 |
| +2.5 Volts monitor | 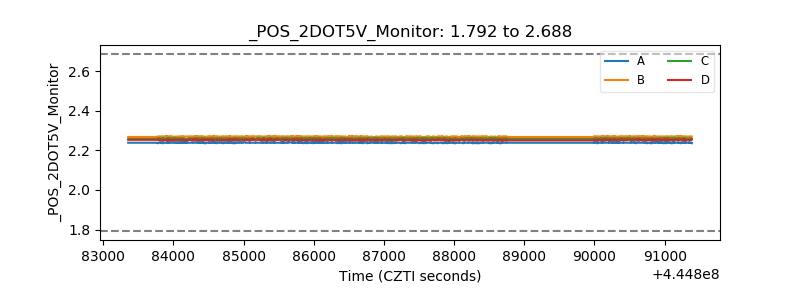 |
| +5 Volts monitor | 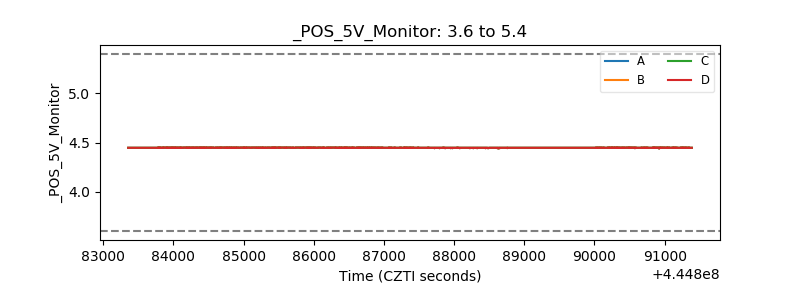 |
| _ROLL_ROT | 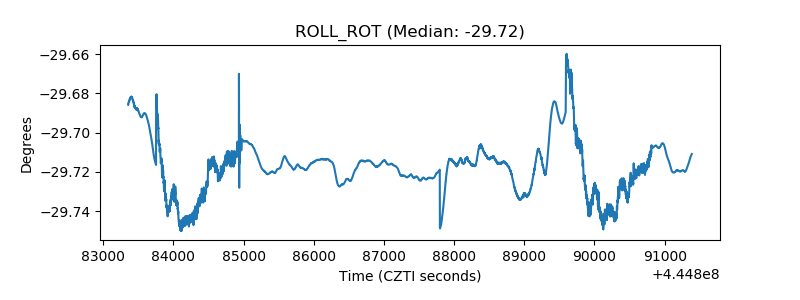 |
| _Roll_DEC | 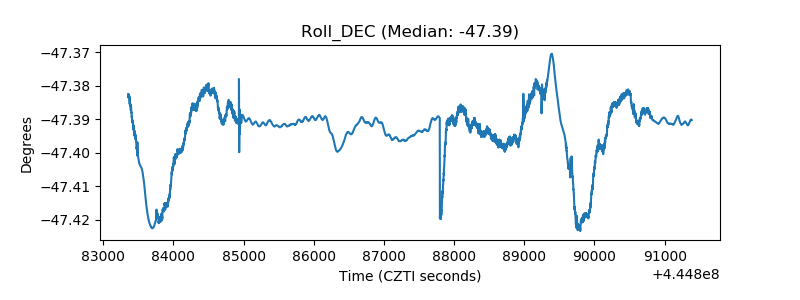 |
| _Roll_RA | 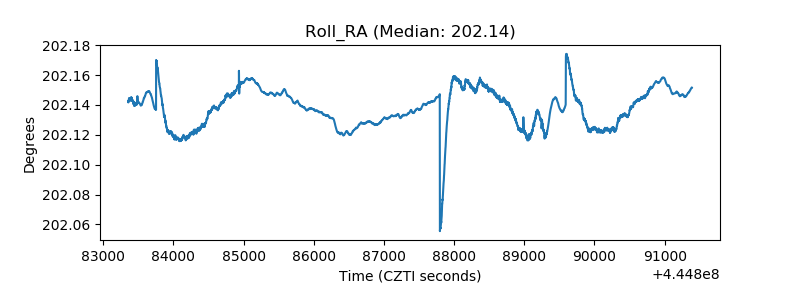 |
| Veto Counter | 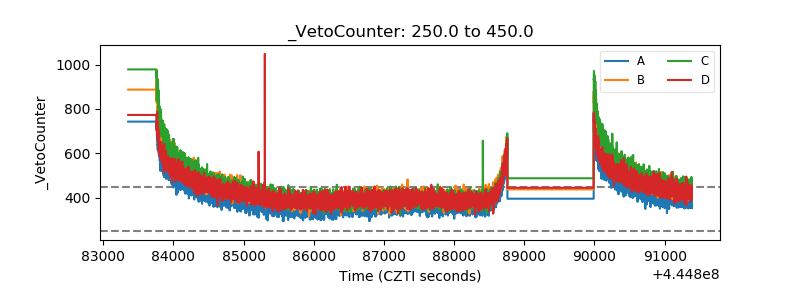 |