| Param | Original file | Final file |
|---|---|---|
| Filename | modeM0/AS1A13_049T06_9000006054_45200cztM0_level2.fits | modeM0/AS1A13_049T06_9000006054_45200cztM0_level2_quad_clean.evt |
| Size (bytes) | 224,821,440 | 47,162,880 |
| Size | 214.4 MB | 45.0 MB |
| Events in quadrant A | 2,388,319 | 309,748 |
| Events in quadrant B | 1,723,977 | 330,129 |
| Events in quadrant C | 1,880,530 | 311,382 |
| Events in quadrant D | 2,112,610 | 278,909 |
| Mode M0 | |||
|---|---|---|---|
| Quadrant | BADHDUFLAG | Total packets | Discarded packets |
| A | 0 | 9053 | 45 |
| B | 0 | 6944 | 37 |
| C | 0 | 7470 | 42 |
| D | 0 | 8114 | 31 |
| Mode M9 | |||
|---|---|---|---|
| Quadrant | BADHDUFLAG | Total packets | Discarded packets |
| A | 0 | 11 | 0 |
| B | 0 | 11 | 0 |
| C | 0 | 11 | 0 |
| D | 0 | 11 | 0 |
| Mode SS | |||
|---|---|---|---|
| Quadrant | BADHDUFLAG | Total packets | Discarded packets |
| A | 0 | 58 | 0 |
| B | 0 | 58 | 0 |
| C | 0 | 58 | 0 |
| D | 0 | 58 | 0 |
| Quadrant | Total seconds | Saturated seconds | Saturation percentage |
|---|---|---|---|
| A | 2770 | 156 | 5.631769% |
| B | 2764 | 84 | 3.039074% |
| C | 2765 | 137 | 4.954792% |
| D | 2770 | 182 | 6.570397% |
Noise dominated data is calculated using 1-second bins in cleaned event files. If a bin has >2000 counts, and if more than 50% of those come from <1% of pixels, then it is considered to be noise-dominated and hence unusable.
| Quadrant | # 1 sec bins | Bins with >0 counts | Bins with >2000 counts | High rate bins dominated by noise | Noise dominated (total time) | Noise dominated (detector-on time) | Marked lightcurve |
|---|---|---|---|---|---|---|---|
| A | 3842 | 2774 | 4 | 4 | 0.10% | 0.14% | 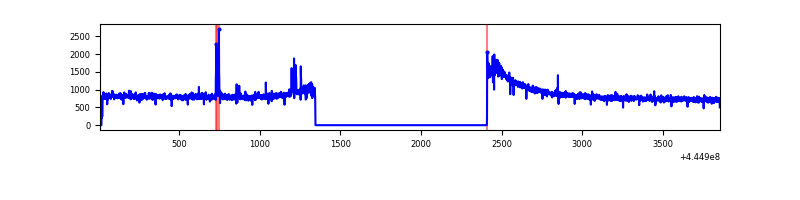 |
| B | 3846 | 2772 | 6 | 6 | 0.16% | 0.22% | 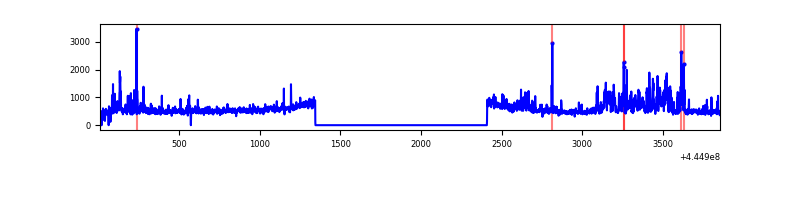 |
| C | 3839 | 2772 | 67 | 67 | 1.75% | 2.42% | 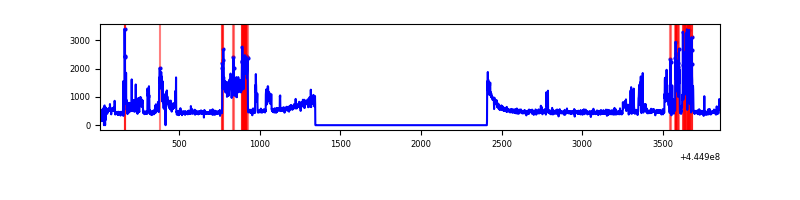 |
| D | 3840 | 2774 | 94 | 94 | 2.45% | 3.39% | 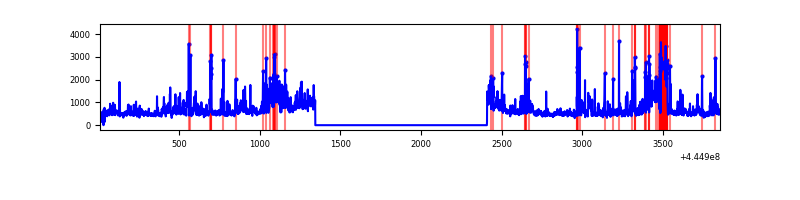 |
Top three noisy pixels from each quadrant. If the there are fewer than three noisy pixels in the level2.evt file, extra rows are filled as -1
| Pixel properties | Quadrant properties | ||||||
|---|---|---|---|---|---|---|---|
| Quadrant | DetID | PixID | Counts | Sigma | Mean | Median | Sigma |
| A | 10 | 83 | 1064179 | 15009.99 | 334 | 326 | 70.9 |
| A | 15 | 174 | 15224 | 210.2 | 334 | 326 | 70.9 |
| A | 4 | 0 | 10534 | 144.03 | 334 | 326 | 70.9 |
| B | 4 | 170 | 203145 | 2981.07 | 339 | 328 | 68.0 |
| B | 3 | 112 | 88358 | 1293.89 | 339 | 328 | 68.0 |
| B | 0 | 183 | 40489 | 590.3 | 339 | 328 | 68.0 |
| C | 3 | 233 | 336165 | 4154.33 | 336 | 337 | 80.8 |
| C | 12 | 2 | 228582 | 2823.49 | 336 | 337 | 80.8 |
| C | 1 | 3 | 3945 | 44.63 | 336 | 337 | 80.8 |
| D | 1 | 52 | 185523 | 2207.0 | 330 | 319 | 83.9 |
| D | 12 | 238 | 175965 | 2093.1 | 330 | 319 | 83.9 |
| D | 5 | 235 | 153437 | 1824.64 | 330 | 319 | 83.9 |
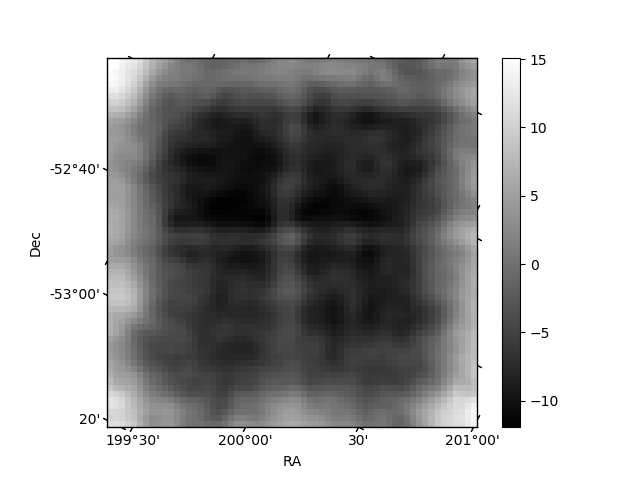
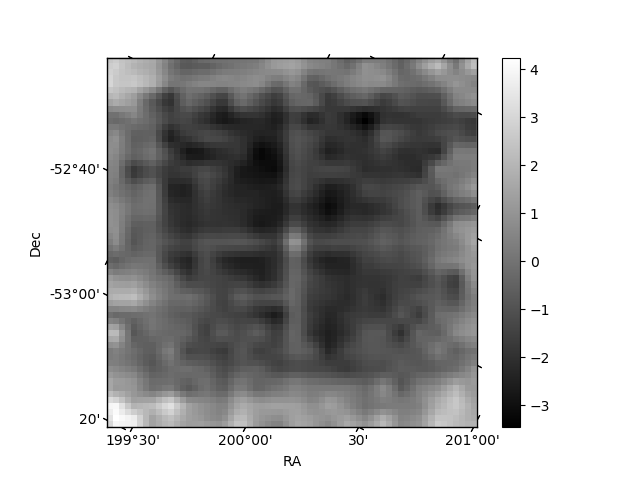
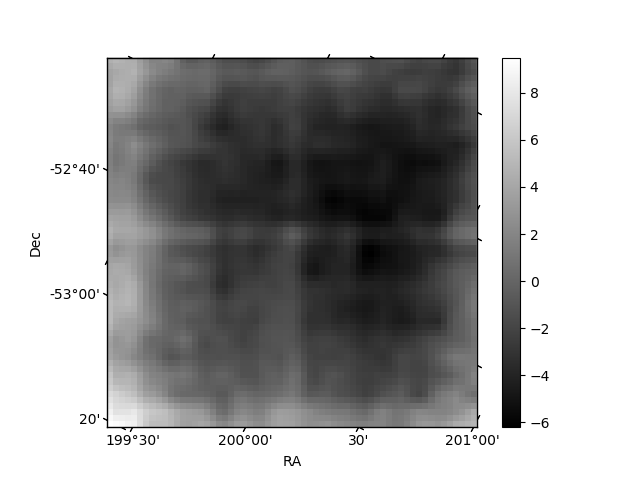
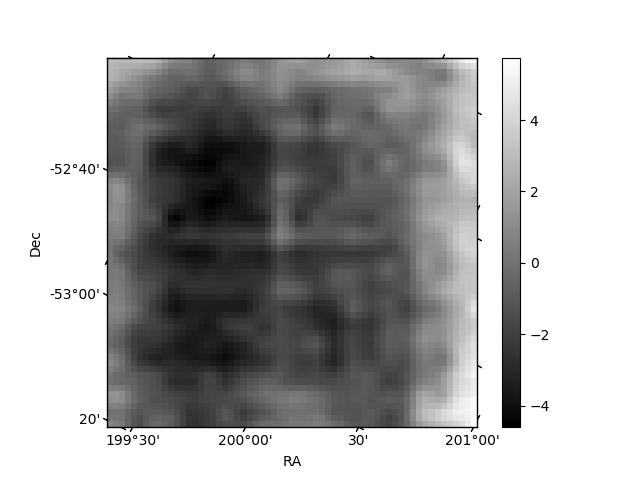
Histogram calculated using DETX and DETY for each event in the final _common_clean file
| Quadrant A | 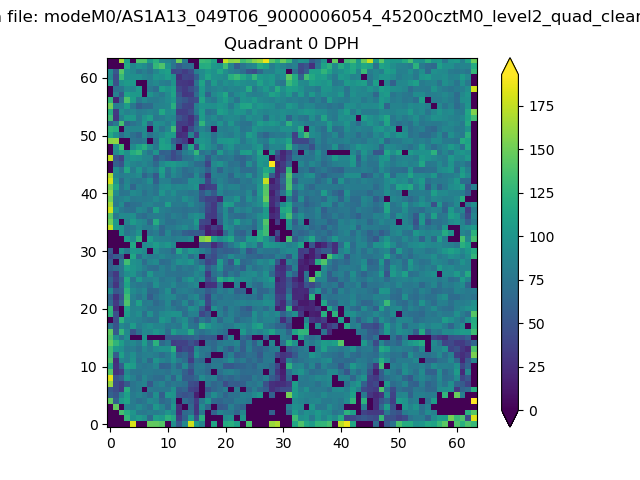 |
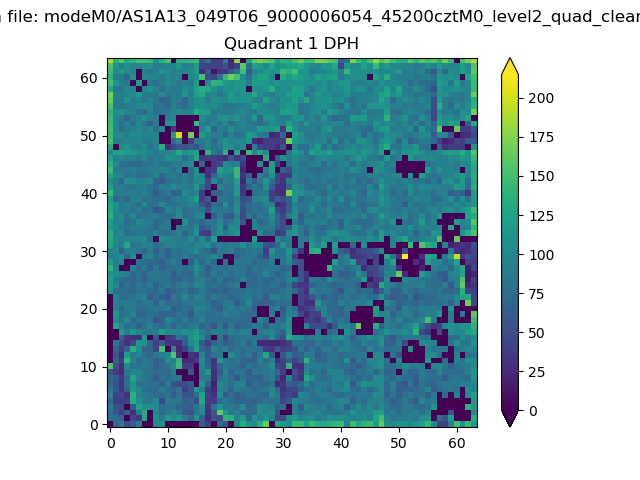 |
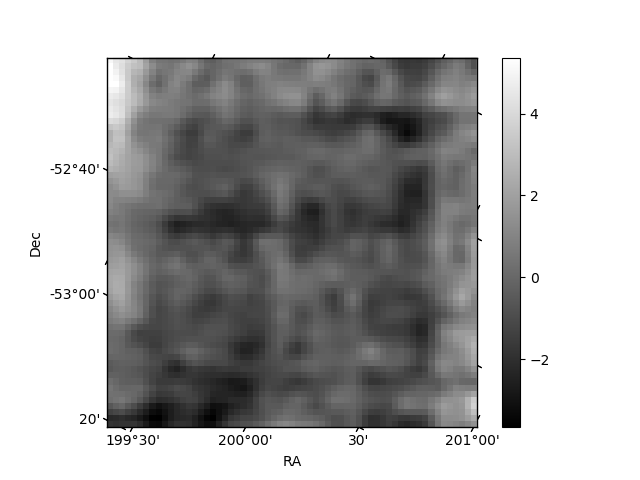
Quadrant B |
|---|---|---|---|
| Quadrant D | 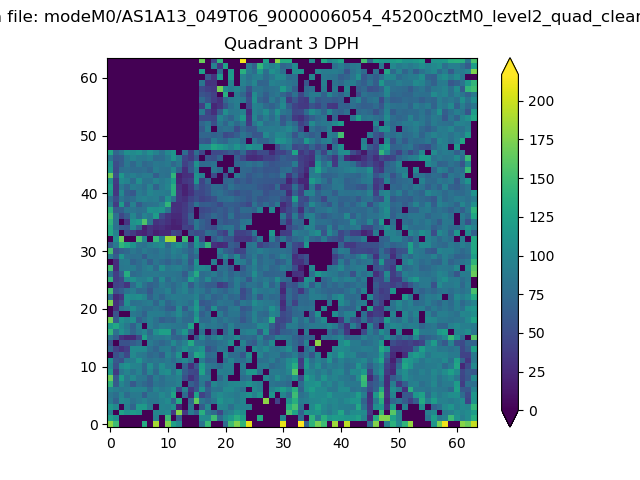 |
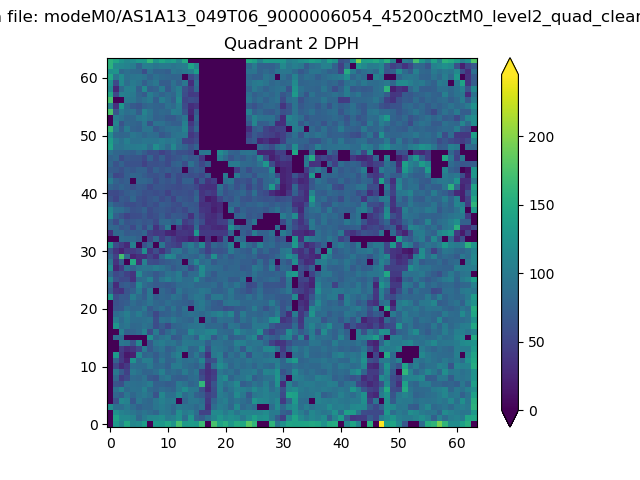 |
Quadrant C |
| Plot type | Count rate plots | Images |
|---|---|---|
| Comparison with Poisson distribution Blue bars denote a histogram of data divided into 1 sec bins. Red curve is a Poisson curve with rate = median count rate of data. |
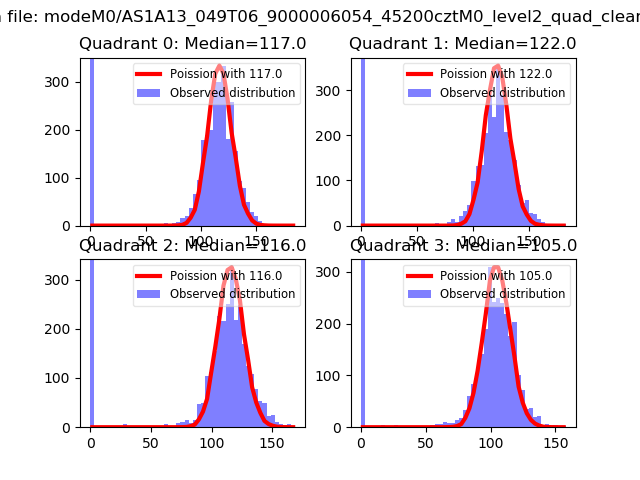 |
 |
| Quadrant-wise count rates Data is divided into 100 sec bins |
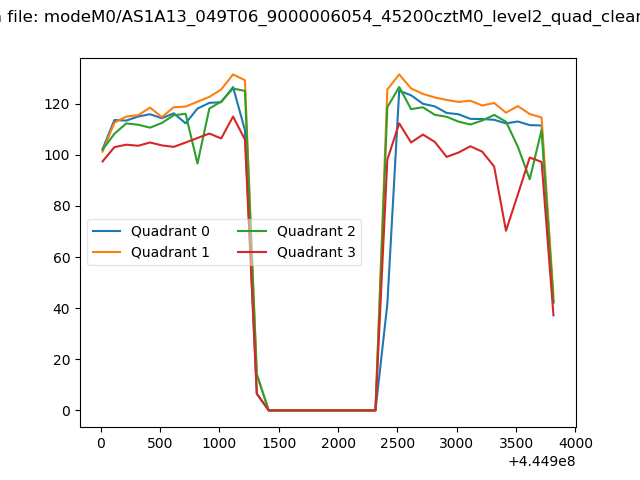 |
|
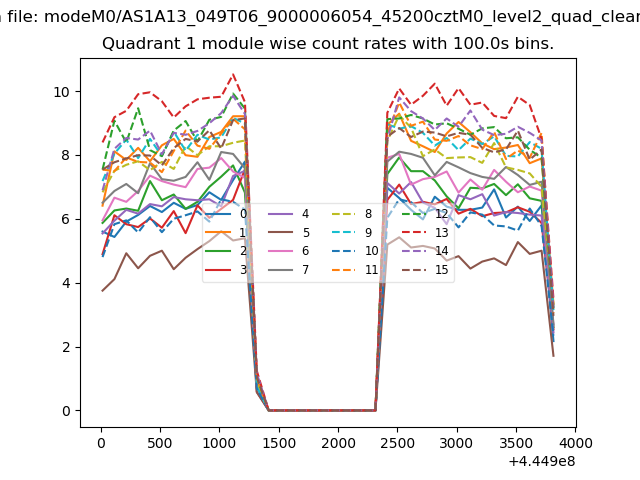
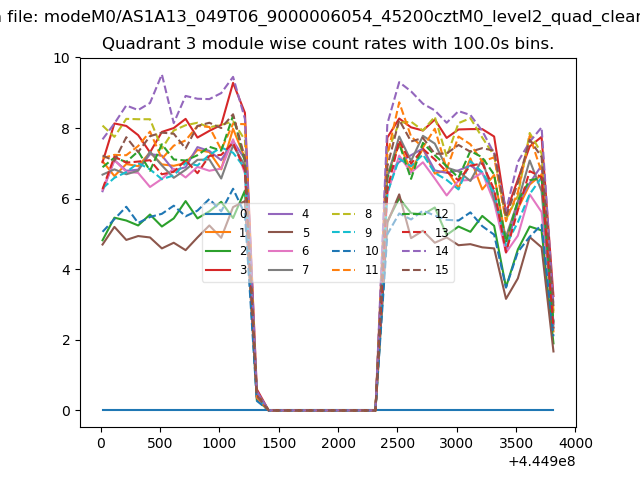
| Module-wise count rates for Quadrant A Data is divided into 100 sec bins |
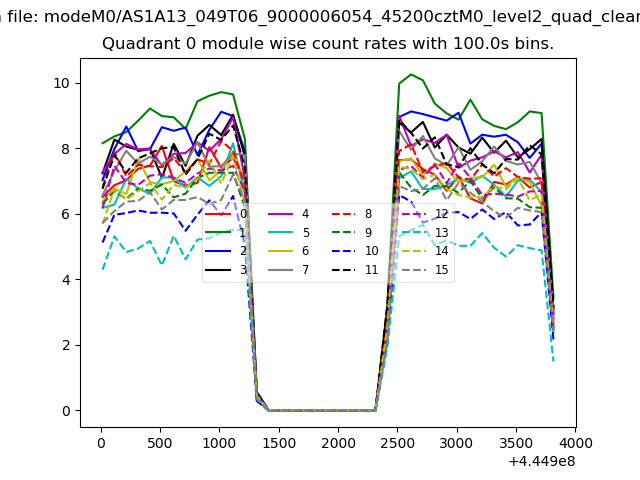 |
 |
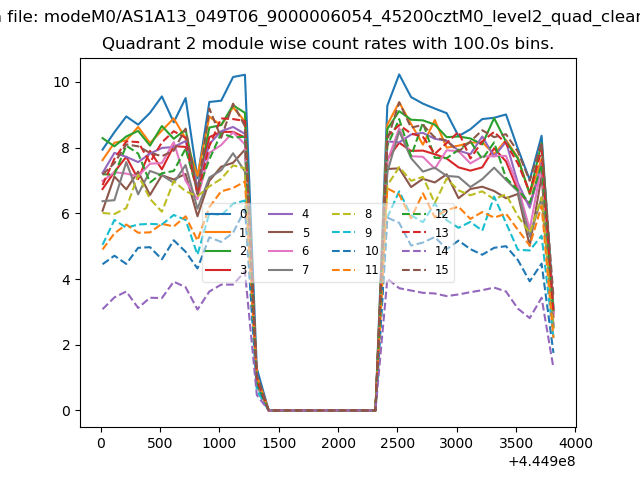
| Module-wise count rates for Quadrant B Data is divided into 100 sec bins |
 |
 |
| Module-wise count rates for Quadrant C Data is divided into 100 sec bins |
 |
 |
| Module-wise count rates for Quadrant D Data is divided into 100 sec bins |
 |
 |
| Parameter | Plot |
|---|---|
| CZT HV Monitor | 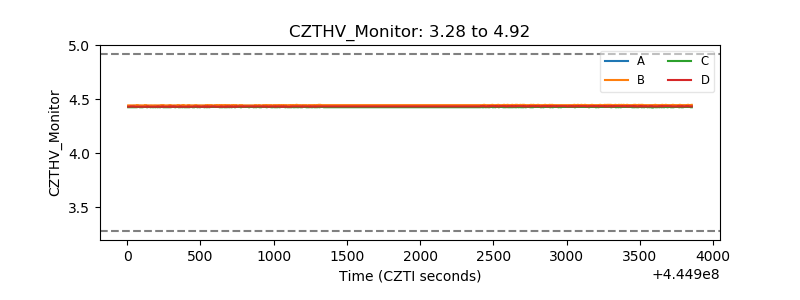 |
| D_VDD | 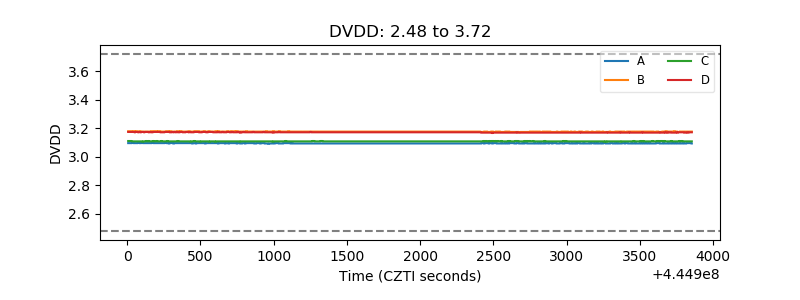 |
| Temperature 1 | 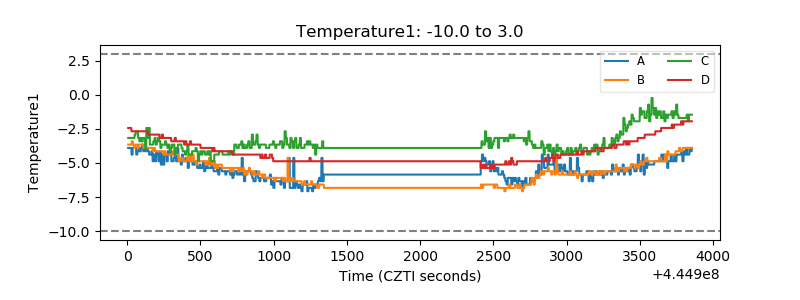 |
| Veto HV Monitor | 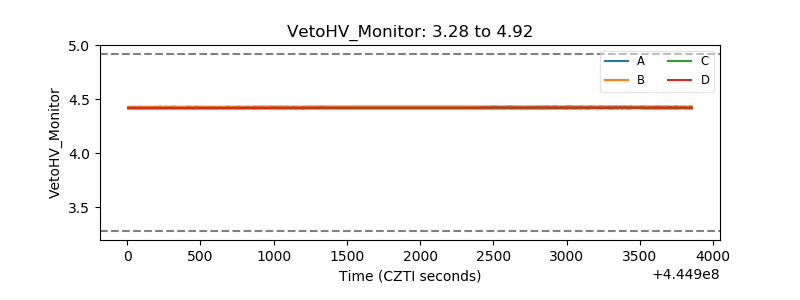 |
| Veto LLD | 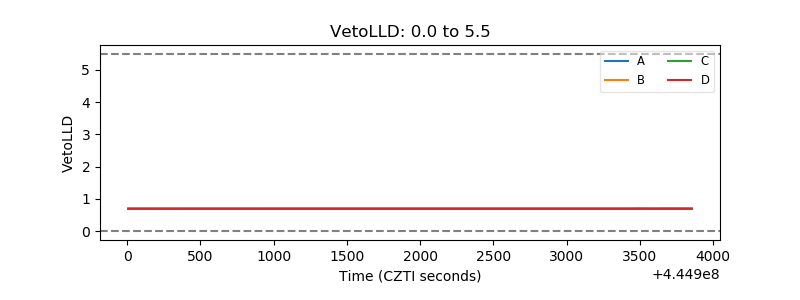 |
| Alpha Counter | 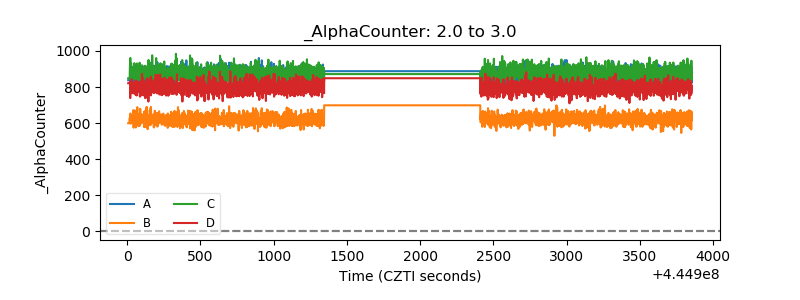 |
| _CPM_Rate | 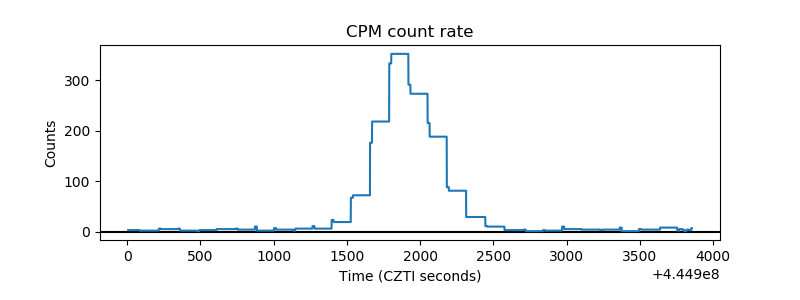 |
| CZT Counter | 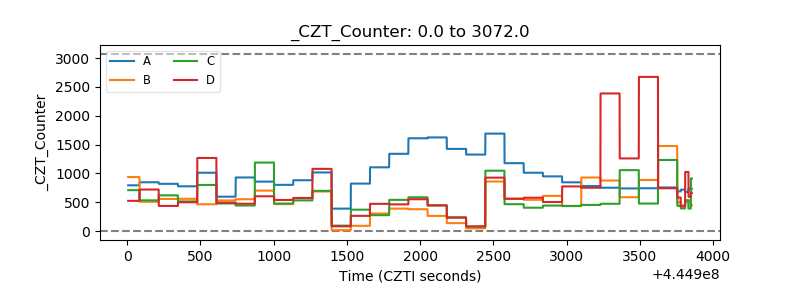 |
| +2.5 Volts monitor | 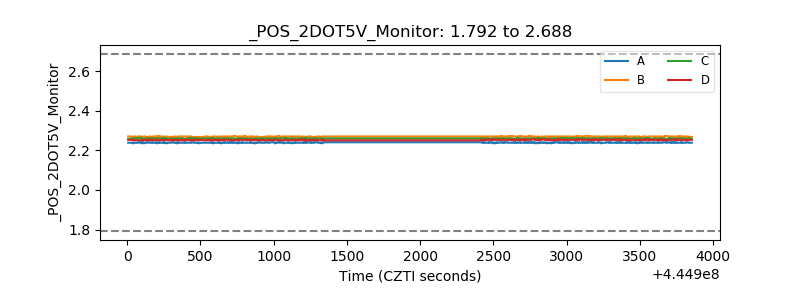 |
| +5 Volts monitor | 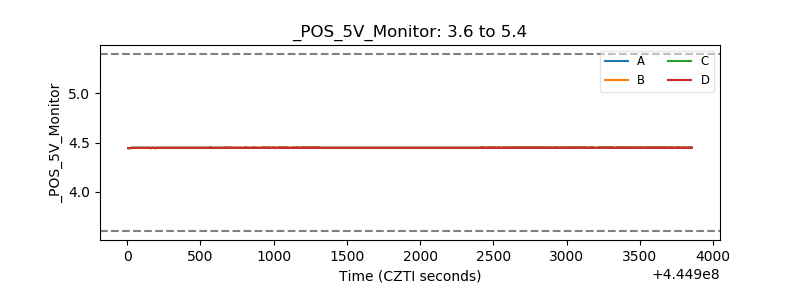 |
| _ROLL_ROT | 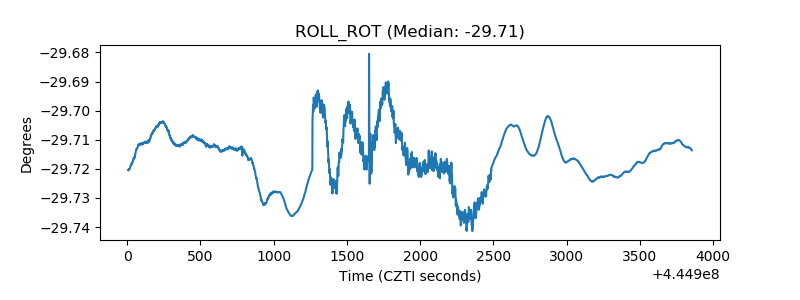 |
| _Roll_DEC | 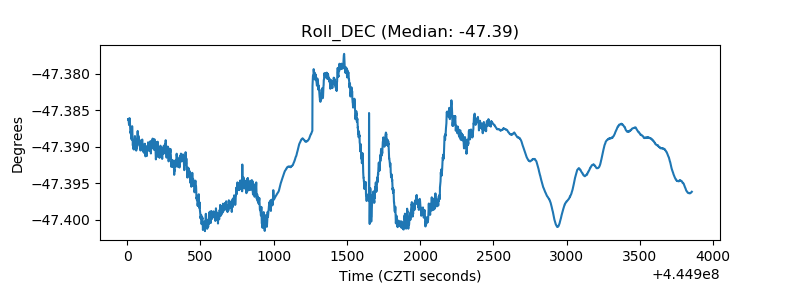 |
| _Roll_RA | 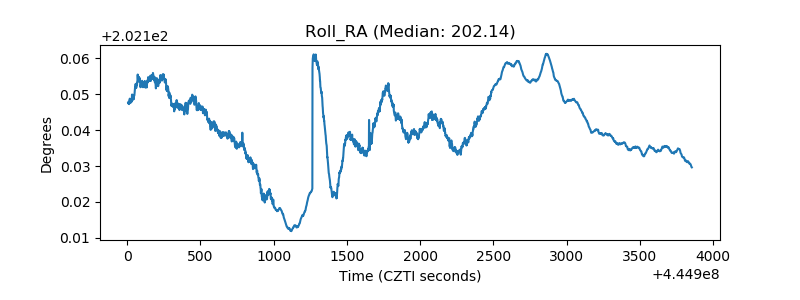 |
| Veto Counter | 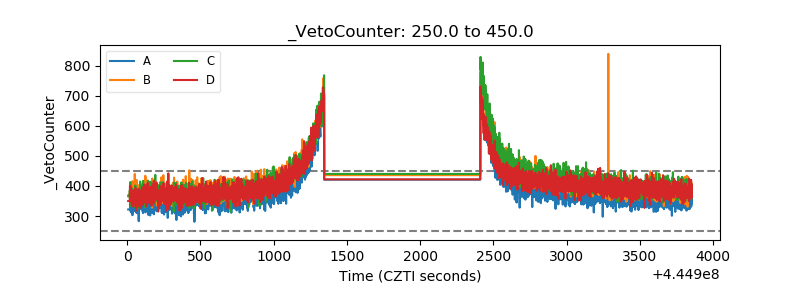 |