| Param | Original file | Final file |
|---|---|---|
| Filename | modeM0/AS1A13_049T06_9000006054_45201cztM0_level2.fits | modeM0/AS1A13_049T06_9000006054_45201cztM0_level2_quad_clean.evt |
| Size (bytes) | 629,340,480 | 107,311,680 |
| Size | 600.2 MB | 102.3 MB |
| Events in quadrant A | 5,606,249 | 740,165 |
| Events in quadrant B | 4,700,051 | 754,153 |
| Events in quadrant C | 3,852,575 | 746,832 |
| Events in quadrant D | 8,604,049 | 528,927 |
| Mode M0 | |||
|---|---|---|---|
| Quadrant | BADHDUFLAG | Total packets | Discarded packets |
| A | 0 | 21635 | 1 |
| B | 0 | 18534 | 1 |
| C | 0 | 16178 | 1 |
| D | 0 | 30258 | 2 |
| Mode M9 | |||
|---|---|---|---|
| Quadrant | BADHDUFLAG | Total packets | Discarded packets |
| A | 0 | 8 | 0 |
| B | 0 | 8 | 0 |
| C | 0 | 8 | 0 |
| D | 0 | 8 | 0 |
| Mode SS | |||
|---|---|---|---|
| Quadrant | BADHDUFLAG | Total packets | Discarded packets |
| A | 0 | 138 | 0 |
| B | 0 | 138 | 0 |
| C | 0 | 138 | 0 |
| D | 0 | 138 | 0 |
| Quadrant | Total seconds | Saturated seconds | Saturation percentage |
|---|---|---|---|
| A | 6882 | 237 | 3.443766% |
| B | 6882 | 407 | 5.913978% |
| C | 6883 | 190 | 2.760424% |
| D | 6882 | 1832 | 26.620169% |
Noise dominated data is calculated using 1-second bins in cleaned event files. If a bin has >2000 counts, and if more than 50% of those come from <1% of pixels, then it is considered to be noise-dominated and hence unusable.
| Quadrant | # 1 sec bins | Bins with >0 counts | Bins with >2000 counts | High rate bins dominated by noise | Noise dominated (total time) | Noise dominated (detector-on time) | Marked lightcurve |
|---|---|---|---|---|---|---|---|
| A | 7677 | 6883 | 9 | 9 | 0.12% | 0.13% | 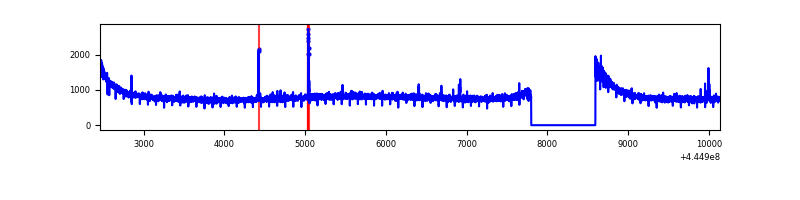 |
| B | 7677 | 6882 | 163 | 163 | 2.12% | 2.37% | 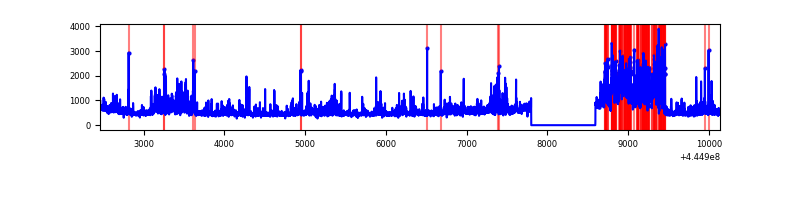 |
| C | 7678 | 6883 | 81 | 81 | 1.05% | 1.18% | 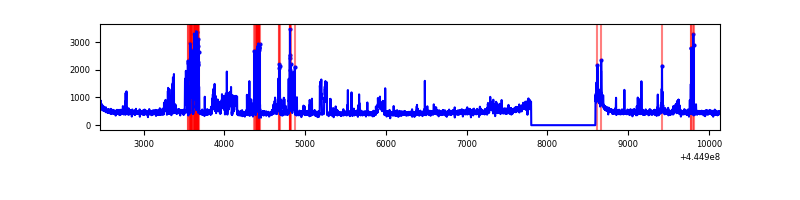 |
| D | 7676 | 6882 | 1689 | 1689 | 22.00% | 24.54% | 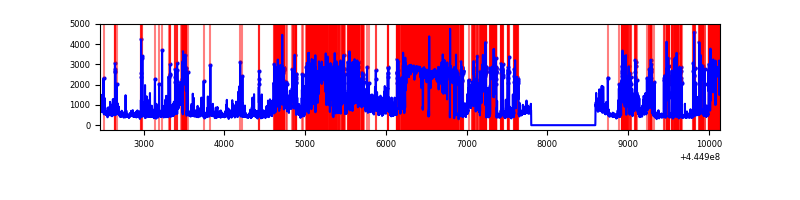 |
Top three noisy pixels from each quadrant. If the there are fewer than three noisy pixels in the level2.evt file, extra rows are filled as -1
| Pixel properties | Quadrant properties | ||||||
|---|---|---|---|---|---|---|---|
| Quadrant | DetID | PixID | Counts | Sigma | Mean | Median | Sigma |
| A | 10 | 83 | 2537071 | 15575.5 | 781 | 763 | 162.8 |
| A | 10 | 248 | 17535 | 103.0 | 781 | 763 | 162.8 |
| A | 2 | 79 | 15393 | 89.84 | 781 | 763 | 162.8 |
| B | 4 | 170 | 972479 | 6364.38 | 776 | 751 | 152.7 |
| B | 3 | 112 | 478929 | 3131.85 | 776 | 751 | 152.7 |
| B | 0 | 183 | 50296 | 324.5 | 776 | 751 | 152.7 |
| C | 12 | 2 | 512428 | 2805.0 | 780 | 784 | 182.4 |
| C | 3 | 233 | 231188 | 1263.15 | 780 | 784 | 182.4 |
| C | 2 | 14 | 40319 | 216.74 | 780 | 784 | 182.4 |
| D | 12 | 238 | 4275781 | 25009.22 | 675 | 653 | 170.9 |
| D | 13 | 249 | 635263 | 3712.43 | 675 | 653 | 170.9 |
| D | 1 | 52 | 381335 | 2226.97 | 675 | 653 | 170.9 |
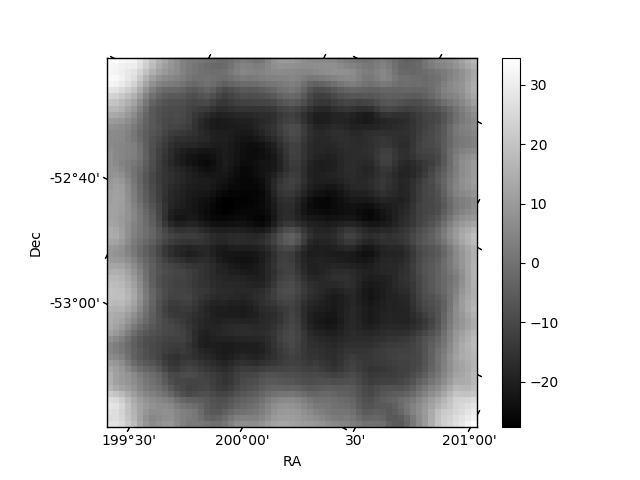
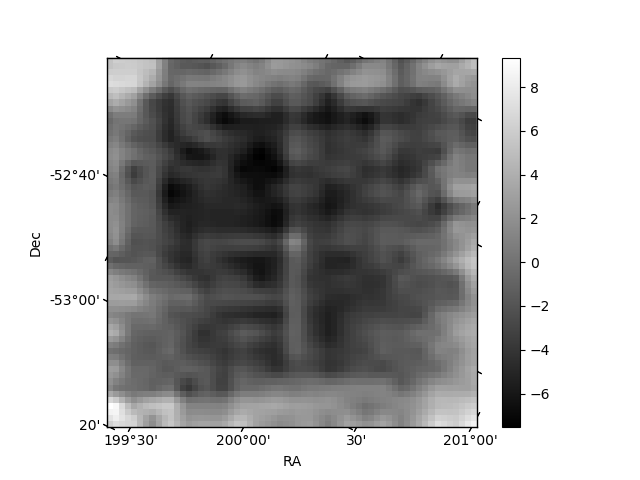
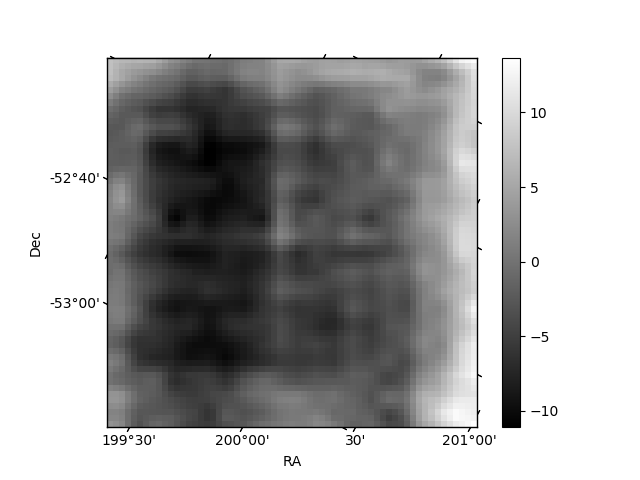
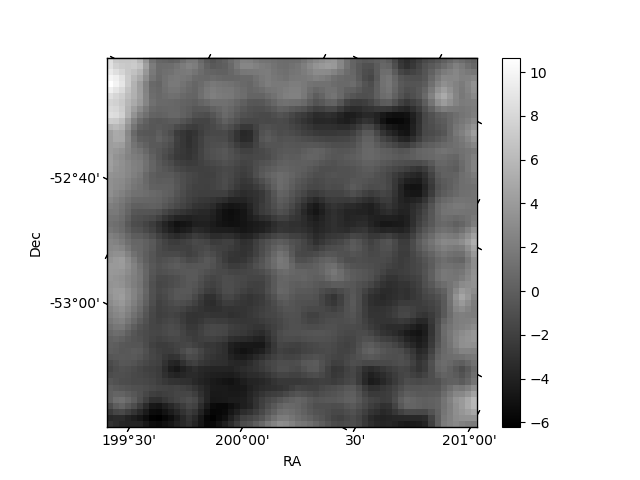
Histogram calculated using DETX and DETY for each event in the final _common_clean file
| Quadrant A | 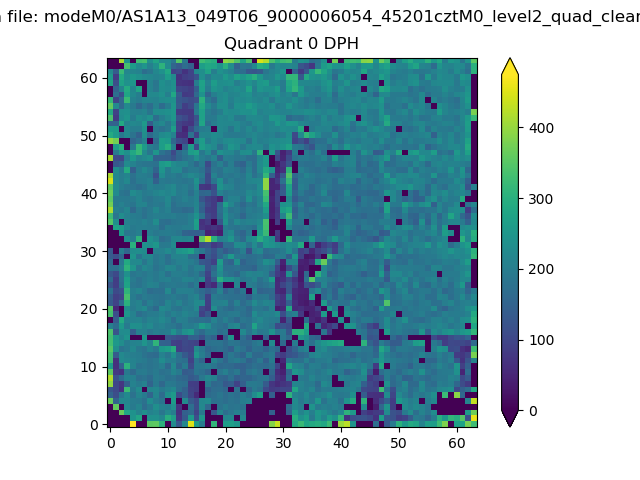 |
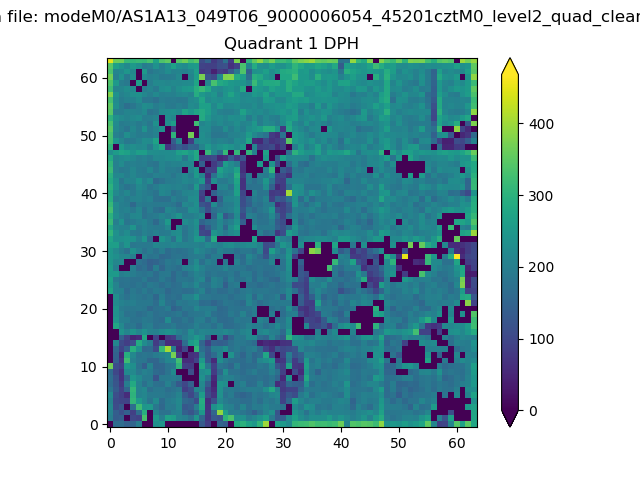 |
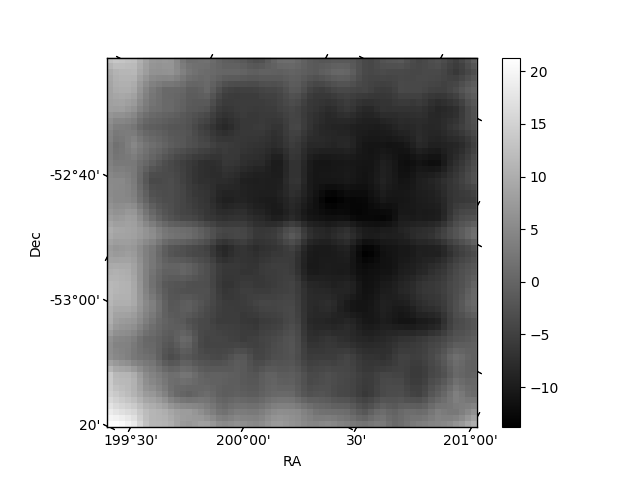
Quadrant B |
|---|---|---|---|
| Quadrant D | 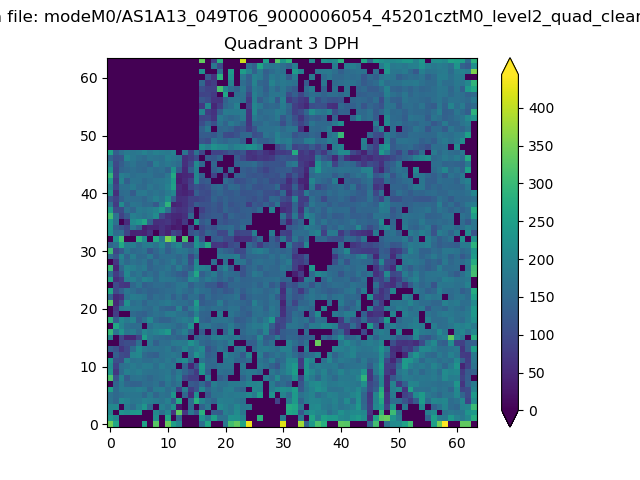 |
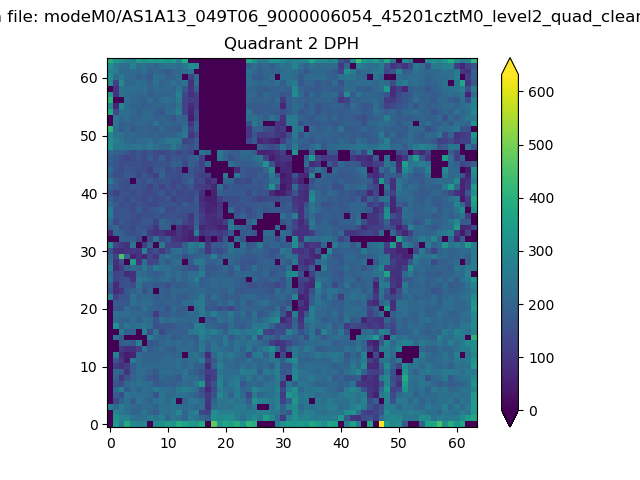 |
Quadrant C |
| Plot type | Count rate plots | Images |
|---|---|---|
| Comparison with Poisson distribution Blue bars denote a histogram of data divided into 1 sec bins. Red curve is a Poisson curve with rate = median count rate of data. |
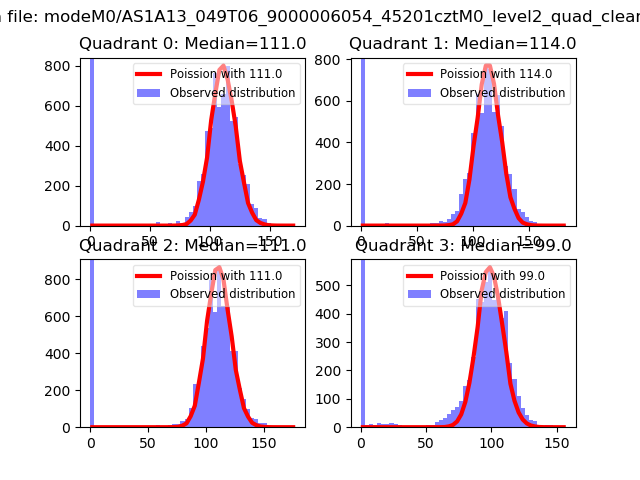 |
 |
| Quadrant-wise count rates Data is divided into 100 sec bins |
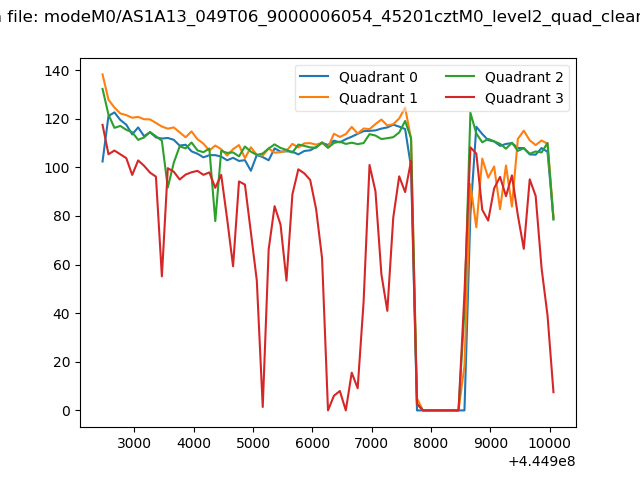 |
|
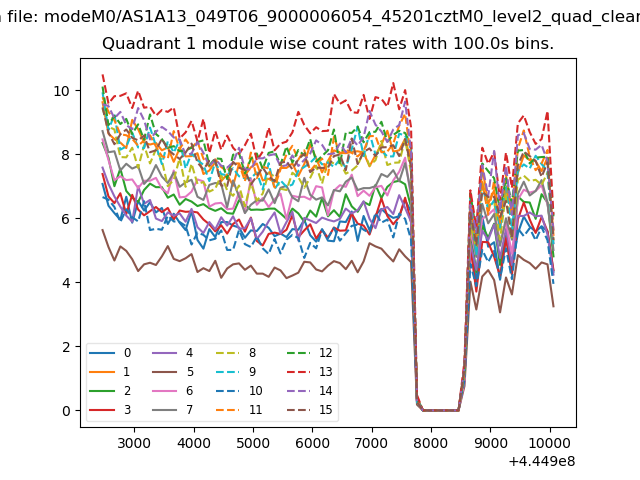
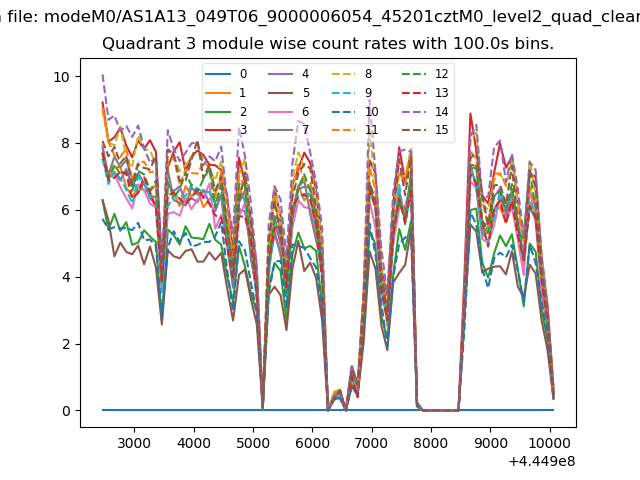
| Module-wise count rates for Quadrant A Data is divided into 100 sec bins |
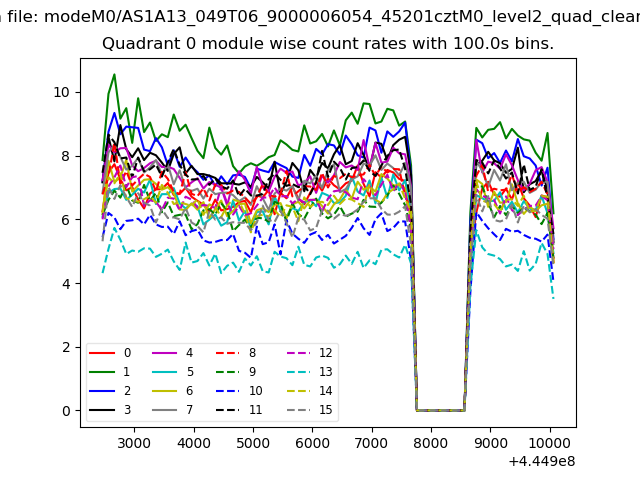 |
 |
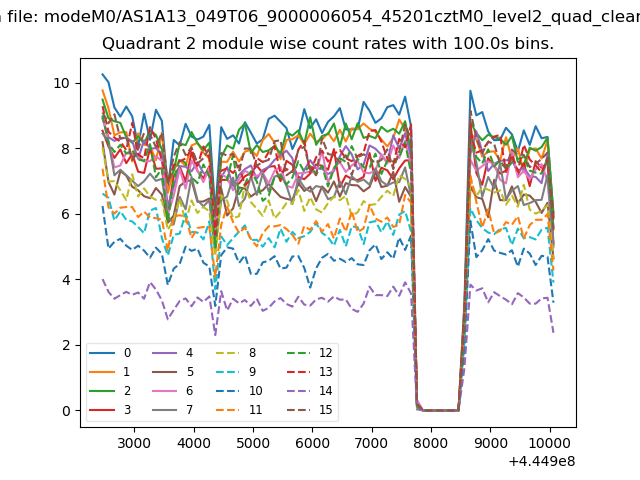
| Module-wise count rates for Quadrant B Data is divided into 100 sec bins |
 |
 |
| Module-wise count rates for Quadrant C Data is divided into 100 sec bins |
 |
 |
| Module-wise count rates for Quadrant D Data is divided into 100 sec bins |
 |
 |
| Parameter | Plot |
|---|---|
| CZT HV Monitor |  |
| D_VDD | 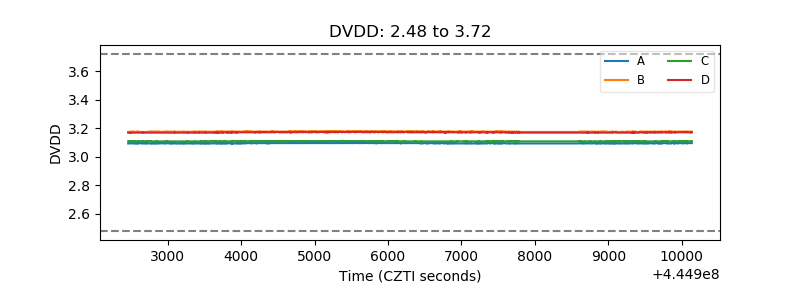 |
| Temperature 1 | 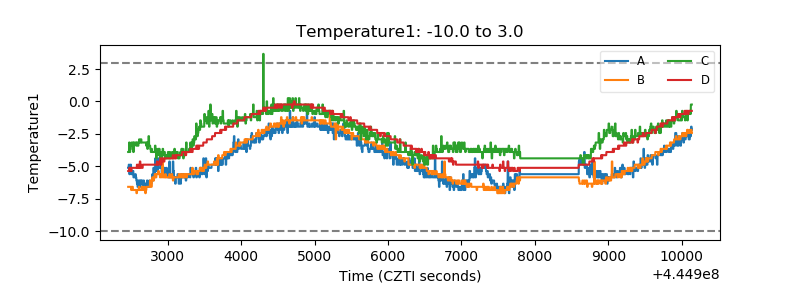 |
| Veto HV Monitor | 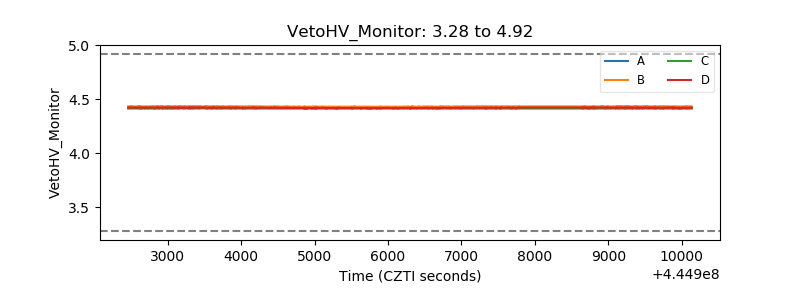 |
| Veto LLD | 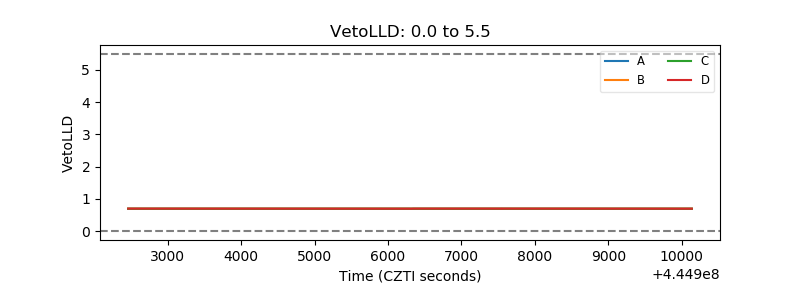 |
| Alpha Counter | 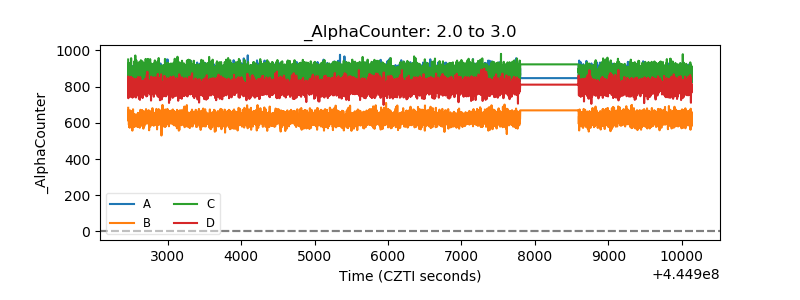 |
| _CPM_Rate | 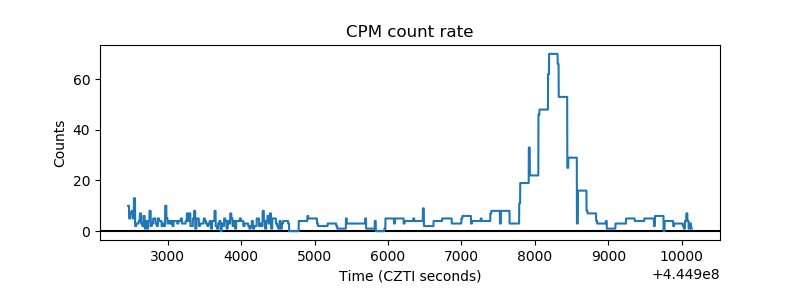 |
| CZT Counter | 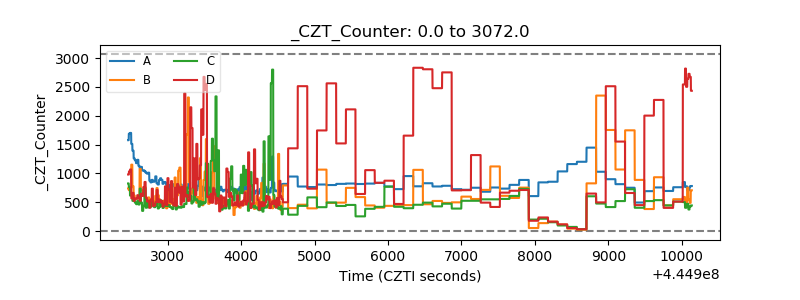 |
| +2.5 Volts monitor | 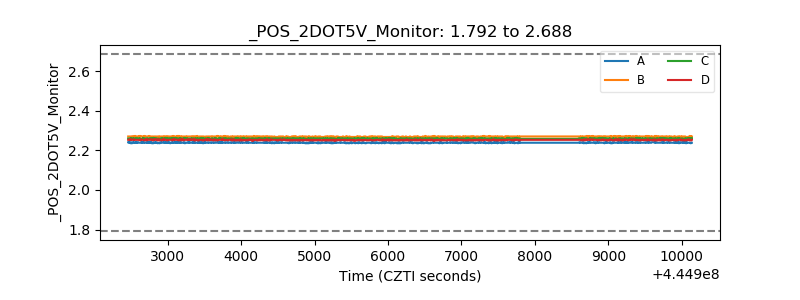 |
| +5 Volts monitor | 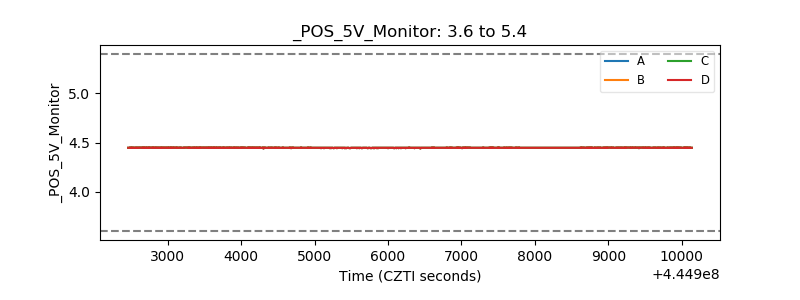 |
| _ROLL_ROT | 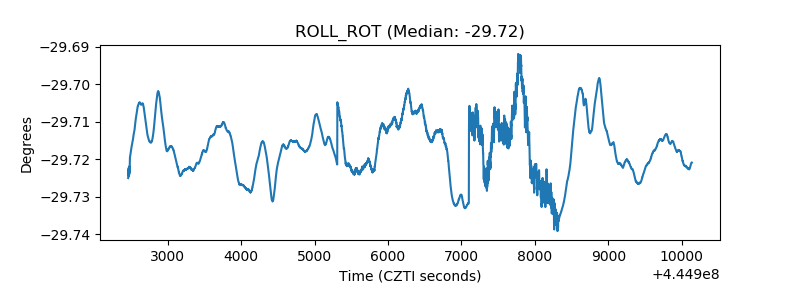 |
| _Roll_DEC | 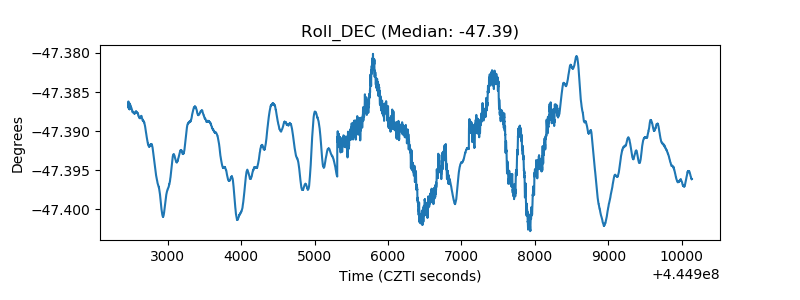 |
| _Roll_RA | 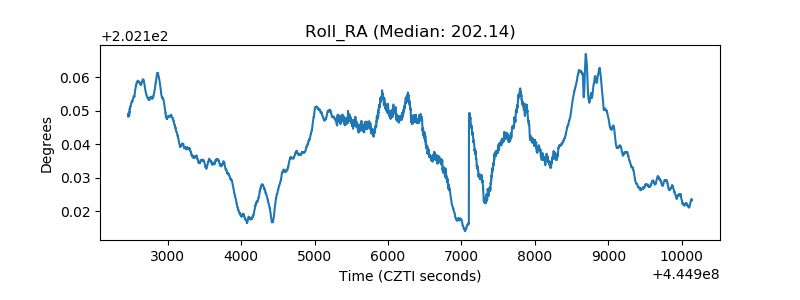 |
| Veto Counter | 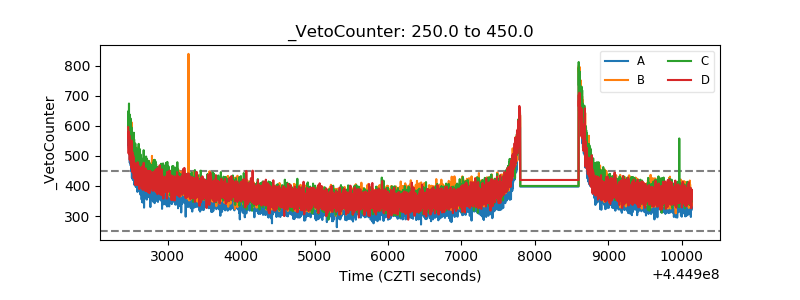 |