| Param | Original file | Final file |
|---|---|---|
| Filename | modeM0/AS1A13_049T06_9000006054_45202cztM0_level2.fits | modeM0/AS1A13_049T06_9000006054_45202cztM0_level2_quad_clean.evt |
| Size (bytes) | 424,880,640 | 87,497,280 |
| Size | 405.2 MB | 83.4 MB |
| Events in quadrant A | 5,784,306 | 754,818 |
| Events in quadrant B | 5,051,478 | 762,139 |
| Events in quadrant C | 4,453,046 | 738,968 |
| Events in quadrant D | 11,365 | 10 |
| Mode M0 | |||
|---|---|---|---|
| Quadrant | BADHDUFLAG | Total packets | Discarded packets |
| A | 0 | 22619 | 0 |
| B | 0 | 19820 | 9 |
| C | 0 | 18333 | 9 |
| D | 0 | 48 | 0 |
| Mode M9 | |||
|---|---|---|---|
| Quadrant | BADHDUFLAG | Total packets | Discarded packets |
| A | 0 | 3 | 0 |
| B | 0 | 3 | 0 |
| C | 0 | 3 | 0 |
| D | 0 | 3 | 0 |
| Mode SS | |||
|---|---|---|---|
| Quadrant | BADHDUFLAG | Total packets | Discarded packets |
| A | 0 | 150 | 0 |
| B | 0 | 150 | 0 |
| C | 0 | 150 | 0 |
| D | 0 | 150 | 0 |
| Quadrant | Total seconds | Saturated seconds | Saturation percentage |
|---|---|---|---|
| A | 7333 | 350 | 4.772944% |
| B | 7329 | 578 | 7.886478% |
| C | 7327 | 530 | 7.233520% |
| D | 24 | 0 | 0.000000% |
Noise dominated data is calculated using 1-second bins in cleaned event files. If a bin has >2000 counts, and if more than 50% of those come from <1% of pixels, then it is considered to be noise-dominated and hence unusable.
| Quadrant | # 1 sec bins | Bins with >0 counts | Bins with >2000 counts | High rate bins dominated by noise | Noise dominated (total time) | Noise dominated (detector-on time) | Marked lightcurve |
|---|---|---|---|---|---|---|---|
| A | 7568 | 7333 | 5 | 5 | 0.07% | 0.07% | 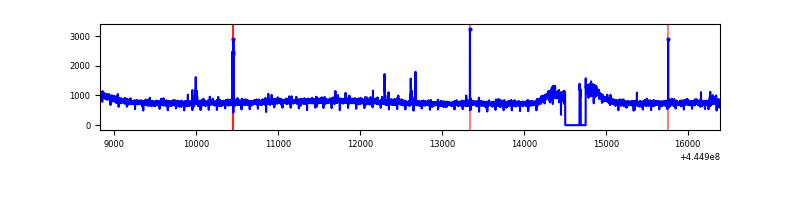 |
| B | 7568 | 7332 | 186 | 186 | 2.46% | 2.54% | 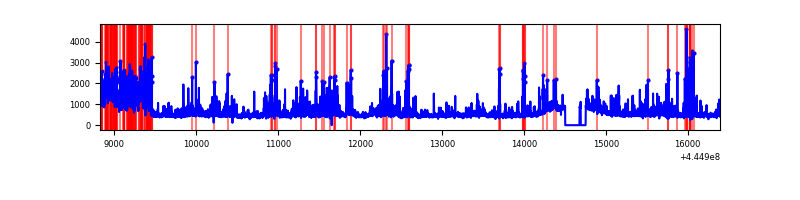 |
| C | 7569 | 7334 | 313 | 313 | 4.14% | 4.27% | 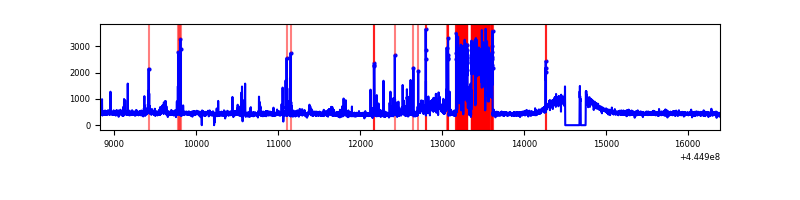 |
| D | 24 | 24 | 0 | 0 | 0.00% | 0.00% | 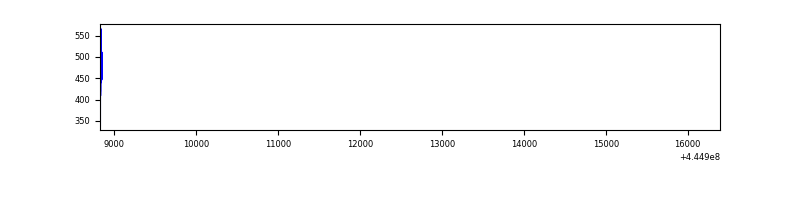 |
Top three noisy pixels from each quadrant. If the there are fewer than three noisy pixels in the level2.evt file, extra rows are filled as -1
| Pixel properties | Quadrant properties | ||||||
|---|---|---|---|---|---|---|---|
| Quadrant | DetID | PixID | Counts | Sigma | Mean | Median | Sigma |
| A | 10 | 83 | 2456700 | 13871.85 | 844 | 821 | 177.0 |
| A | 15 | 174 | 24612 | 134.38 | 844 | 821 | 177.0 |
| A | 0 | 243 | 13086 | 69.28 | 844 | 821 | 177.0 |
| B | 3 | 112 | 797613 | 4776.37 | 833 | 806 | 166.8 |
| B | 4 | 170 | 691548 | 4140.57 | 833 | 806 | 166.8 |
| B | 5 | 172 | 87731 | 521.06 | 833 | 806 | 166.8 |
| C | 12 | 2 | 1114365 | 5750.88 | 829 | 832 | 193.6 |
| C | 3 | 233 | 35007 | 176.5 | 829 | 832 | 193.6 |
| C | 15 | 208 | 27921 | 139.9 | 829 | 832 | 193.6 |
| D | 1 | 52 | 112 | 64.63 | 2 | 2 | 1.7 |
| D | 2 | 234 | 93 | 53.46 | 2 | 2 | 1.7 |
| D | 13 | 249 | 92 | 52.88 | 2 | 2 | 1.7 |
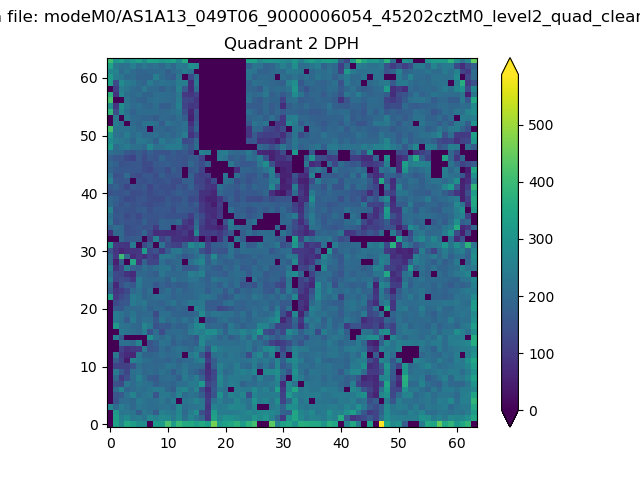
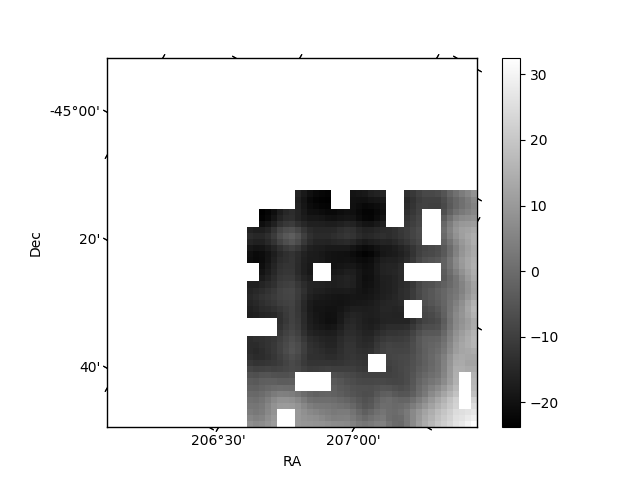
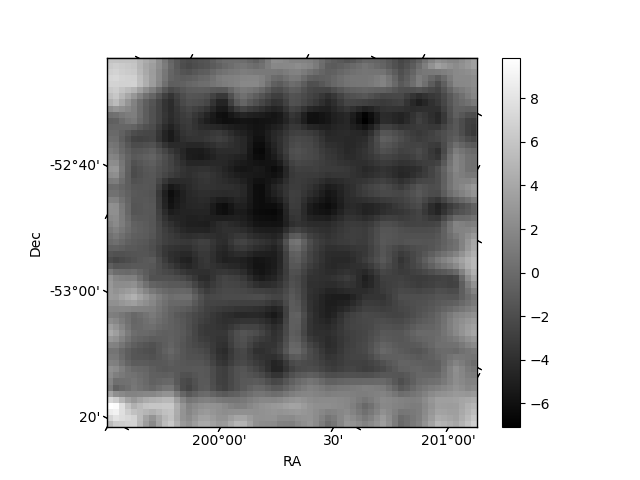
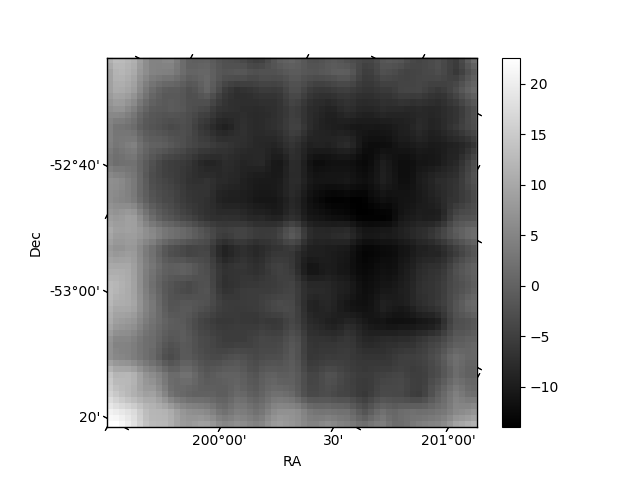
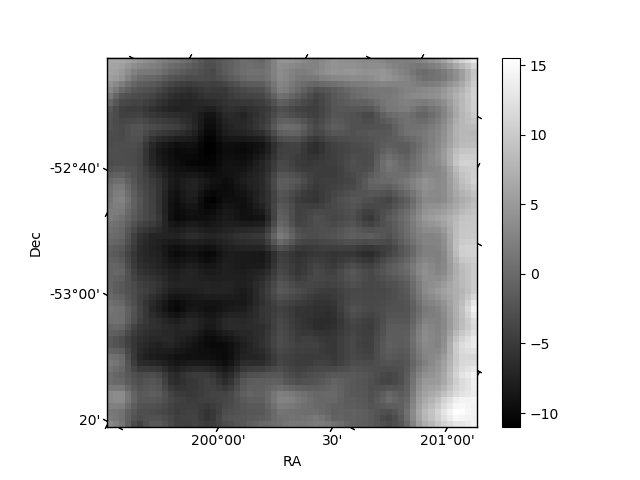
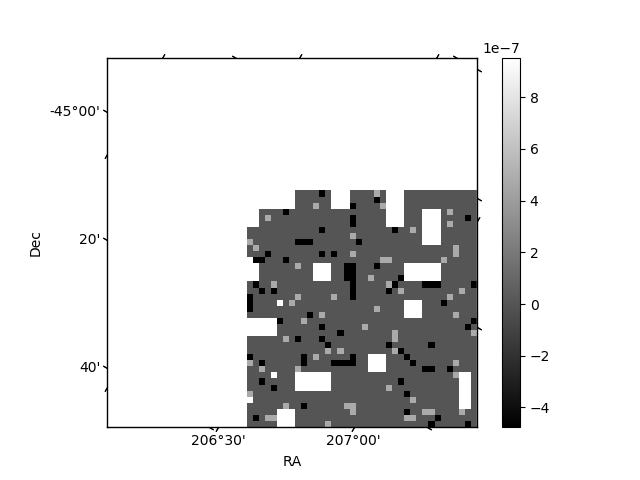
Histogram calculated using DETX and DETY for each event in the final _common_clean file
| Quadrant A | 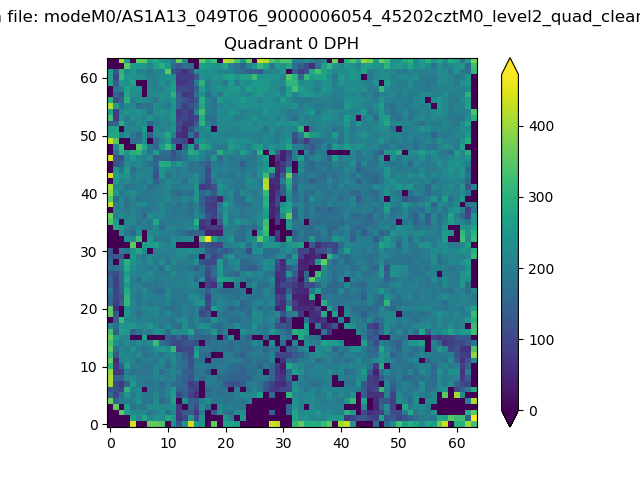 |
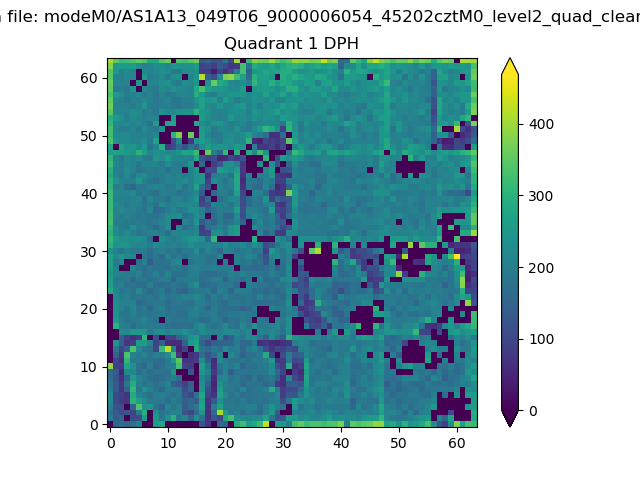 |
Quadrant B |
|---|---|---|---|
| Quadrant D | 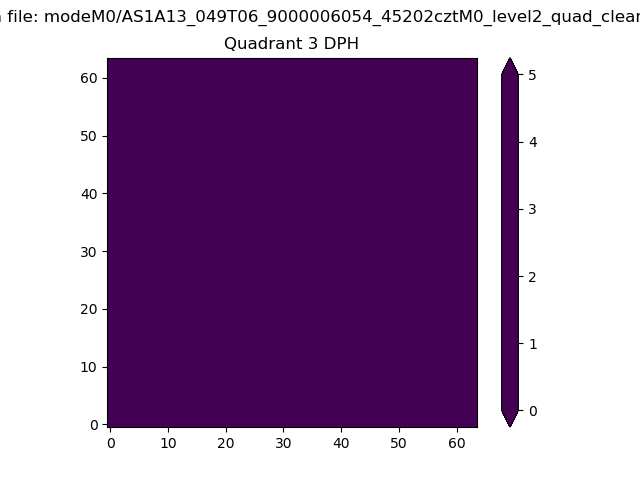 |
 |
Quadrant C |
| Plot type | Count rate plots | Images |
|---|---|---|
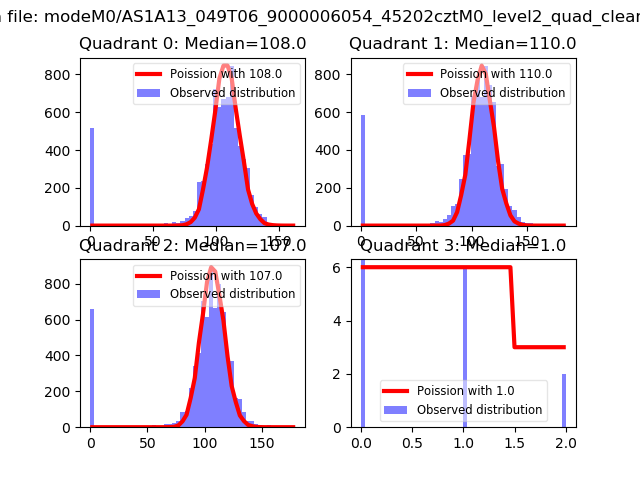
| Comparison with Poisson distribution Blue bars denote a histogram of data divided into 1 sec bins. Red curve is a Poisson curve with rate = median count rate of data. |
 |
 |
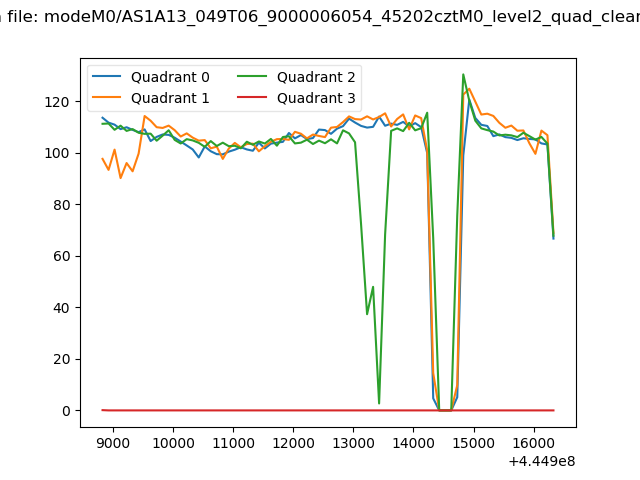
| Quadrant-wise count rates Data is divided into 100 sec bins |
 |
|
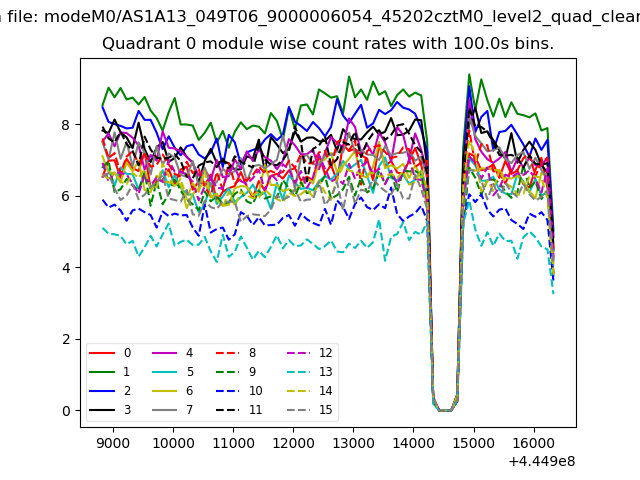
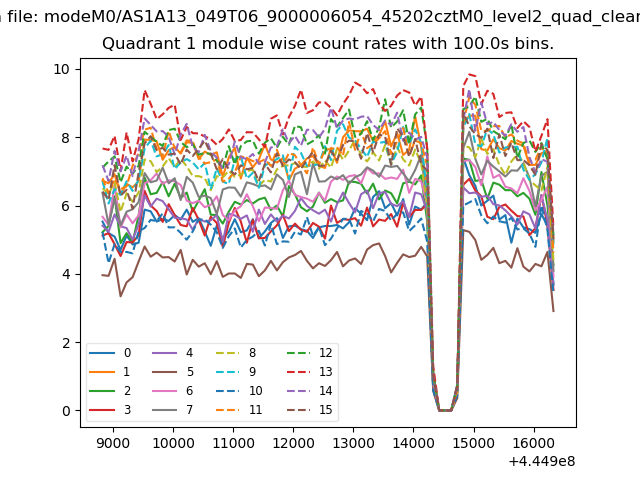
| Module-wise count rates for Quadrant A Data is divided into 100 sec bins |
 |
 |
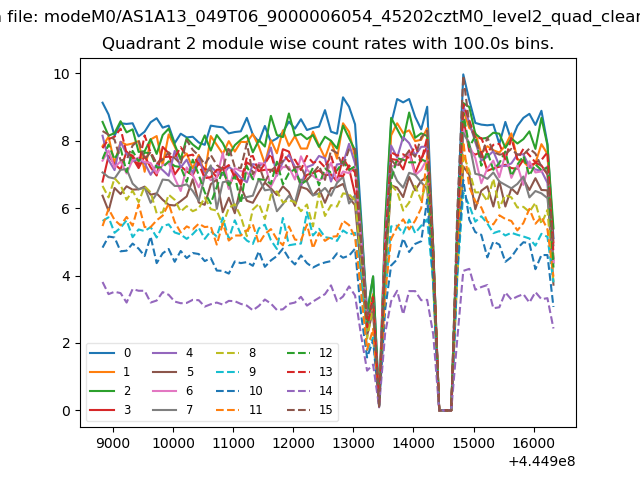
| Module-wise count rates for Quadrant B Data is divided into 100 sec bins |
 |
 |
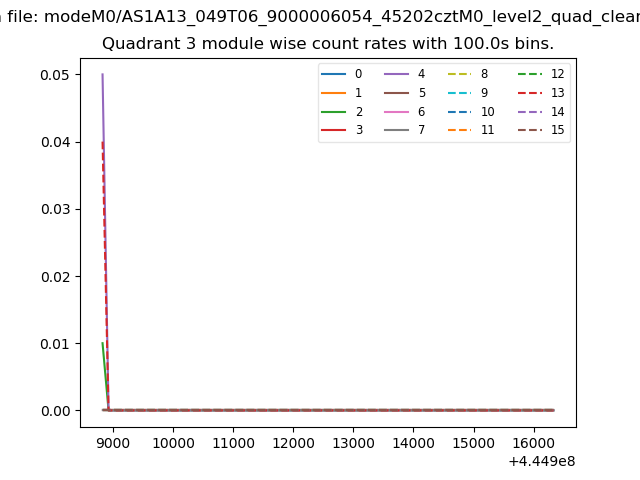
| Module-wise count rates for Quadrant C Data is divided into 100 sec bins |
 |
 |
| Module-wise count rates for Quadrant D Data is divided into 100 sec bins |
 |
 |
| Parameter | Plot |
|---|---|
| CZT HV Monitor | 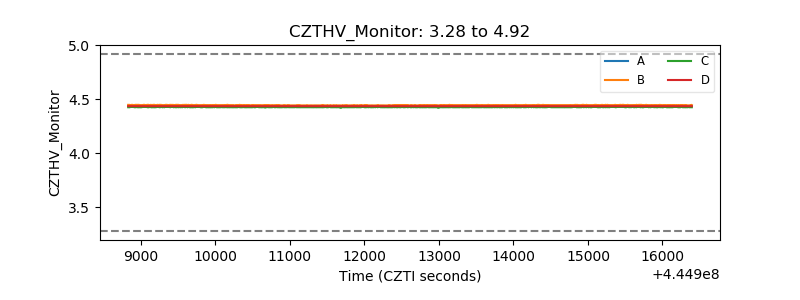 |
| D_VDD | 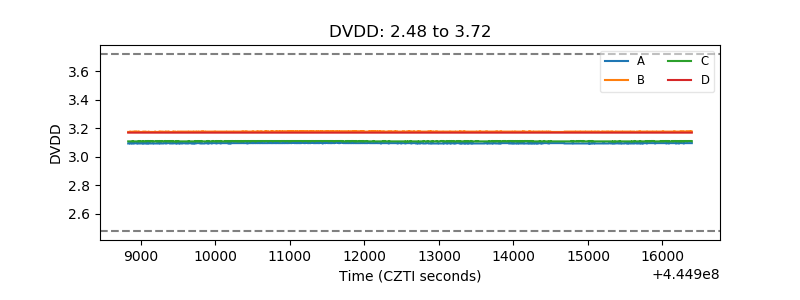 |
| Temperature 1 | 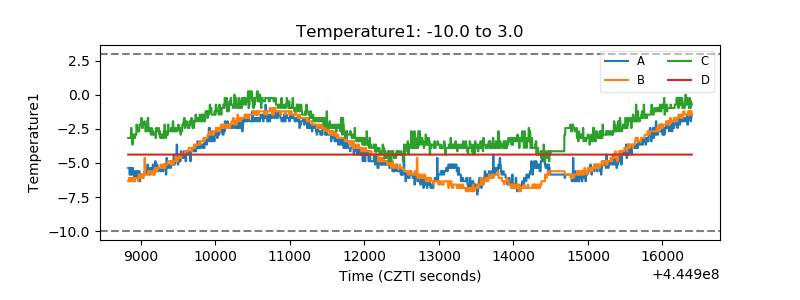 |
| Veto HV Monitor | 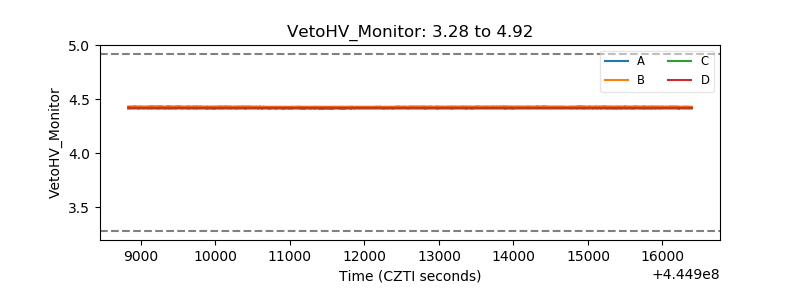 |
| Veto LLD | 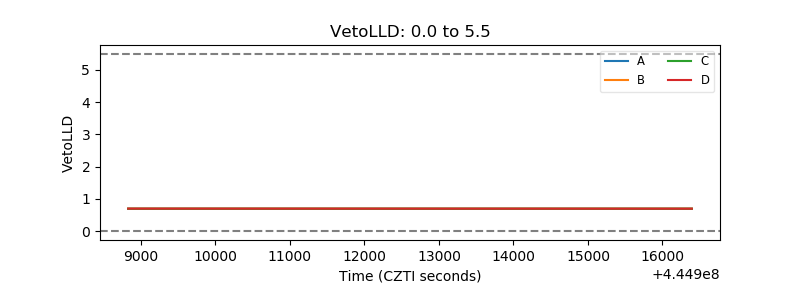 |
| Alpha Counter | 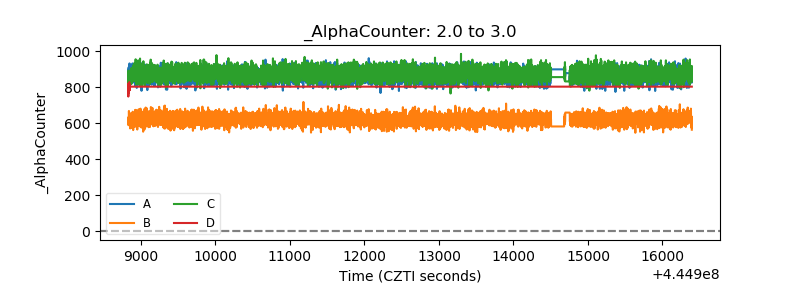 |
| _CPM_Rate | 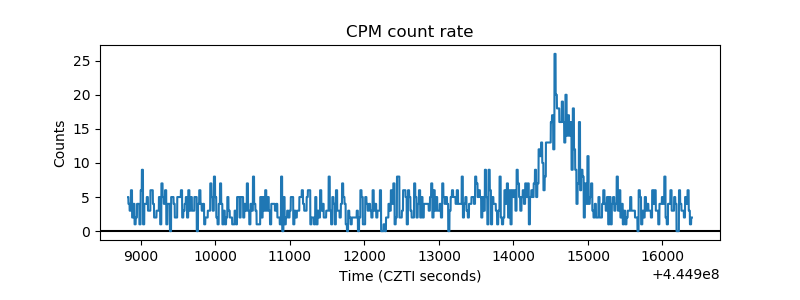 |
| CZT Counter | 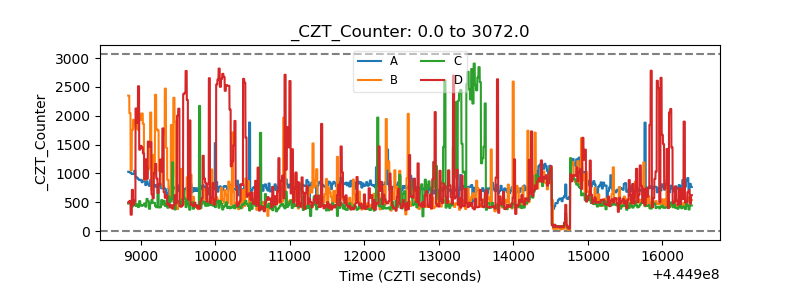 |
| +2.5 Volts monitor |  |
| +5 Volts monitor | 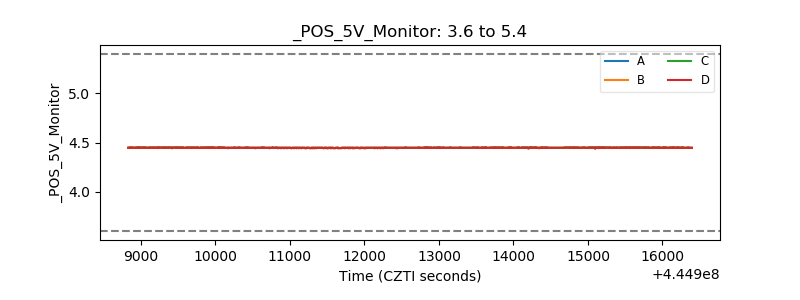 |
| _ROLL_ROT | 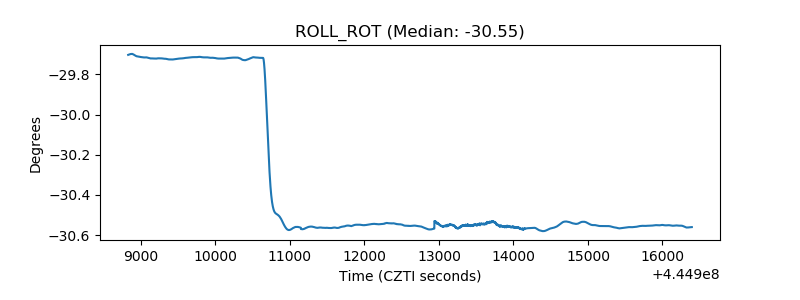 |
| _Roll_DEC | 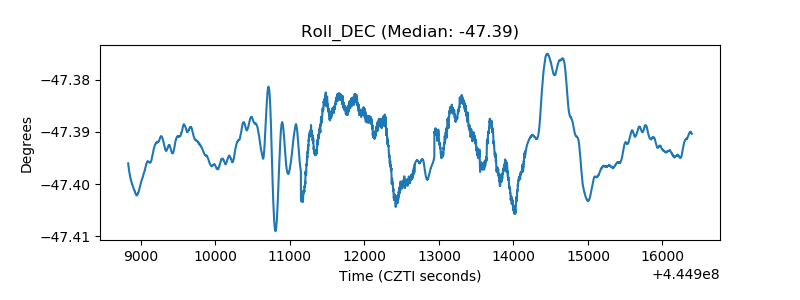 |
| _Roll_RA | 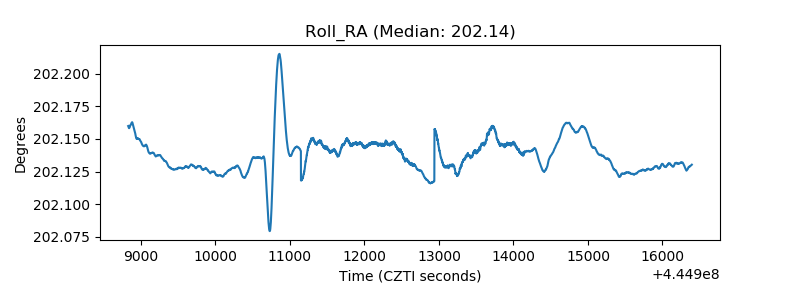 |
| Veto Counter | 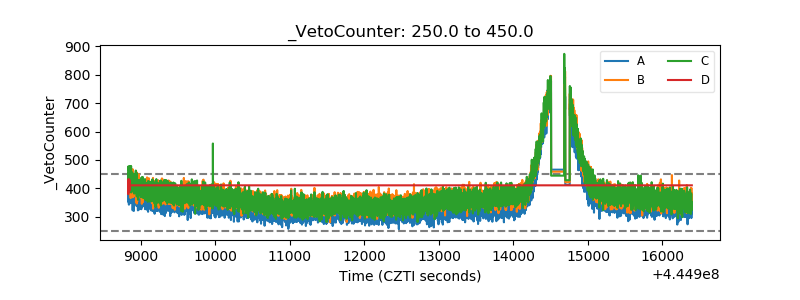 |