| Param | Original file | Final file |
|---|---|---|
| Filename | modeM0/AS1A13_049T06_9000006054_45203cztM0_level2.fits | modeM0/AS1A13_049T06_9000006054_45203cztM0_level2_quad_clean.evt |
| Size (bytes) | 589,659,840 | 124,666,560 |
| Size | 562.3 MB | 118.9 MB |
| Events in quadrant A | 6,197,368 | 832,469 |
| Events in quadrant B | 5,102,618 | 846,964 |
| Events in quadrant C | 3,765,051 | 831,924 |
| Events in quadrant D | 6,152,394 | 716,444 |
| Mode M0 | |||
|---|---|---|---|
| Quadrant | BADHDUFLAG | Total packets | Discarded packets |
| A | 0 | 24111 | 0 |
| B | 0 | 20330 | 0 |
| C | 0 | 16940 | 0 |
| D | 0 | 23632 | 0 |
| Mode SS | |||
|---|---|---|---|
| Quadrant | BADHDUFLAG | Total packets | Discarded packets |
| A | 0 | 156 | 0 |
| B | 0 | 156 | 0 |
| C | 0 | 156 | 0 |
| D | 0 | 156 | 0 |
| Quadrant | Total seconds | Saturated seconds | Saturation percentage |
|---|---|---|---|
| A | 7868 | 112 | 1.423488% |
| B | 7868 | 249 | 3.164718% |
| C | 7869 | 86 | 1.092896% |
| D | 7869 | 588 | 7.472360% |
Noise dominated data is calculated using 1-second bins in cleaned event files. If a bin has >2000 counts, and if more than 50% of those come from <1% of pixels, then it is considered to be noise-dominated and hence unusable.
| Quadrant | # 1 sec bins | Bins with >0 counts | Bins with >2000 counts | High rate bins dominated by noise | Noise dominated (total time) | Noise dominated (detector-on time) | Marked lightcurve |
|---|---|---|---|---|---|---|---|
| A | 7868 | 7868 | 8 | 8 | 0.10% | 0.10% | 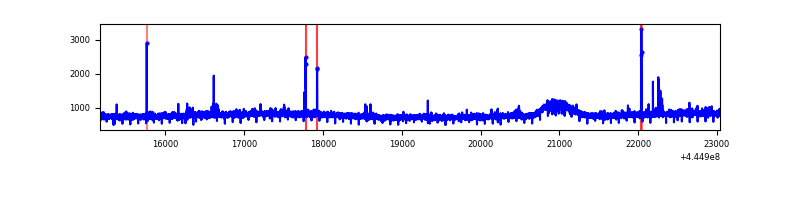 |
| B | 7868 | 7868 | 132 | 132 | 1.68% | 1.68% | 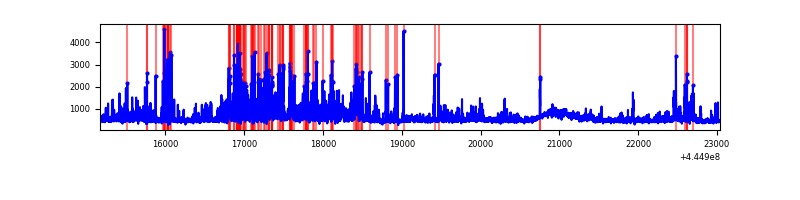 |
| C | 7868 | 7868 | 77 | 77 | 0.98% | 0.98% | 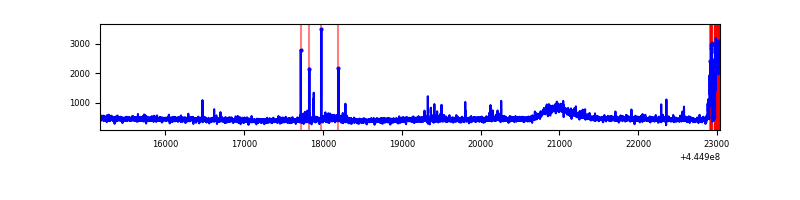 |
| D | 7869 | 7869 | 571 | 571 | 7.26% | 7.26% |  |
Top three noisy pixels from each quadrant. If the there are fewer than three noisy pixels in the level2.evt file, extra rows are filled as -1
| Pixel properties | Quadrant properties | ||||||
|---|---|---|---|---|---|---|---|
| Quadrant | DetID | PixID | Counts | Sigma | Mean | Median | Sigma |
| A | 10 | 83 | 2667060 | 14276.46 | 893 | 871 | 186.8 |
| A | 0 | 243 | 24450 | 126.26 | 893 | 871 | 186.8 |
| A | 13 | 248 | 17965 | 91.53 | 893 | 871 | 186.8 |
| B | 3 | 112 | 844109 | 4793.56 | 883 | 853 | 175.9 |
| B | 5 | 255 | 242529 | 1373.83 | 883 | 853 | 175.9 |
| B | 4 | 170 | 114787 | 647.67 | 883 | 853 | 175.9 |
| C | 15 | 208 | 176540 | 844.77 | 879 | 883 | 207.9 |
| C | 3 | 233 | 60905 | 288.66 | 879 | 883 | 207.9 |
| C | 0 | 207 | 52055 | 246.1 | 879 | 883 | 207.9 |
| D | 1 | 52 | 1318057 | 6012.27 | 862 | 836 | 219.1 |
| D | 13 | 249 | 827781 | 3774.47 | 862 | 836 | 219.1 |
| D | 2 | 249 | 91859 | 415.46 | 862 | 836 | 219.1 |
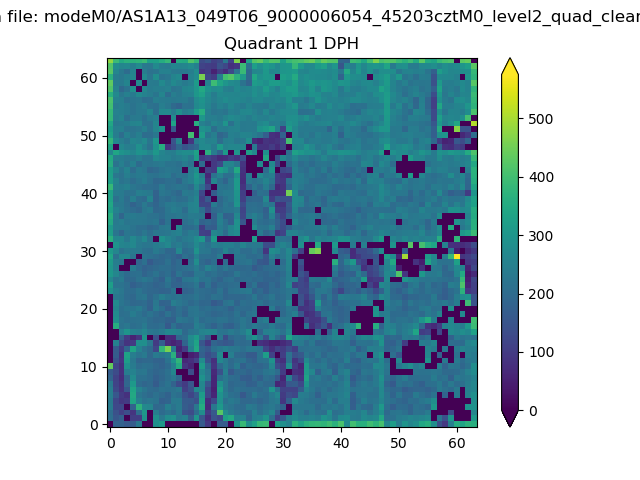
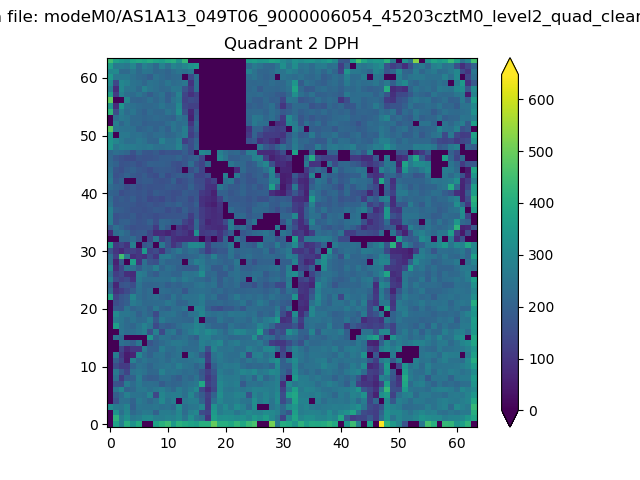
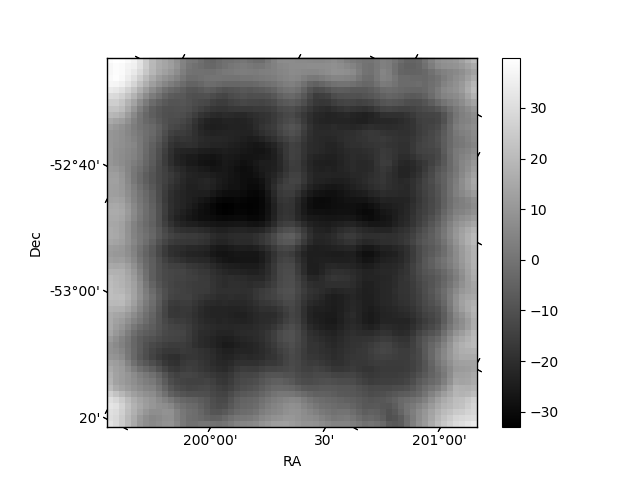
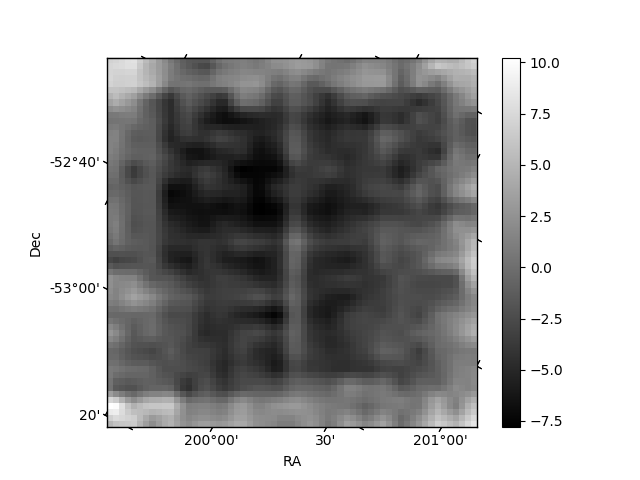
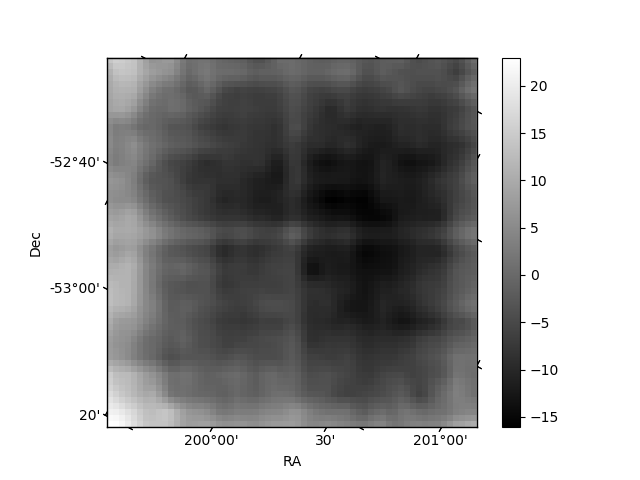
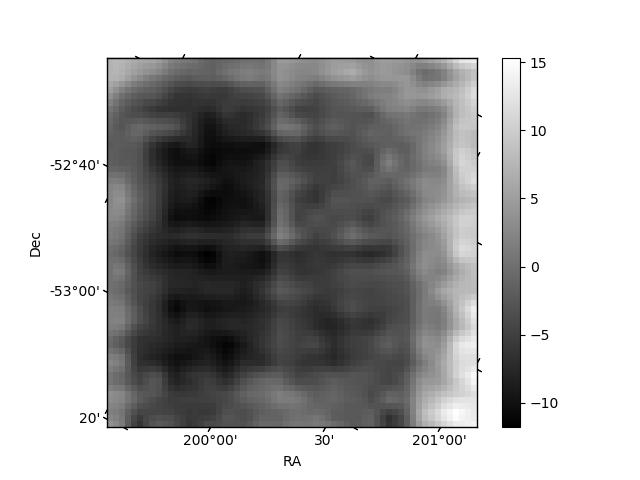
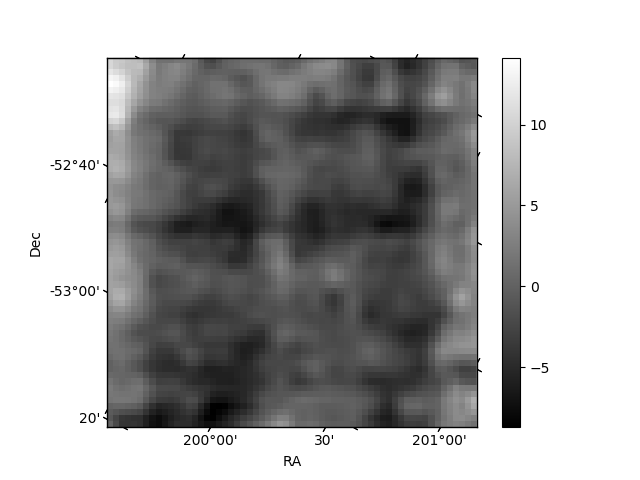
Histogram calculated using DETX and DETY for each event in the final _common_clean file
| Quadrant A | 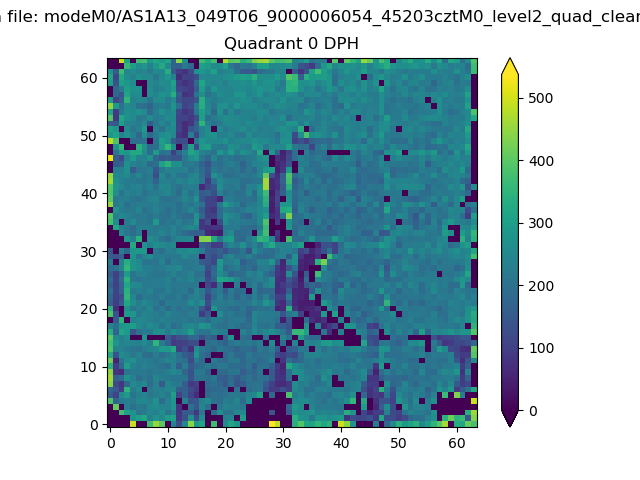 |
 |
Quadrant B |
|---|---|---|---|
| Quadrant D | 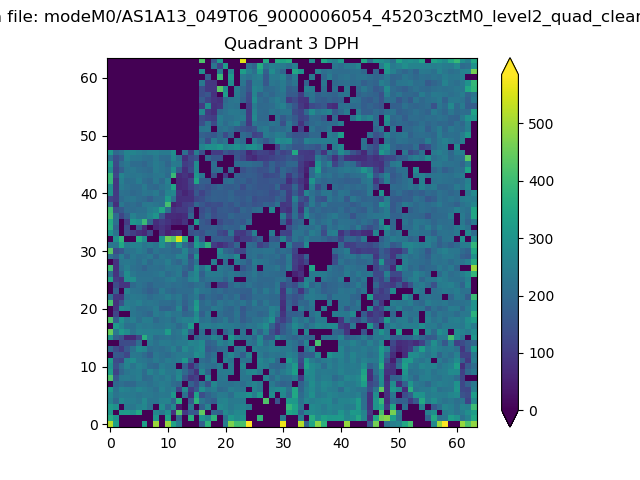 |
 |
Quadrant C |
| Plot type | Count rate plots | Images |
|---|---|---|
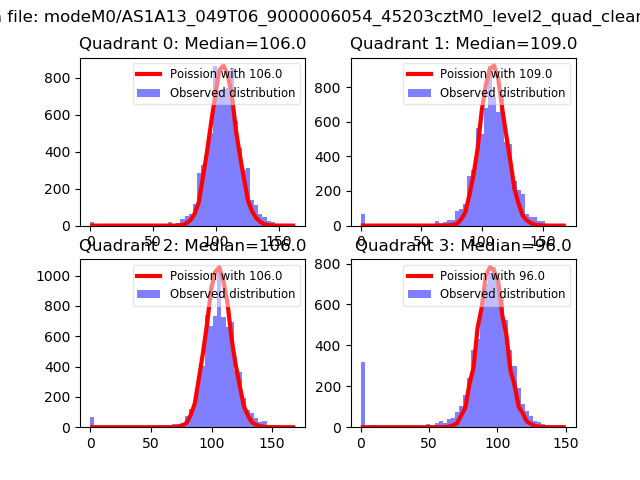
| Comparison with Poisson distribution Blue bars denote a histogram of data divided into 1 sec bins. Red curve is a Poisson curve with rate = median count rate of data. |
 |
 |
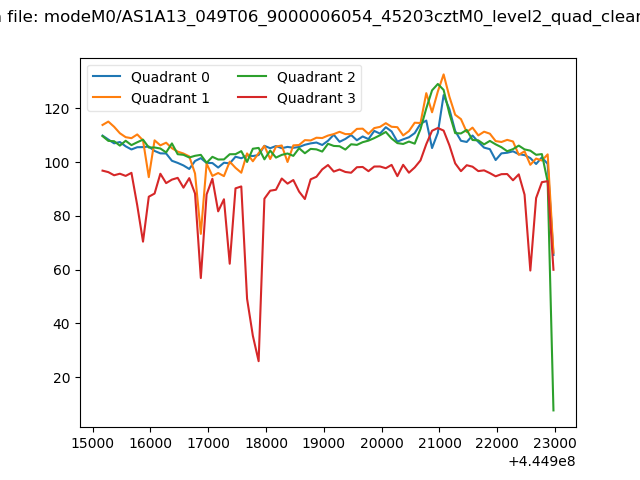
| Quadrant-wise count rates Data is divided into 100 sec bins |
 |
|
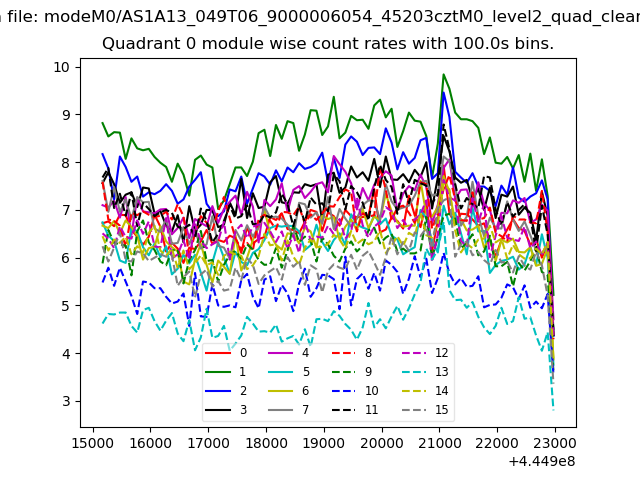
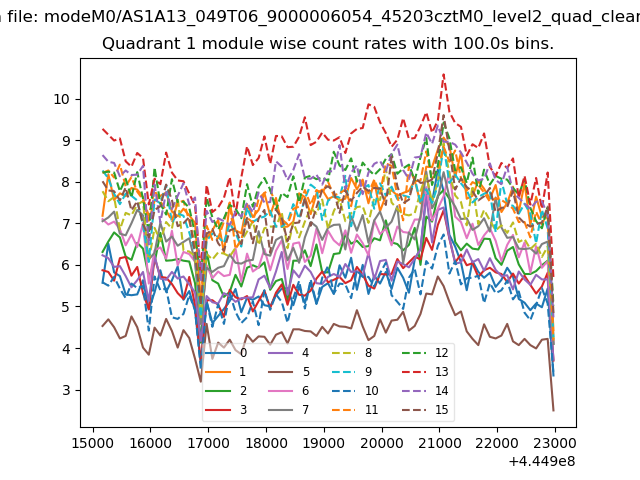
| Module-wise count rates for Quadrant A Data is divided into 100 sec bins |
 |
 |
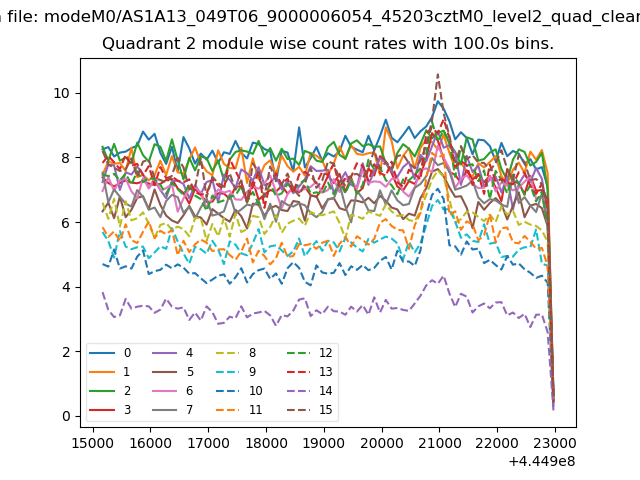
| Module-wise count rates for Quadrant B Data is divided into 100 sec bins |
 |
 |
| Module-wise count rates for Quadrant C Data is divided into 100 sec bins |
 |
 |
| Module-wise count rates for Quadrant D Data is divided into 100 sec bins |
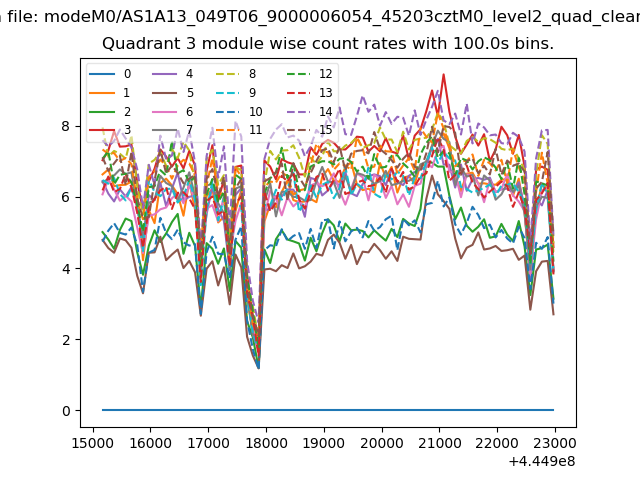 |
 |
| Parameter | Plot |
|---|---|
| CZT HV Monitor | 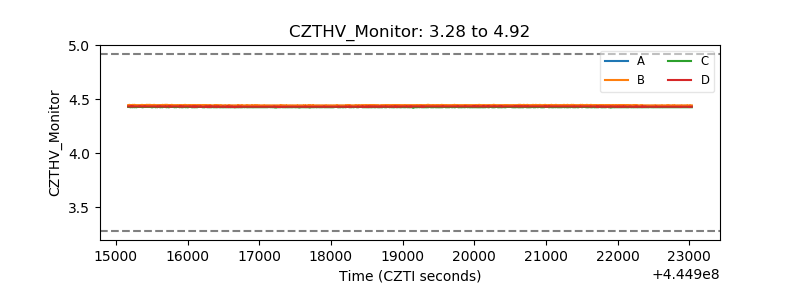 |
| D_VDD | 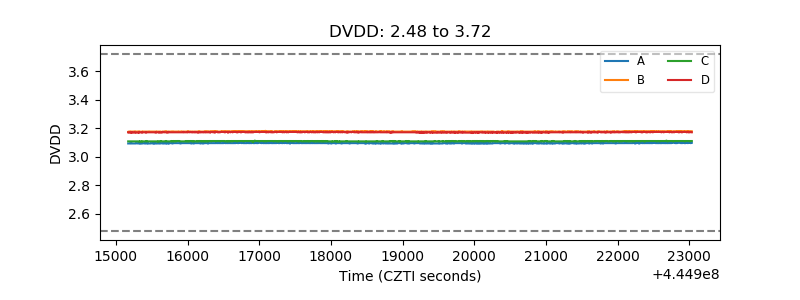 |
| Temperature 1 | 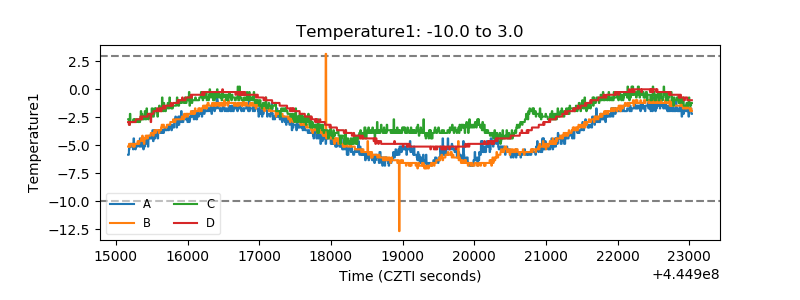 |
| Veto HV Monitor | 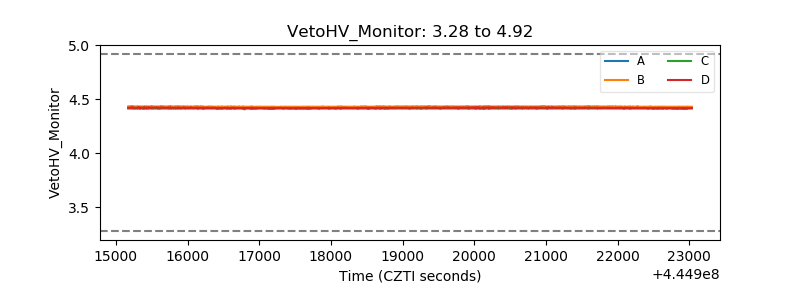 |
| Veto LLD | 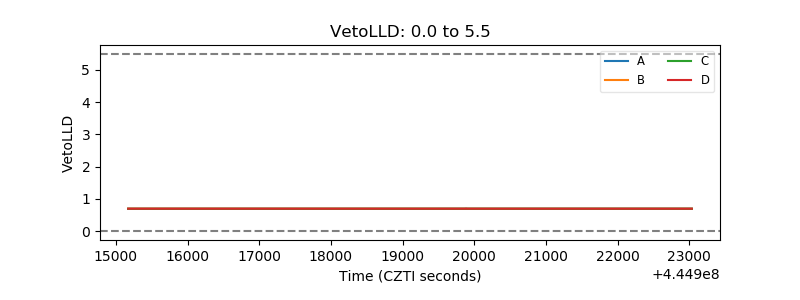 |
| Alpha Counter | 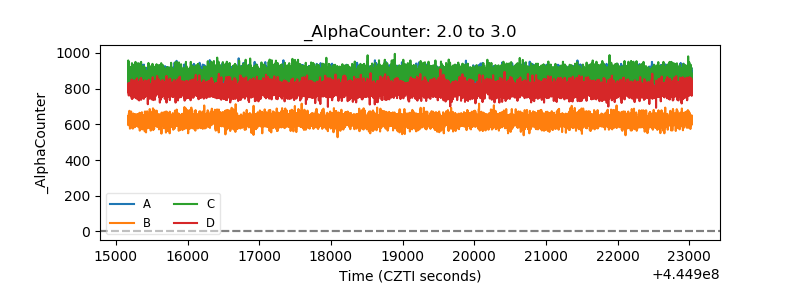 |
| _CPM_Rate | 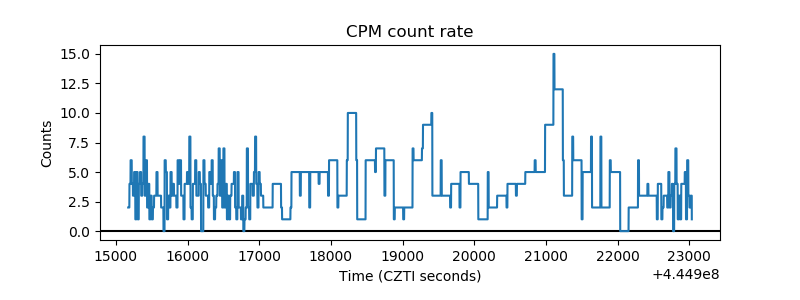 |
| CZT Counter | 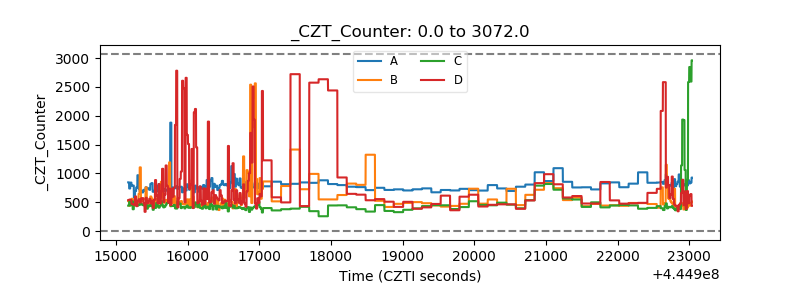 |
| +2.5 Volts monitor | 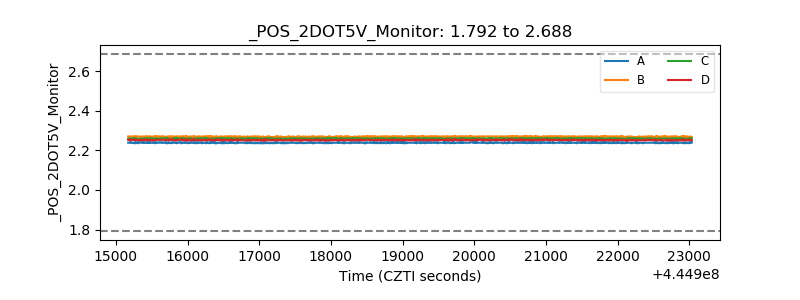 |
| +5 Volts monitor | 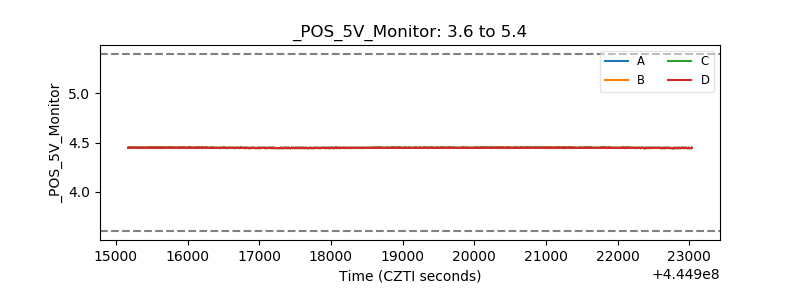 |
| _ROLL_ROT | 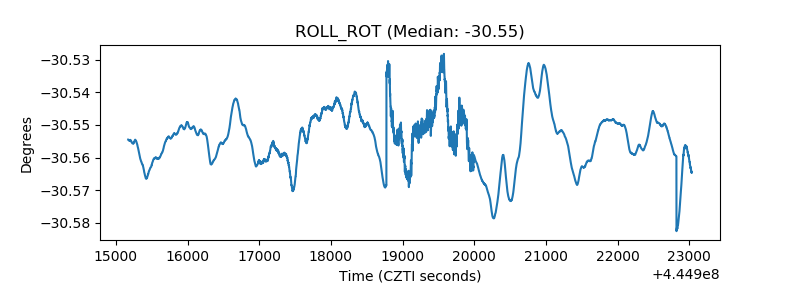 |
| _Roll_DEC | 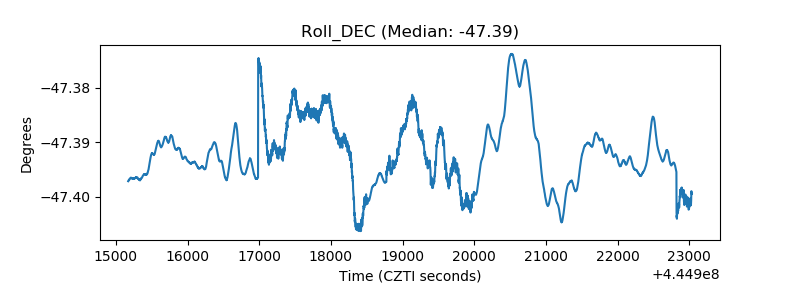 |
| _Roll_RA | 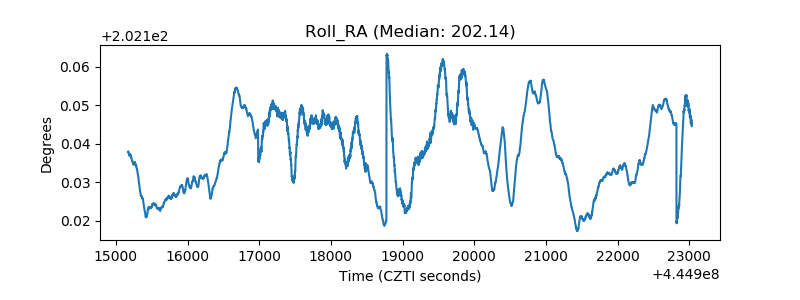 |
| Veto Counter | 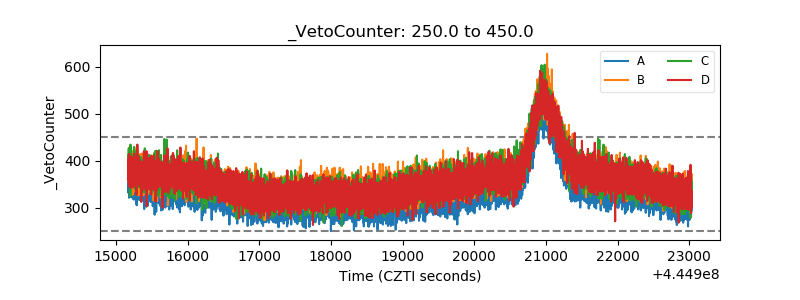 |