| Param | Original file | Final file |
|---|---|---|
| Filename | modeM0/AS1A13_049T06_9000006054_45204cztM0_level2.fits | modeM0/AS1A13_049T06_9000006054_45204cztM0_level2_quad_clean.evt |
| Size (bytes) | 491,515,200 | 105,713,280 |
| Size | 468.7 MB | 100.8 MB |
| Events in quadrant A | 5,323,704 | 701,706 |
| Events in quadrant B | 3,566,890 | 723,701 |
| Events in quadrant C | 3,530,451 | 693,847 |
| Events in quadrant D | 5,256,086 | 616,511 |
| Mode M0 | |||
|---|---|---|---|
| Quadrant | BADHDUFLAG | Total packets | Discarded packets |
| A | 0 | 20540 | 3 |
| B | 0 | 14979 | 0 |
| C | 0 | 15340 | 1 |
| D | 0 | 20125 | 0 |
| Mode SS | |||
|---|---|---|---|
| Quadrant | BADHDUFLAG | Total packets | Discarded packets |
| A | 0 | 134 | 0 |
| B | 0 | 134 | 0 |
| C | 0 | 134 | 0 |
| D | 0 | 134 | 0 |
| Quadrant | Total seconds | Saturated seconds | Saturation percentage |
|---|---|---|---|
| A | 6664 | 140 | 2.100840% |
| B | 6664 | 137 | 2.055822% |
| C | 6664 | 174 | 2.611044% |
| D | 6665 | 433 | 6.496624% |
Noise dominated data is calculated using 1-second bins in cleaned event files. If a bin has >2000 counts, and if more than 50% of those come from <1% of pixels, then it is considered to be noise-dominated and hence unusable.
| Quadrant | # 1 sec bins | Bins with >0 counts | Bins with >2000 counts | High rate bins dominated by noise | Noise dominated (total time) | Noise dominated (detector-on time) | Marked lightcurve |
|---|---|---|---|---|---|---|---|
| A | 6664 | 6664 | 6 | 6 | 0.09% | 0.09% | 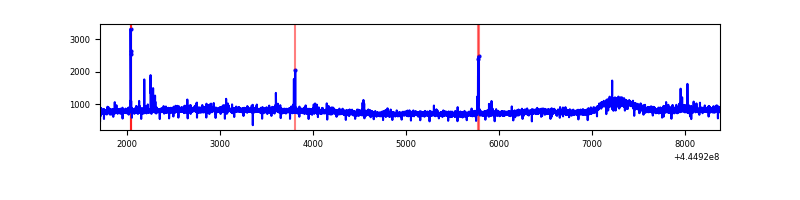 |
| B | 6664 | 6664 | 22 | 22 | 0.33% | 0.33% | 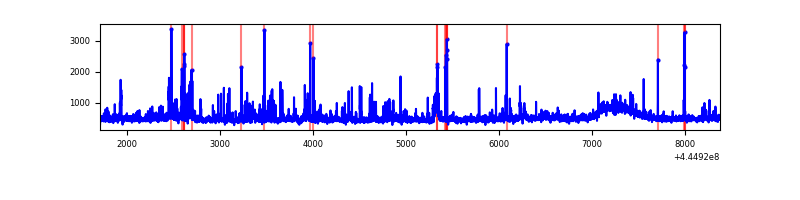 |
| C | 6665 | 6665 | 163 | 163 | 2.45% | 2.45% | 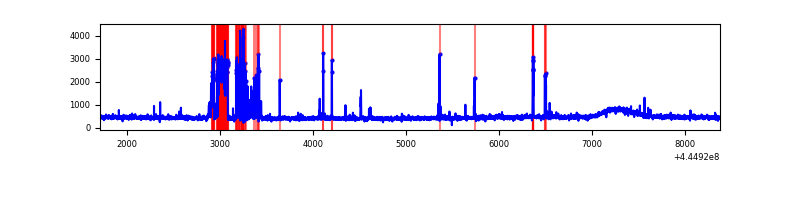 |
| D | 6665 | 6665 | 364 | 364 | 5.46% | 5.46% | 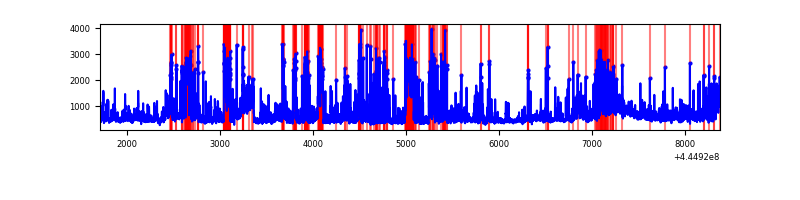 |
Top three noisy pixels from each quadrant. If the there are fewer than three noisy pixels in the level2.evt file, extra rows are filled as -1
| Pixel properties | Quadrant properties | ||||||
|---|---|---|---|---|---|---|---|
| Quadrant | DetID | PixID | Counts | Sigma | Mean | Median | Sigma |
| A | 10 | 83 | 2309782 | 14577.89 | 758 | 741 | 158.4 |
| A | 13 | 248 | 29083 | 178.93 | 758 | 741 | 158.4 |
| A | 0 | 243 | 21254 | 129.51 | 758 | 741 | 158.4 |
| B | 3 | 112 | 246693 | 1631.06 | 754 | 729 | 150.8 |
| B | 10 | 3 | 60292 | 394.98 | 754 | 729 | 150.8 |
| B | 4 | 171 | 59109 | 387.14 | 754 | 729 | 150.8 |
| C | 15 | 208 | 451133 | 2585.21 | 740 | 743 | 174.2 |
| C | 1 | 3 | 63974 | 362.94 | 740 | 743 | 174.2 |
| C | 0 | 207 | 51874 | 293.49 | 740 | 743 | 174.2 |
| D | 13 | 249 | 769958 | 4117.52 | 732 | 707 | 186.8 |
| D | 5 | 222 | 304085 | 1623.87 | 732 | 707 | 186.8 |
| D | 4 | 232 | 215195 | 1148.08 | 732 | 707 | 186.8 |
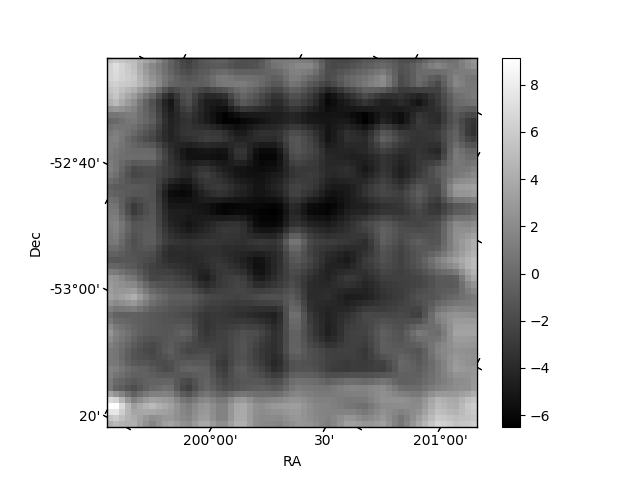
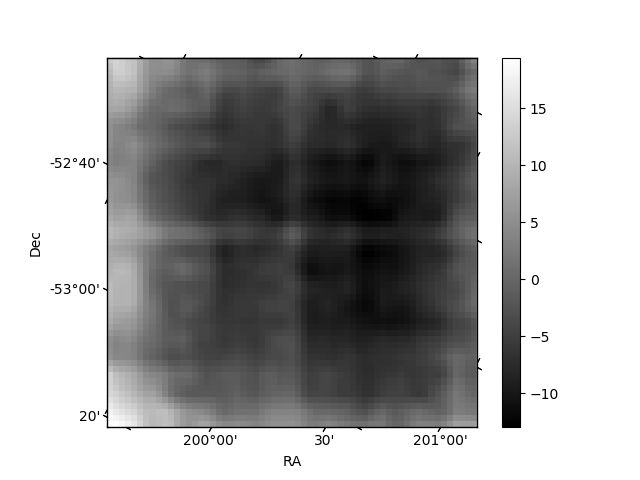
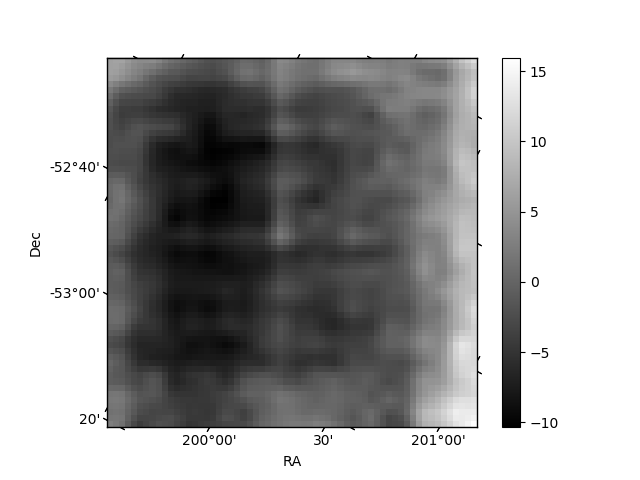
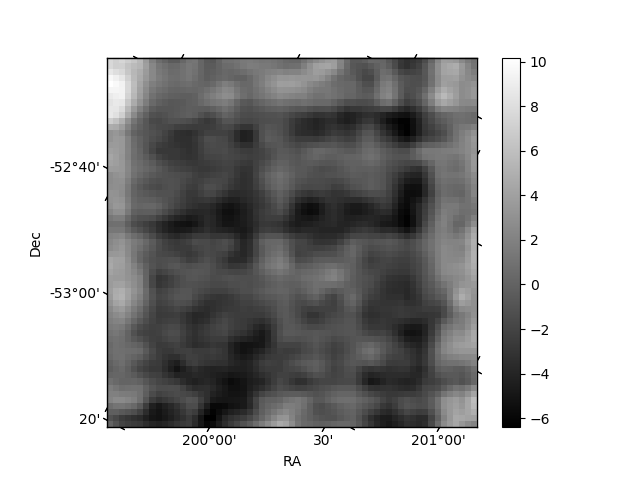
Histogram calculated using DETX and DETY for each event in the final _common_clean file
| Quadrant A | 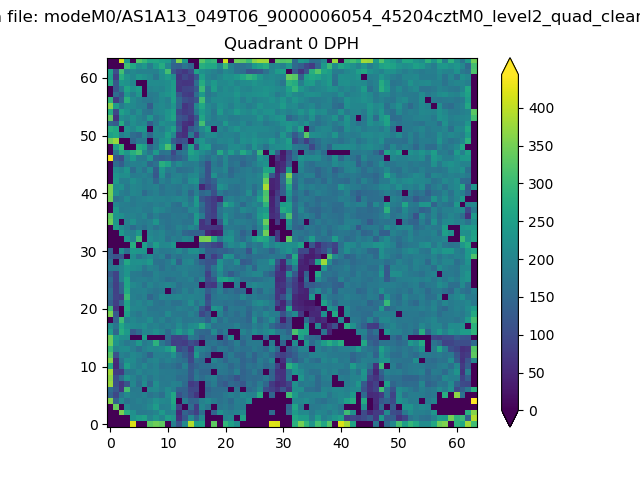 |
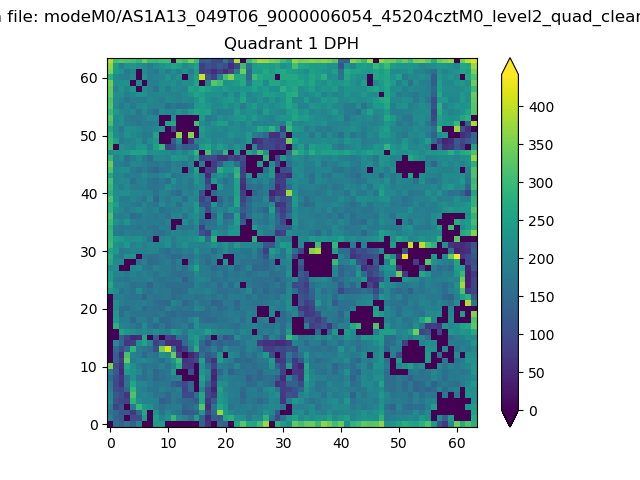 |
Quadrant B |
|---|---|---|---|
| Quadrant D | 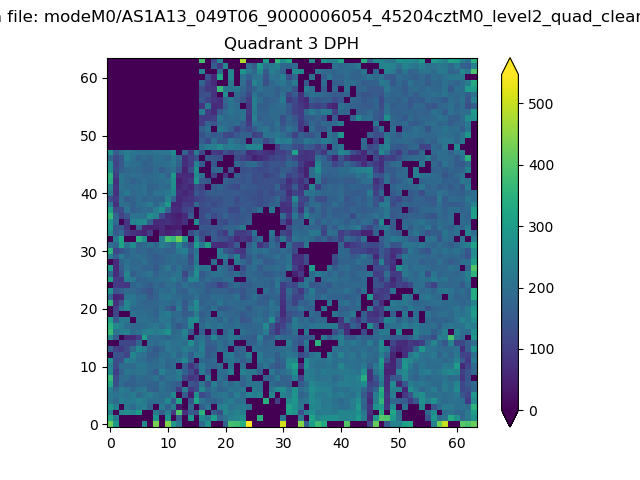 |
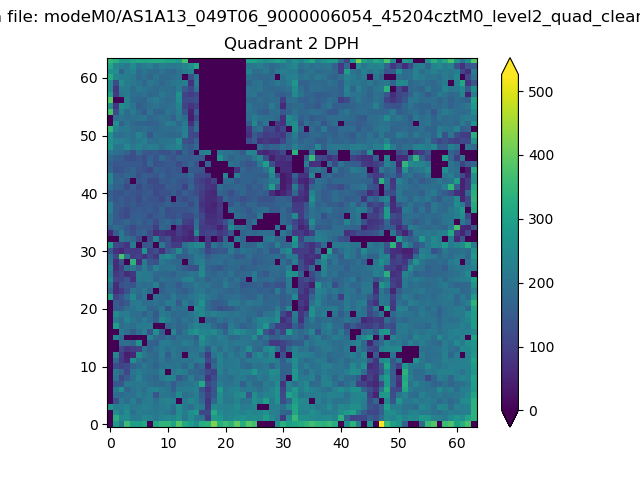 |
Quadrant C |
| Plot type | Count rate plots | Images |
|---|---|---|
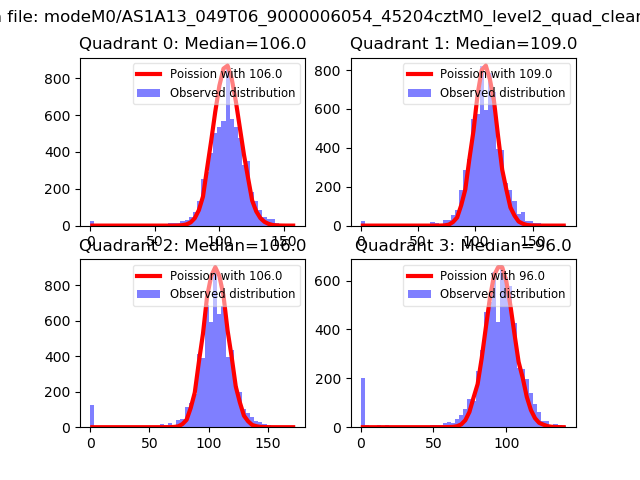
| Comparison with Poisson distribution Blue bars denote a histogram of data divided into 1 sec bins. Red curve is a Poisson curve with rate = median count rate of data. |
 |
 |
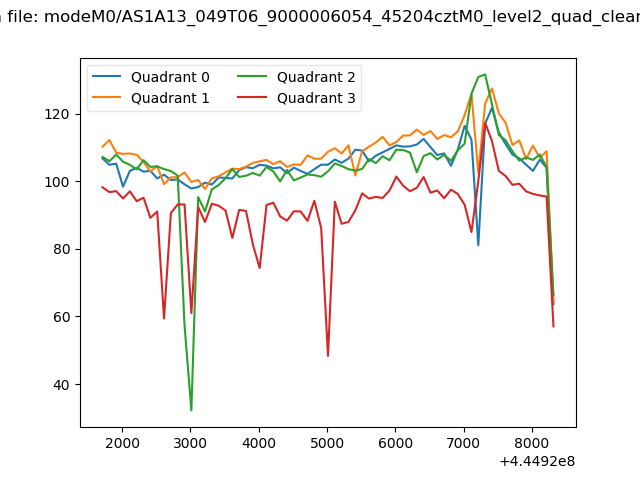
| Quadrant-wise count rates Data is divided into 100 sec bins |
 |
|
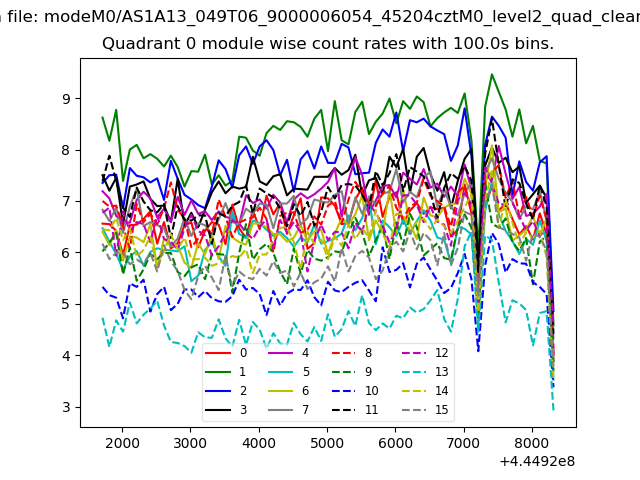
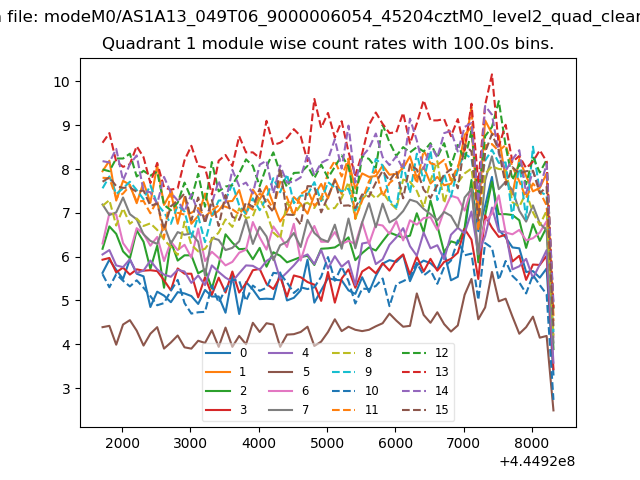
| Module-wise count rates for Quadrant A Data is divided into 100 sec bins |
 |
 |
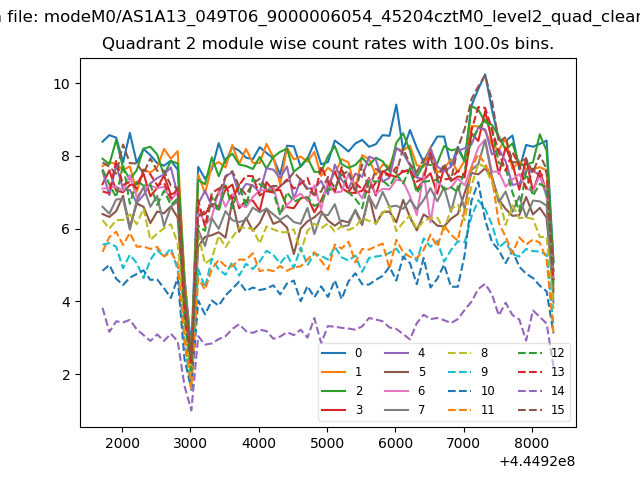
| Module-wise count rates for Quadrant B Data is divided into 100 sec bins |
 |
 |
| Module-wise count rates for Quadrant C Data is divided into 100 sec bins |
 |
 |
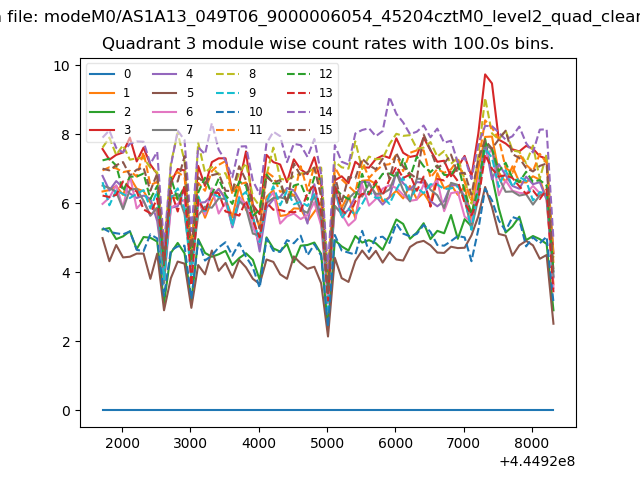
| Module-wise count rates for Quadrant D Data is divided into 100 sec bins |
 |
 |
| Parameter | Plot |
|---|---|
| CZT HV Monitor | 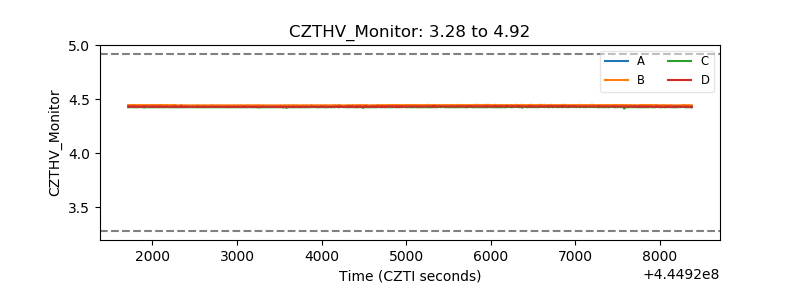 |
| D_VDD | 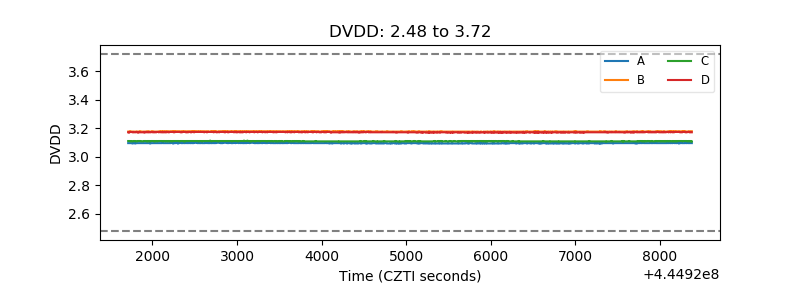 |
| Temperature 1 | 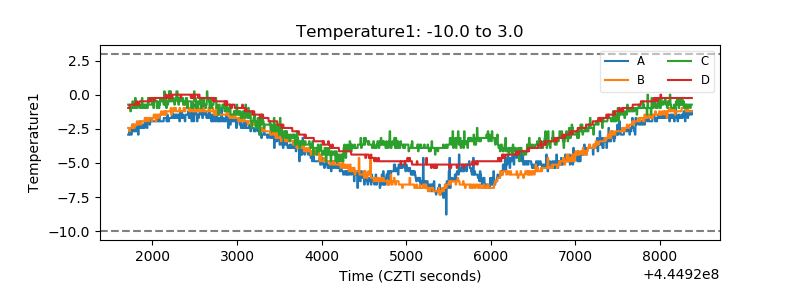 |
| Veto HV Monitor | 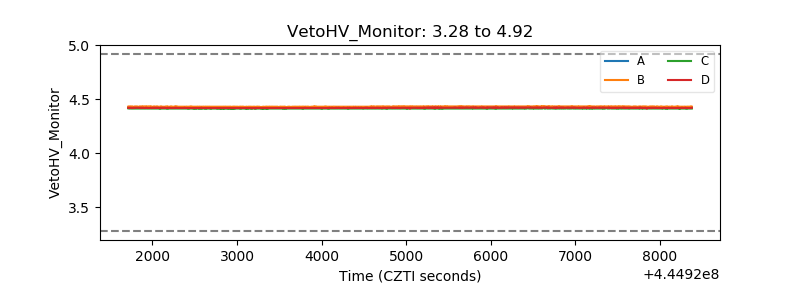 |
| Veto LLD | 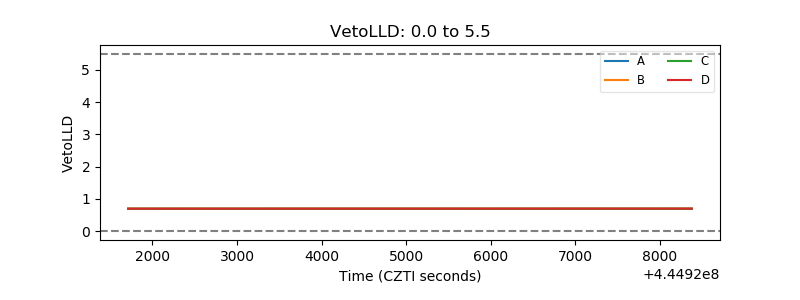 |
| Alpha Counter | 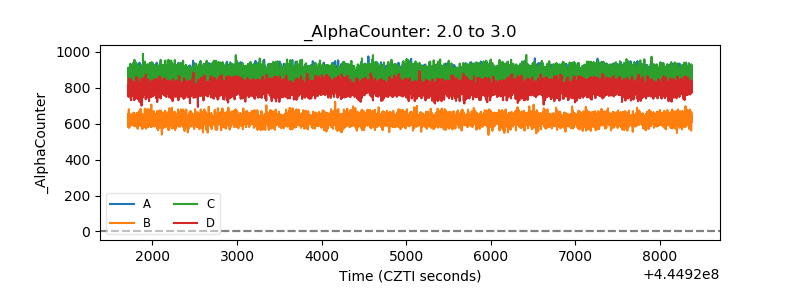 |
| _CPM_Rate | 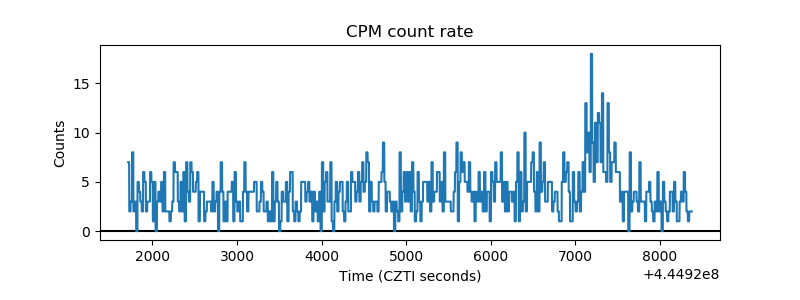 |
| CZT Counter | 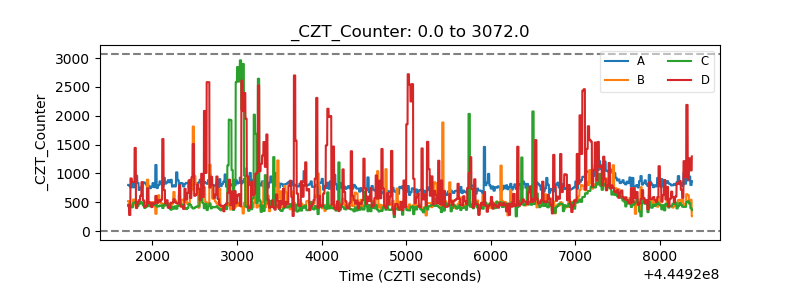 |
| +2.5 Volts monitor |  |
| +5 Volts monitor | 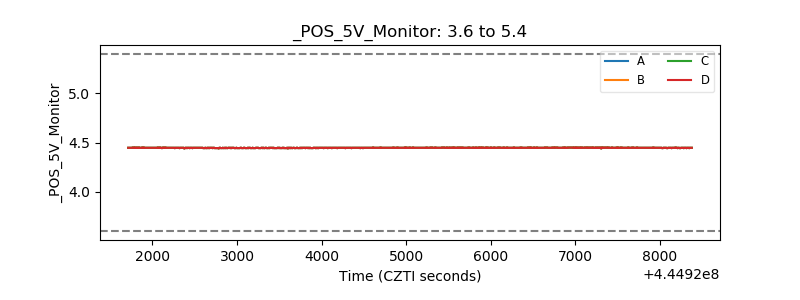 |
| _ROLL_ROT | 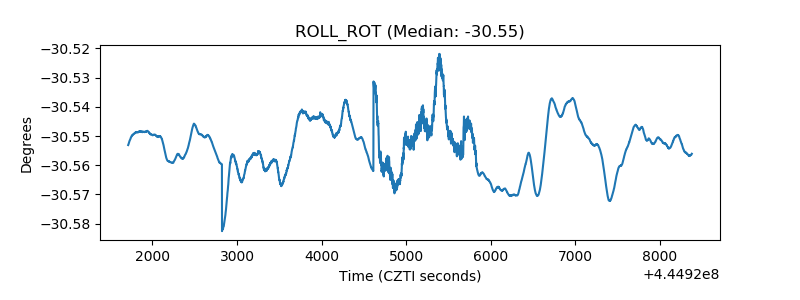 |
| _Roll_DEC | 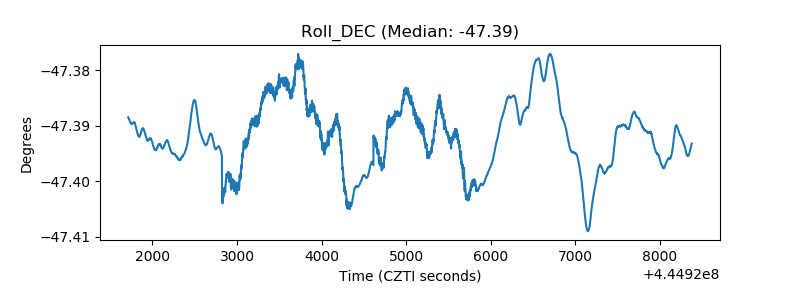 |
| _Roll_RA | 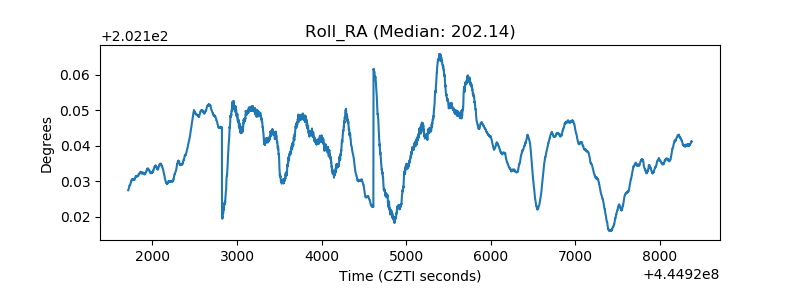 |
| Veto Counter | 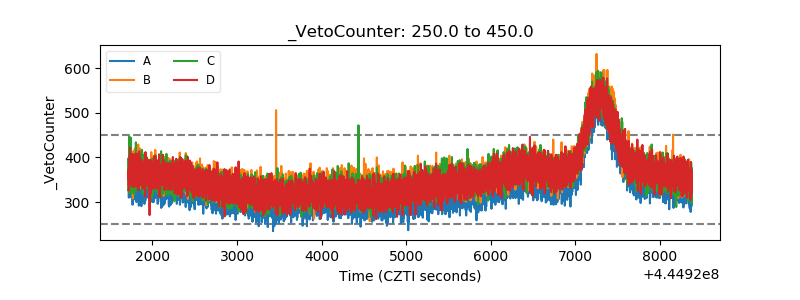 |