| Param | Original file | Final file |
|---|---|---|
| Filename | modeM0/AS1A13_049T06_9000006054_45208cztM0_level2.fits | modeM0/AS1A13_049T06_9000006054_45208cztM0_level2_quad_clean.evt |
| Size (bytes) | 372,723,840 | 79,018,560 |
| Size | 355.5 MB | 75.4 MB |
| Events in quadrant A | 3,971,547 | 522,274 |
| Events in quadrant B | 2,918,237 | 534,975 |
| Events in quadrant C | 2,244,759 | 527,250 |
| Events in quadrant D | 4,272,785 | 456,277 |
| Mode M0 | |||
|---|---|---|---|
| Quadrant | BADHDUFLAG | Total packets | Discarded packets |
| A | 0 | 15438 | 0 |
| B | 0 | 11958 | 0 |
| C | 0 | 10541 | 0 |
| D | 0 | 16256 | 0 |
| Mode SS | |||
|---|---|---|---|
| Quadrant | BADHDUFLAG | Total packets | Discarded packets |
| A | 0 | 102 | 0 |
| B | 0 | 102 | 0 |
| C | 0 | 102 | 0 |
| D | 0 | 102 | 0 |
| Quadrant | Total seconds | Saturated seconds | Saturation percentage |
|---|---|---|---|
| A | 5009 | 127 | 2.535436% |
| B | 5009 | 166 | 3.314035% |
| C | 5010 | 19 | 0.379242% |
| D | 5010 | 375 | 7.485030% |
Noise dominated data is calculated using 1-second bins in cleaned event files. If a bin has >2000 counts, and if more than 50% of those come from <1% of pixels, then it is considered to be noise-dominated and hence unusable.
| Quadrant | # 1 sec bins | Bins with >0 counts | Bins with >2000 counts | High rate bins dominated by noise | Noise dominated (total time) | Noise dominated (detector-on time) | Marked lightcurve |
|---|---|---|---|---|---|---|---|
| A | 5009 | 5009 | 0 | 0 | 0.00% | 0.00% | 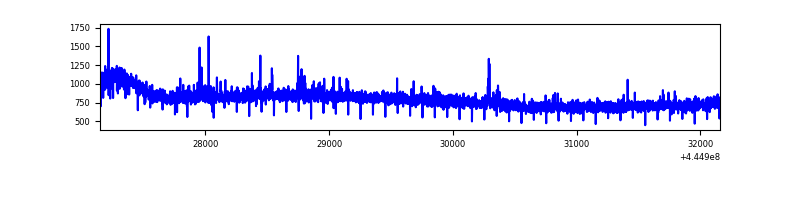 |
| B | 5009 | 5009 | 53 | 53 | 1.06% | 1.06% | 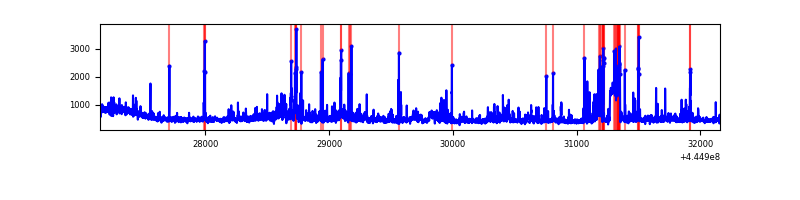 |
| C | 5010 | 5010 | 7 | 7 | 0.14% | 0.14% |  |
| D | 5010 | 5010 | 294 | 294 | 5.87% | 5.87% | 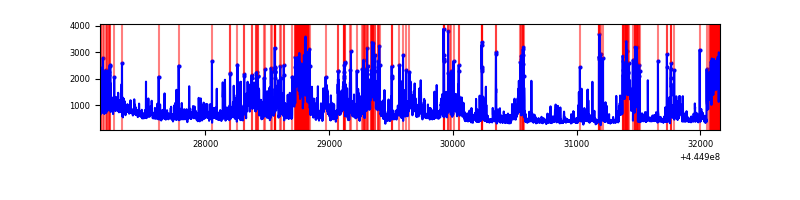 |
Top three noisy pixels from each quadrant. If the there are fewer than three noisy pixels in the level2.evt file, extra rows are filled as -1
| Pixel properties | Quadrant properties | ||||||
|---|---|---|---|---|---|---|---|
| Quadrant | DetID | PixID | Counts | Sigma | Mean | Median | Sigma |
| A | 10 | 83 | 1769749 | 14960.05 | 559 | 546 | 118.3 |
| A | 13 | 248 | 19541 | 160.62 | 559 | 546 | 118.3 |
| A | 0 | 243 | 14741 | 120.03 | 559 | 546 | 118.3 |
| B | 3 | 112 | 413904 | 3701.4 | 558 | 538 | 111.7 |
| B | 5 | 32 | 123148 | 1097.89 | 558 | 538 | 111.7 |
| B | 0 | 183 | 68114 | 605.1 | 558 | 538 | 111.7 |
| C | 1 | 3 | 42005 | 317.06 | 552 | 554 | 130.7 |
| C | 12 | 250 | 32073 | 241.09 | 552 | 554 | 130.7 |
| C | 3 | 233 | 16648 | 123.1 | 552 | 554 | 130.7 |
| D | 4 | 232 | 587058 | 4286.86 | 540 | 523 | 136.8 |
| D | 13 | 249 | 379248 | 2768.02 | 540 | 523 | 136.8 |
| D | 9 | 49 | 276434 | 2016.57 | 540 | 523 | 136.8 |
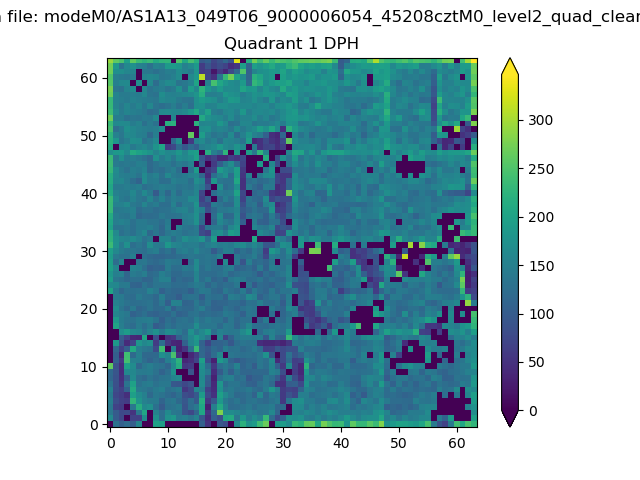
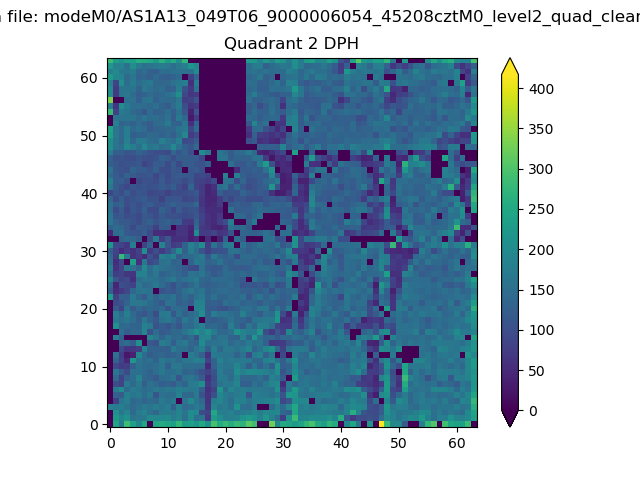
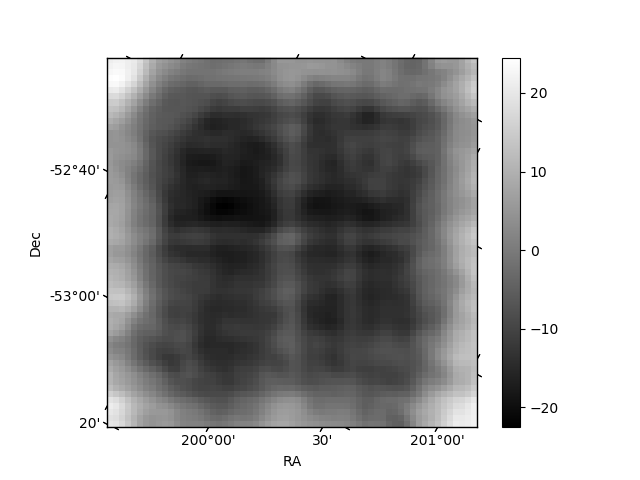
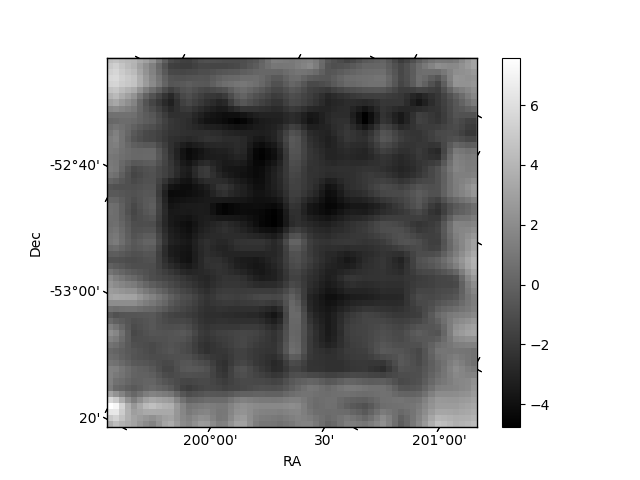
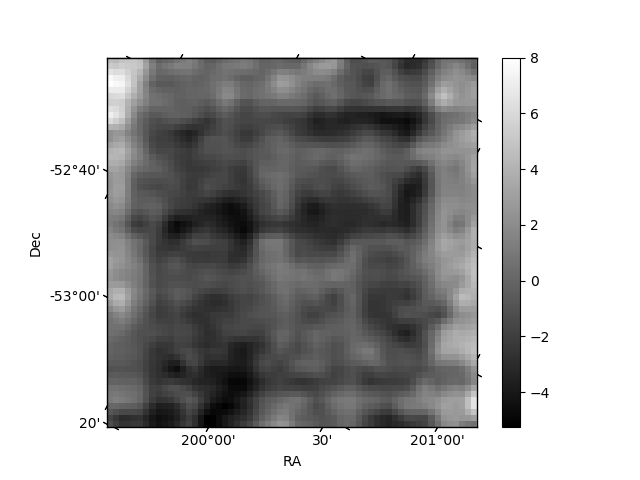
Histogram calculated using DETX and DETY for each event in the final _common_clean file
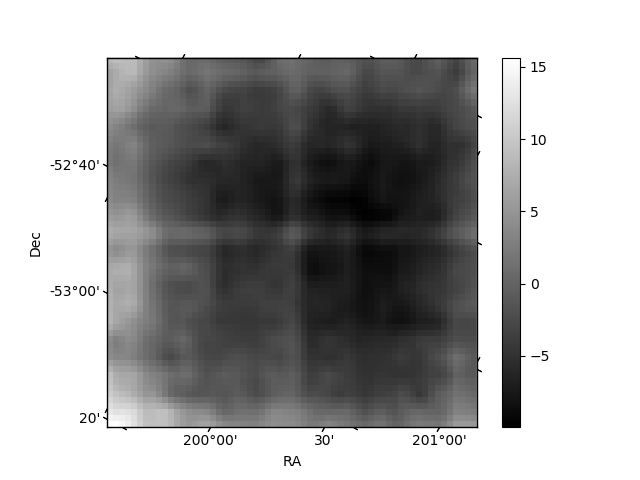
| Quadrant A | 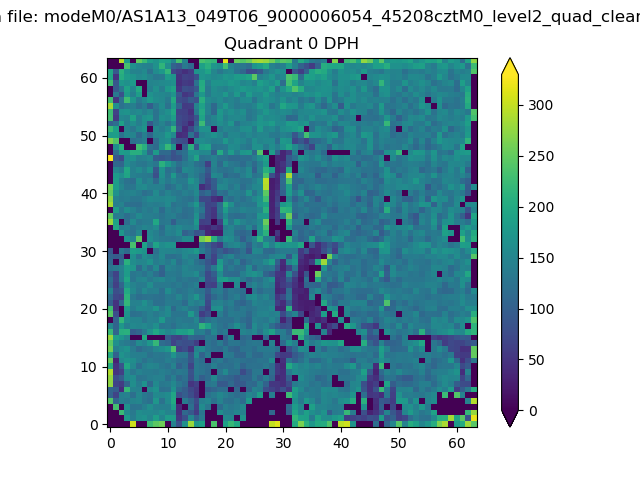 |
 |
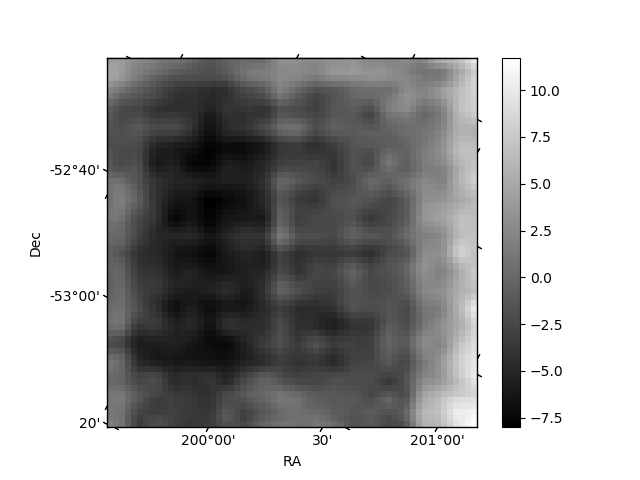
Quadrant B |
|---|---|---|---|
| Quadrant D | 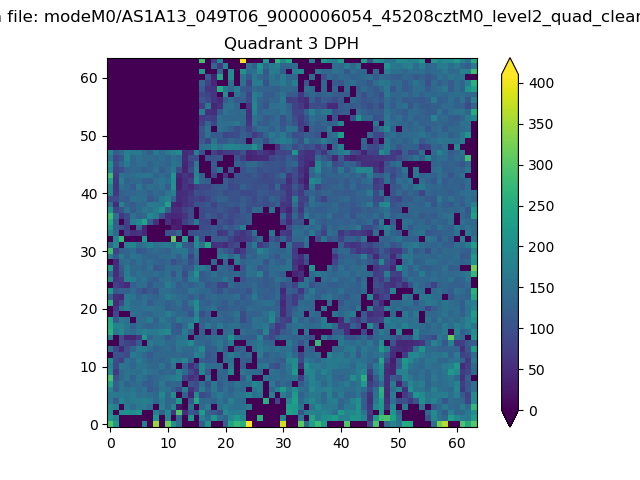 |
 |
Quadrant C |
| Plot type | Count rate plots | Images |
|---|---|---|
| Comparison with Poisson distribution Blue bars denote a histogram of data divided into 1 sec bins. Red curve is a Poisson curve with rate = median count rate of data. |
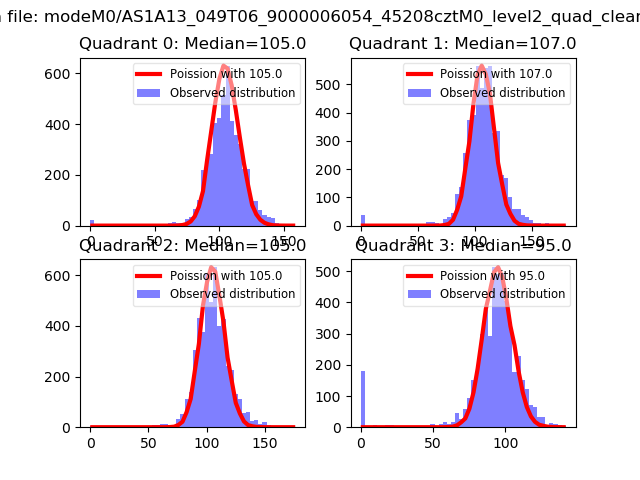 |
 |
| Quadrant-wise count rates Data is divided into 100 sec bins |
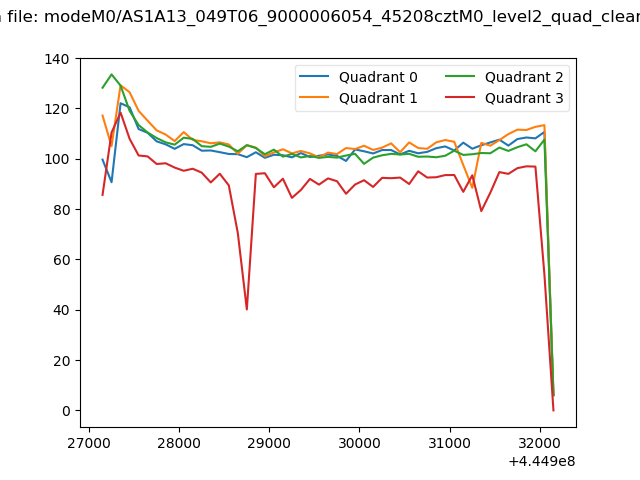 |
|
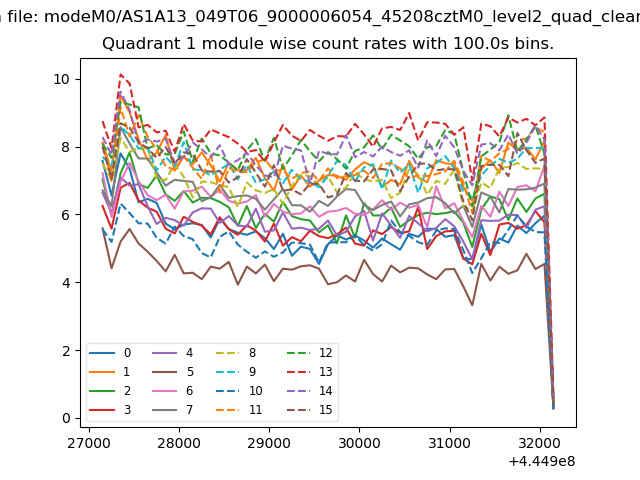
| Module-wise count rates for Quadrant A Data is divided into 100 sec bins |
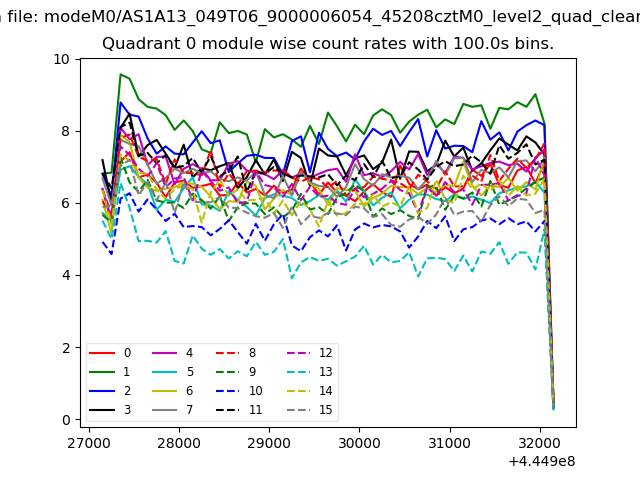 |
 |
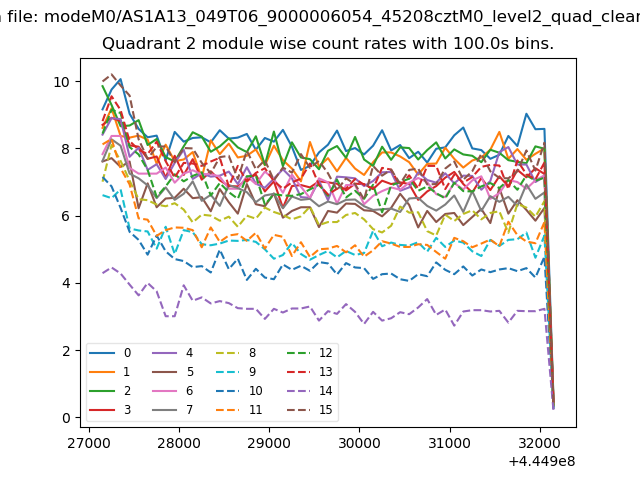
| Module-wise count rates for Quadrant B Data is divided into 100 sec bins |
 |
 |
| Module-wise count rates for Quadrant C Data is divided into 100 sec bins |
 |
 |
| Module-wise count rates for Quadrant D Data is divided into 100 sec bins |
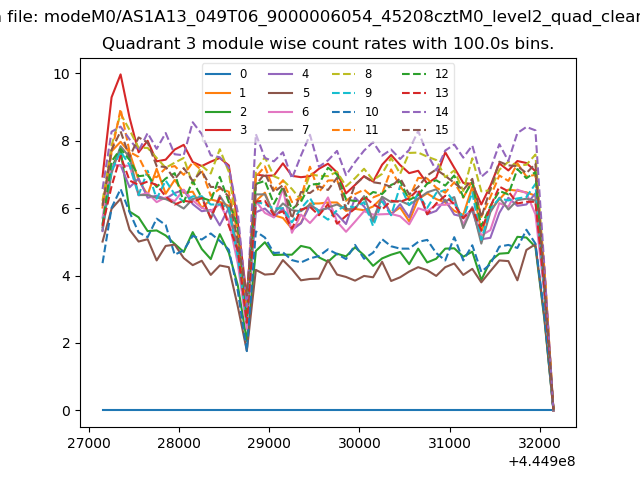 |
 |
| Parameter | Plot |
|---|---|
| CZT HV Monitor | 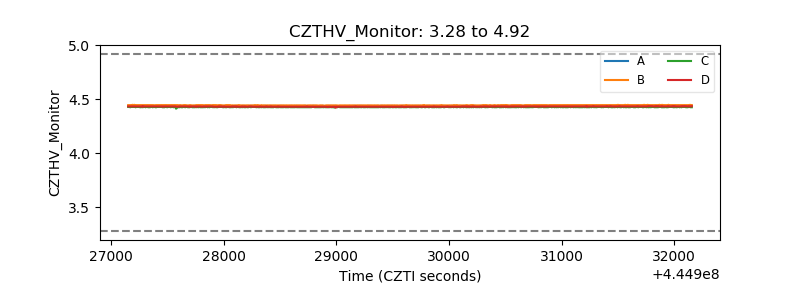 |
| D_VDD | 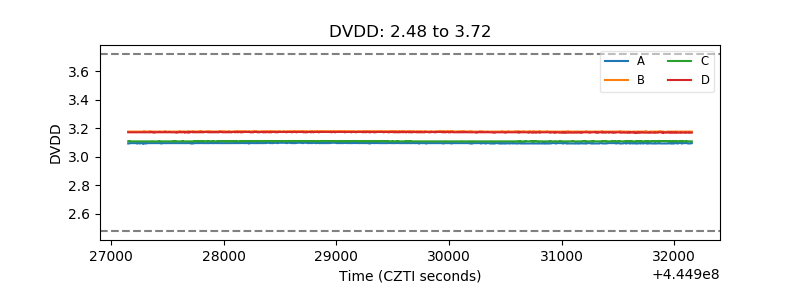 |
| Temperature 1 | 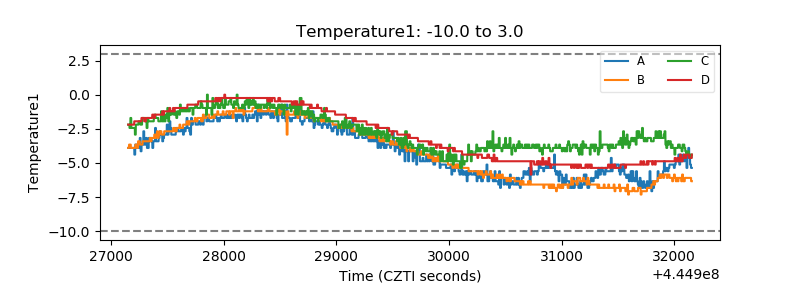 |
| Veto HV Monitor | 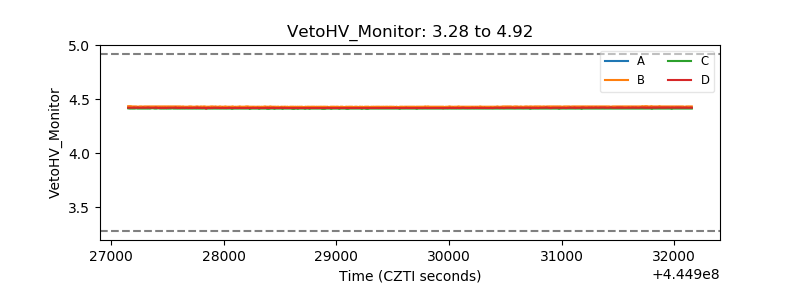 |
| Veto LLD | 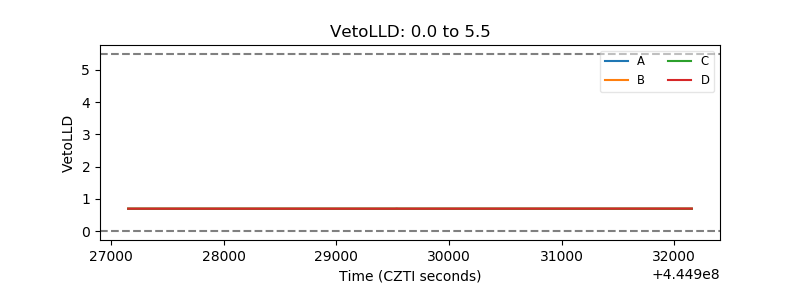 |
| Alpha Counter | 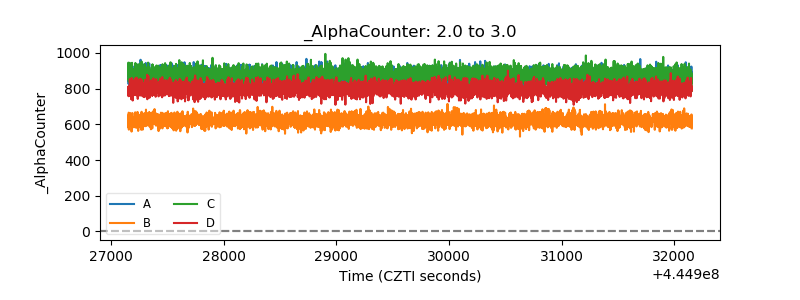 |
| _CPM_Rate | 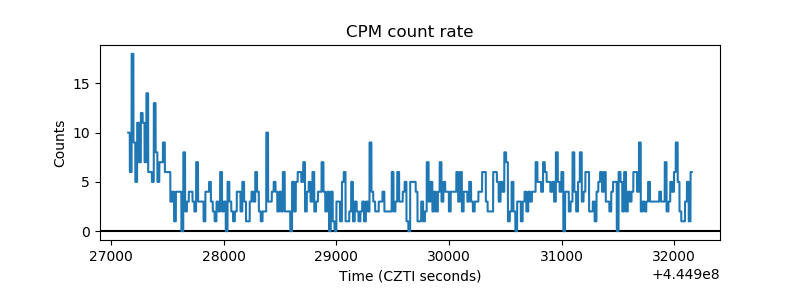 |
| CZT Counter | 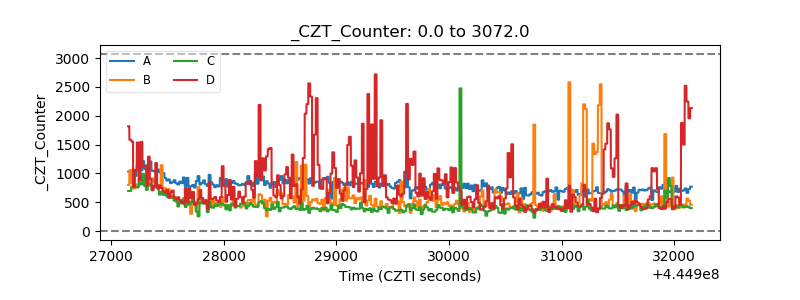 |
| +2.5 Volts monitor | 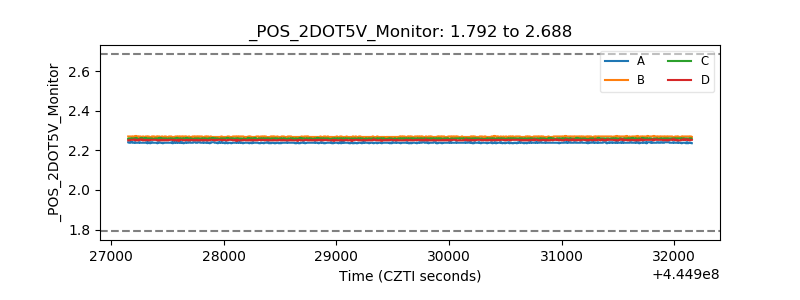 |
| +5 Volts monitor | 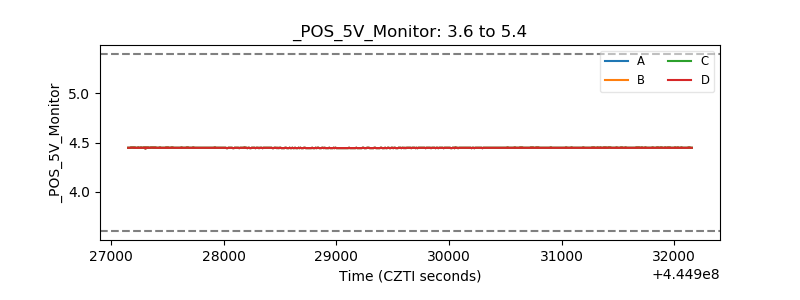 |
| _ROLL_ROT | 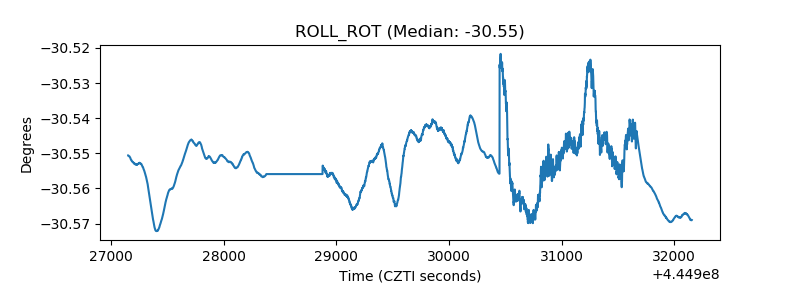 |
| _Roll_DEC | 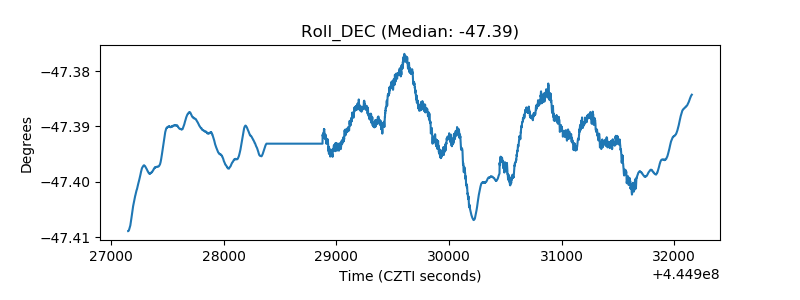 |
| _Roll_RA | 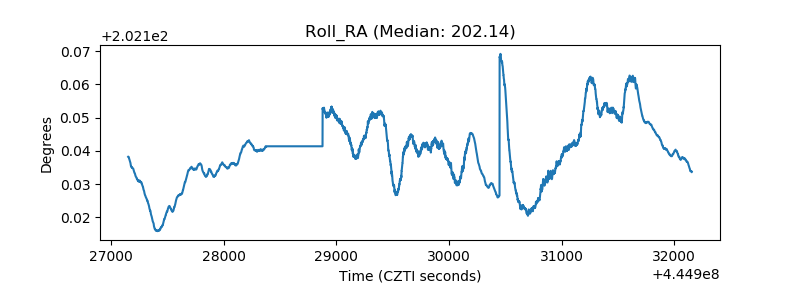 |
| Veto Counter | 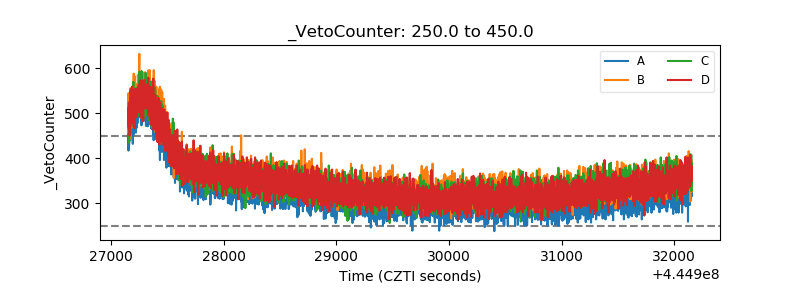 |