| Param | Original file | Final file |
|---|---|---|
| Filename | modeM0/AS1A13_049T06_9000006054_45210cztM0_level2.fits | modeM0/AS1A13_049T06_9000006054_45210cztM0_level2_quad_clean.evt |
| Size (bytes) | 1,666,350,720 | 371,419,200 |
| Size | 1.6 GB | 354.2 MB |
| Events in quadrant A | 18,756,799 | 2,463,803 |
| Events in quadrant B | 12,021,675 | 2,551,512 |
| Events in quadrant C | 10,658,092 | 2,480,515 |
| Events in quadrant D | 18,422,519 | 2,125,696 |
| Mode M0 | |||
|---|---|---|---|
| Quadrant | BADHDUFLAG | Total packets | Discarded packets |
| A | 0 | 74158 | 4 |
| B | 0 | 51715 | 4 |
| C | 0 | 48816 | 4 |
| D | 0 | 71634 | 4 |
| Mode M9 | |||
|---|---|---|---|
| Quadrant | BADHDUFLAG | Total packets | Discarded packets |
| A | 0 | 29 | 0 |
| B | 0 | 29 | 0 |
| C | 0 | 29 | 0 |
| D | 0 | 29 | 0 |
| Mode SS | |||
|---|---|---|---|
| Quadrant | BADHDUFLAG | Total packets | Discarded packets |
| A | 0 | 482 | 0 |
| B | 0 | 482 | 0 |
| C | 0 | 482 | 0 |
| D | 0 | 482 | 0 |
| Quadrant | Total seconds | Saturated seconds | Saturation percentage |
|---|---|---|---|
| A | 23599 | 739 | 3.131489% |
| B | 23599 | 562 | 2.381457% |
| C | 23599 | 195 | 0.826306% |
| D | 23599 | 1982 | 8.398661% |
Noise dominated data is calculated using 1-second bins in cleaned event files. If a bin has >2000 counts, and if more than 50% of those come from <1% of pixels, then it is considered to be noise-dominated and hence unusable.
| Quadrant | # 1 sec bins | Bins with >0 counts | Bins with >2000 counts | High rate bins dominated by noise | Noise dominated (total time) | Noise dominated (detector-on time) | Marked lightcurve |
|---|---|---|---|---|---|---|---|
| A | 25884 | 23601 | 76 | 76 | 0.29% | 0.32% | 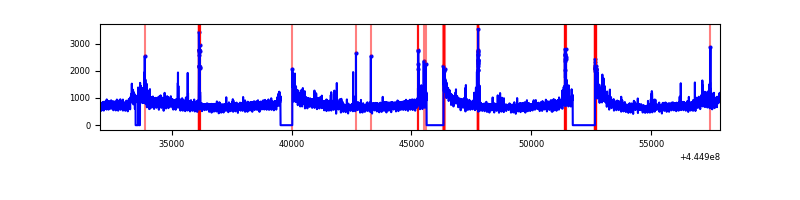 |
| B | 25884 | 23601 | 107 | 107 | 0.41% | 0.45% | 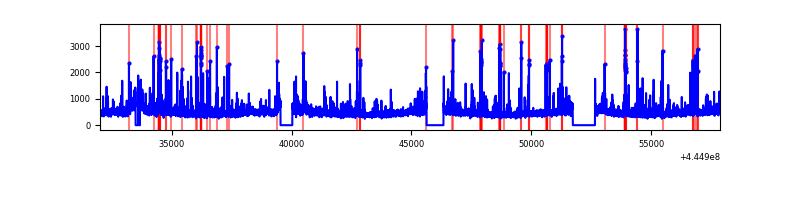 |
| C | 25884 | 23602 | 19 | 19 | 0.07% | 0.08% | 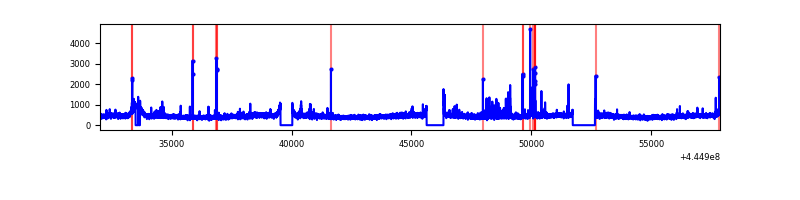 |
| D | 25884 | 23602 | 1552 | 1552 | 6.00% | 6.58% | 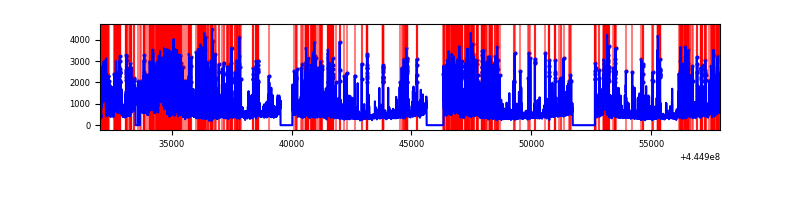 |
Top three noisy pixels from each quadrant. If the there are fewer than three noisy pixels in the level2.evt file, extra rows are filled as -1
| Pixel properties | Quadrant properties | ||||||
|---|---|---|---|---|---|---|---|
| Quadrant | DetID | PixID | Counts | Sigma | Mean | Median | Sigma |
| A | 10 | 83 | 8188696 | 15144.06 | 2626 | 2568 | 540.6 |
| A | 15 | 174 | 154756 | 281.54 | 2626 | 2568 | 540.6 |
| A | 0 | 243 | 92365 | 166.12 | 2626 | 2568 | 540.6 |
| B | 3 | 112 | 599308 | 1172.31 | 2621 | 2531 | 509.1 |
| B | 5 | 32 | 240489 | 467.44 | 2621 | 2531 | 509.1 |
| B | 5 | 172 | 179219 | 347.08 | 2621 | 2531 | 509.1 |
| C | 12 | 2 | 277766 | 451.65 | 2609 | 2623 | 609.2 |
| C | 3 | 233 | 128071 | 205.93 | 2609 | 2623 | 609.2 |
| C | 1 | 3 | 48581 | 75.44 | 2609 | 2623 | 609.2 |
| D | 13 | 249 | 2412461 | 3787.47 | 2526 | 2445 | 636.3 |
| D | 4 | 221 | 1358248 | 2130.72 | 2526 | 2445 | 636.3 |
| D | 4 | 232 | 815222 | 1277.32 | 2526 | 2445 | 636.3 |
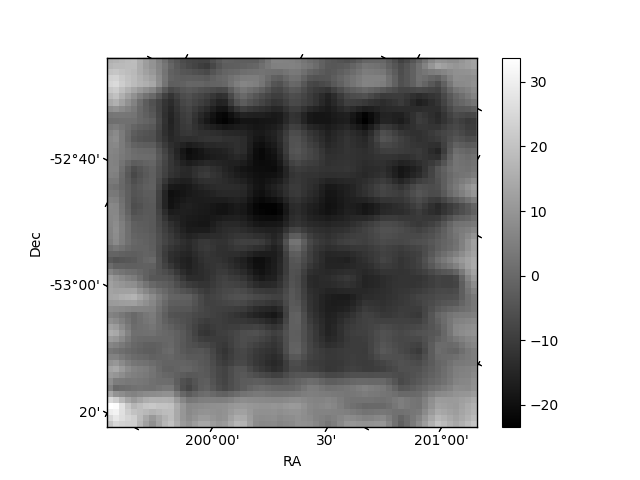
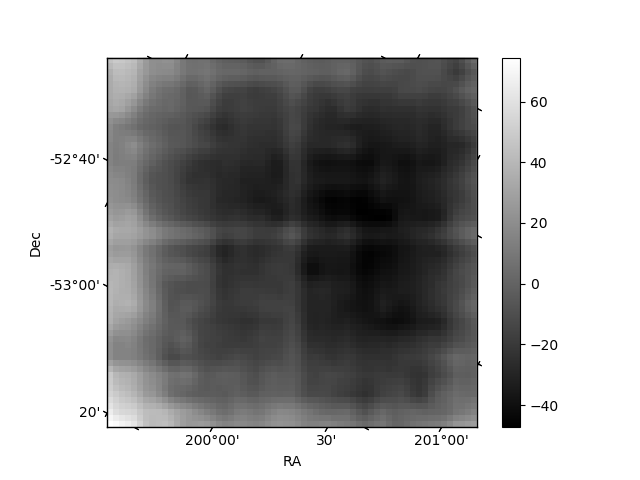
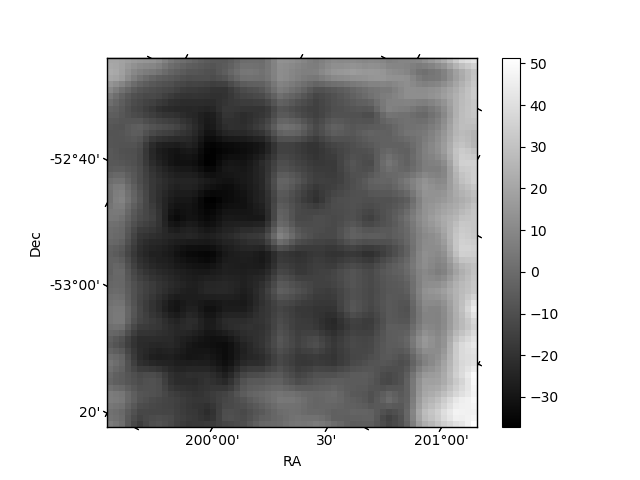
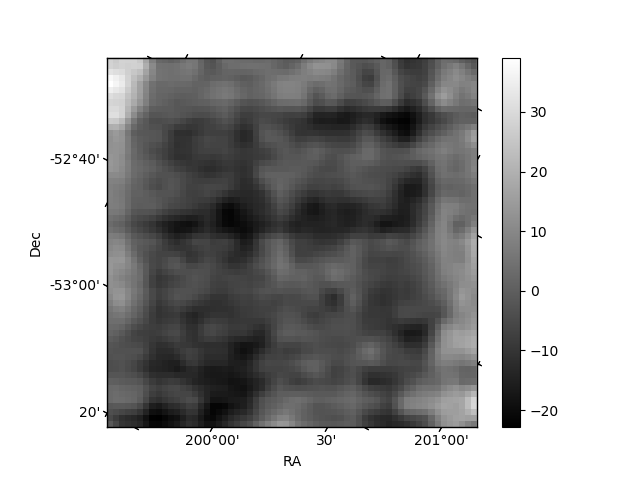
Histogram calculated using DETX and DETY for each event in the final _common_clean file
| Quadrant A | 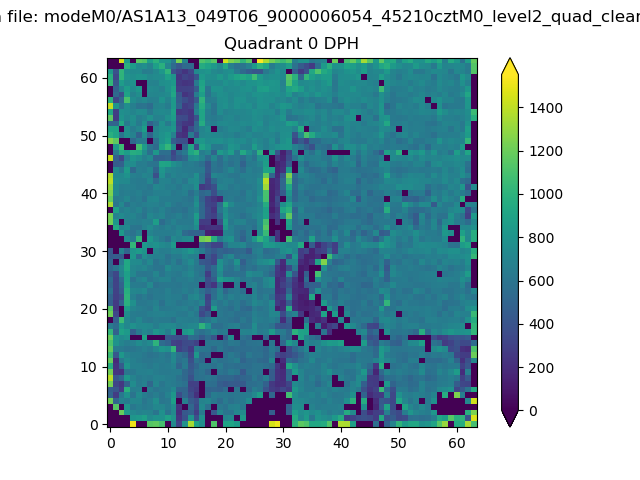 |
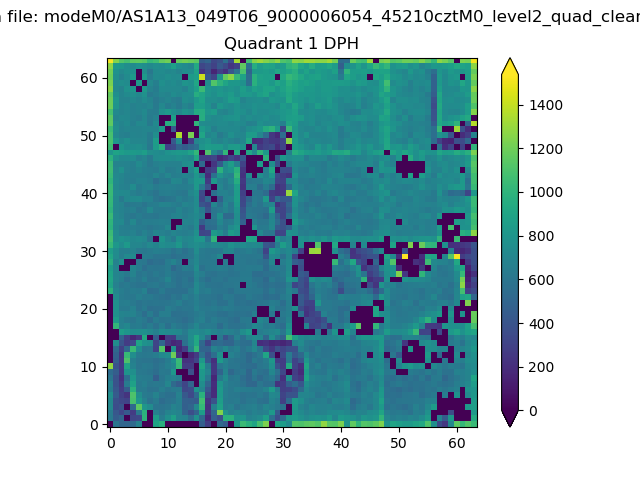 |
Quadrant B |
|---|---|---|---|
| Quadrant D | 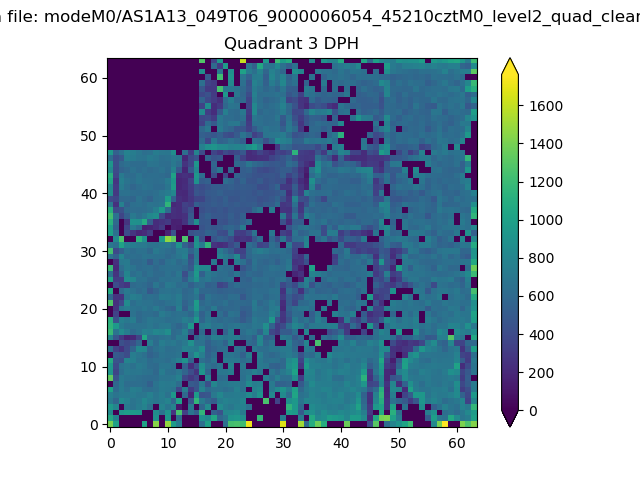 |
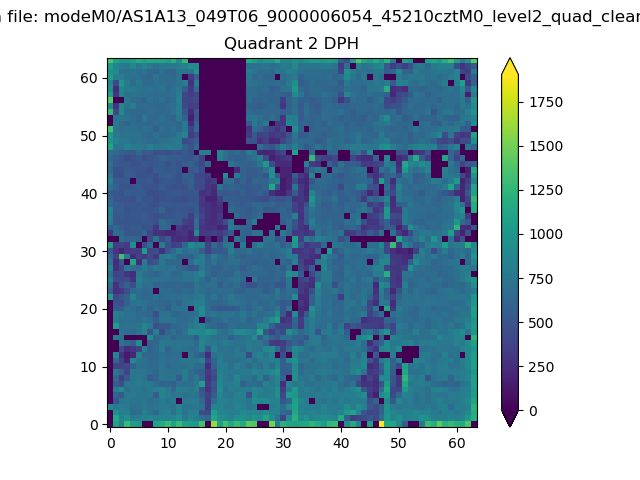 |
Quadrant C |
| Plot type | Count rate plots | Images |
|---|---|---|
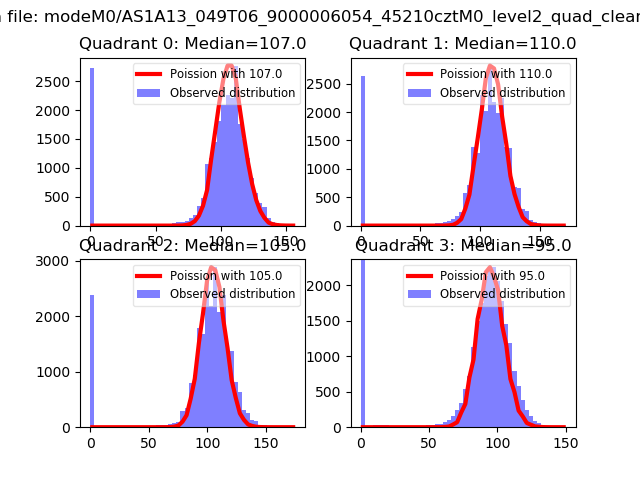
| Comparison with Poisson distribution Blue bars denote a histogram of data divided into 1 sec bins. Red curve is a Poisson curve with rate = median count rate of data. |
 |
 |
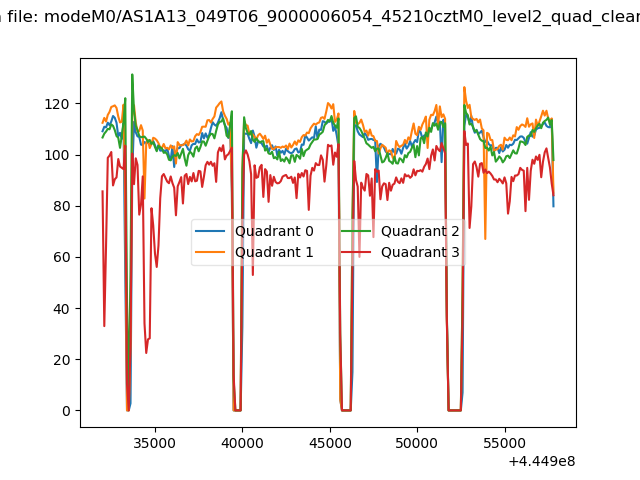
| Quadrant-wise count rates Data is divided into 100 sec bins |
 |
|
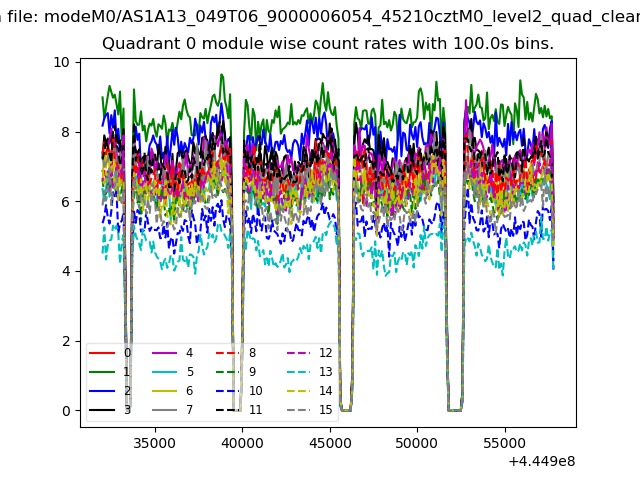
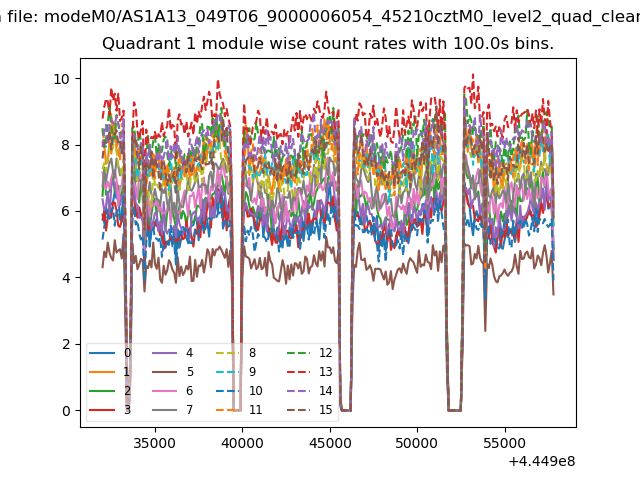
| Module-wise count rates for Quadrant A Data is divided into 100 sec bins |
 |
 |
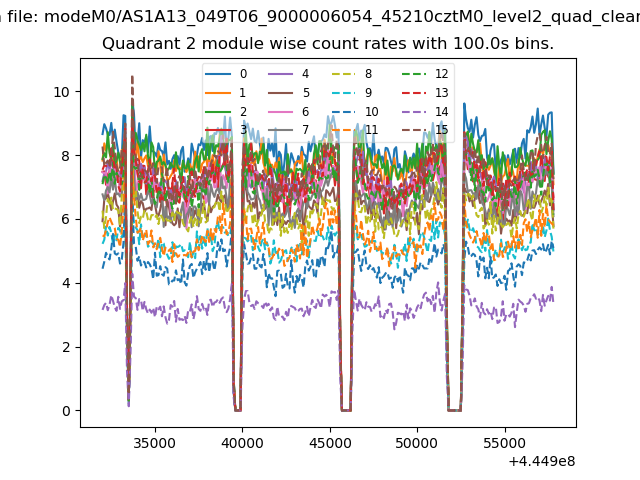
| Module-wise count rates for Quadrant B Data is divided into 100 sec bins |
 |
 |
| Module-wise count rates for Quadrant C Data is divided into 100 sec bins |
 |
 |
| Module-wise count rates for Quadrant D Data is divided into 100 sec bins |
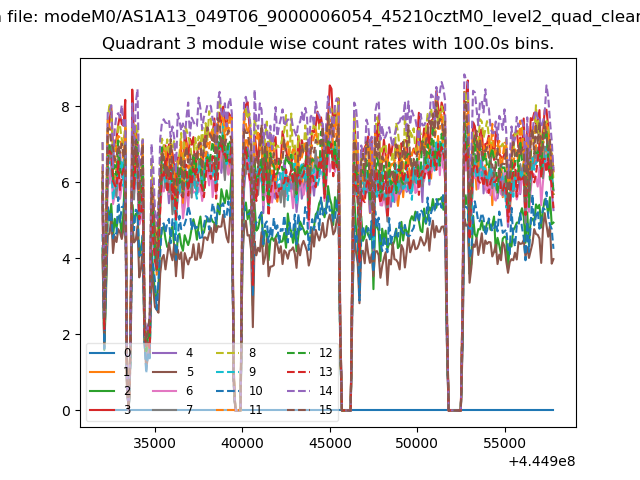 |
 |
| Parameter | Plot |
|---|---|
| CZT HV Monitor | 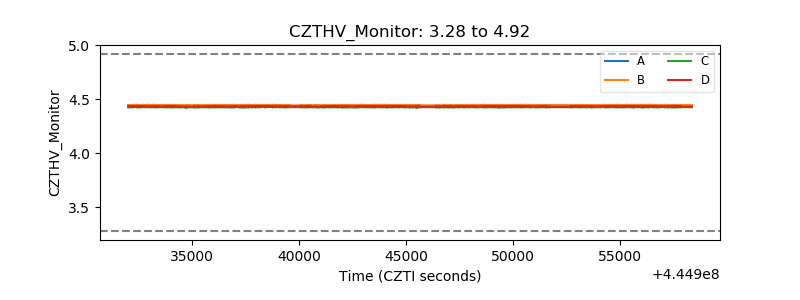 |
| D_VDD | 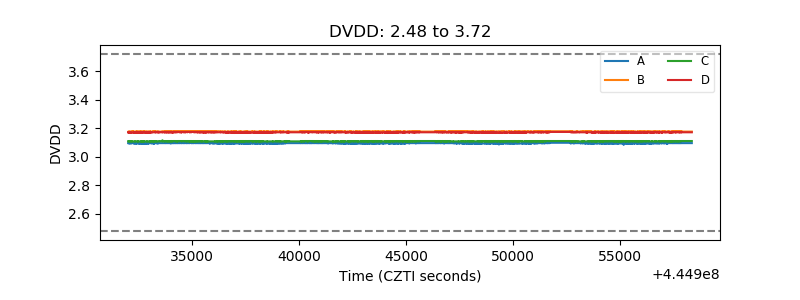 |
| Temperature 1 | 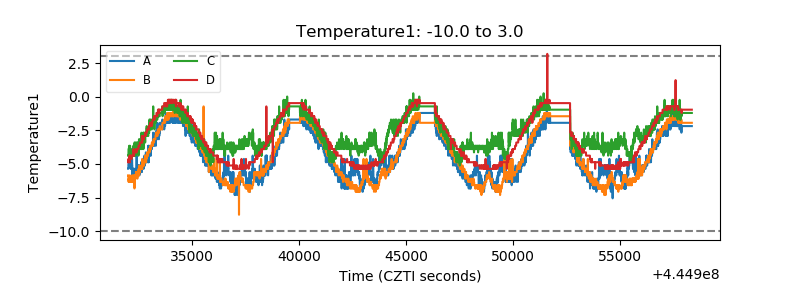 |
| Veto HV Monitor | 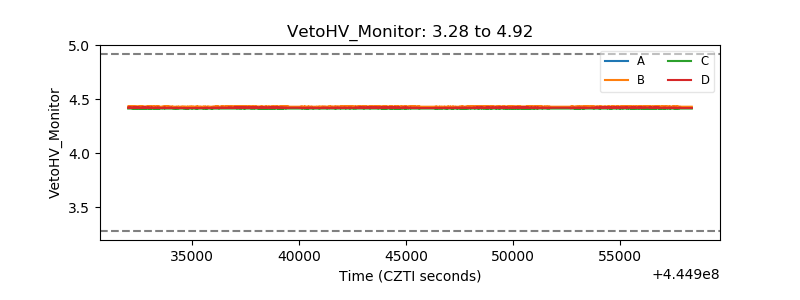 |
| Veto LLD | 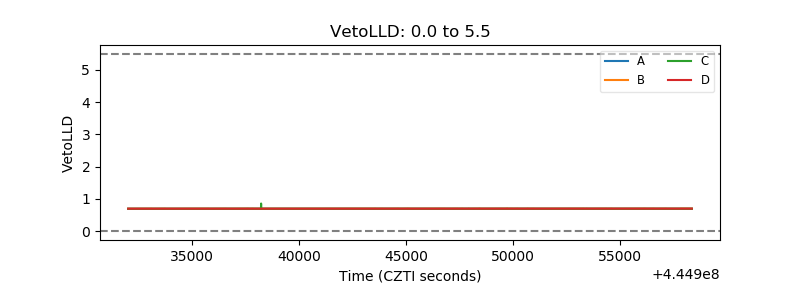 |
| Alpha Counter | 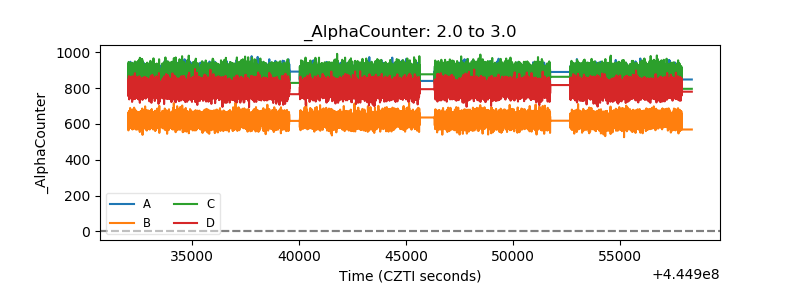 |
| _CPM_Rate | 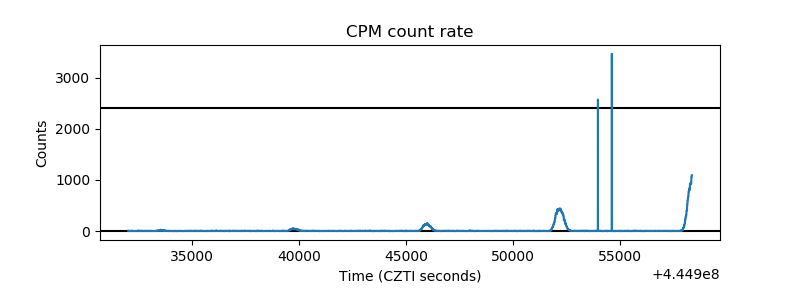 |
| CZT Counter | 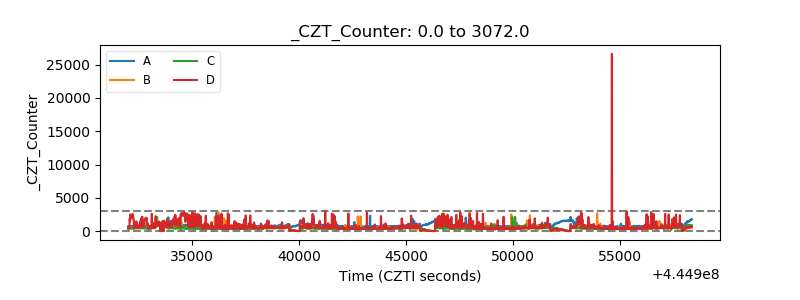 |
| +2.5 Volts monitor | 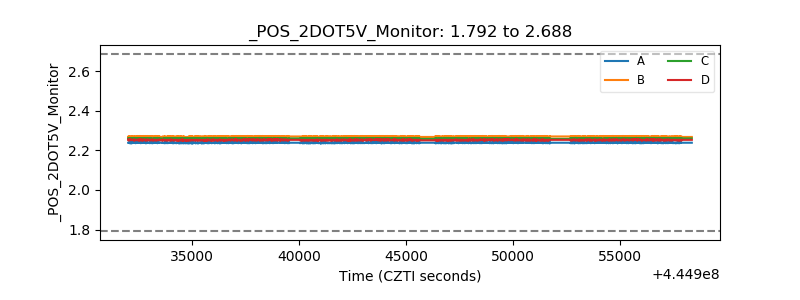 |
| +5 Volts monitor | 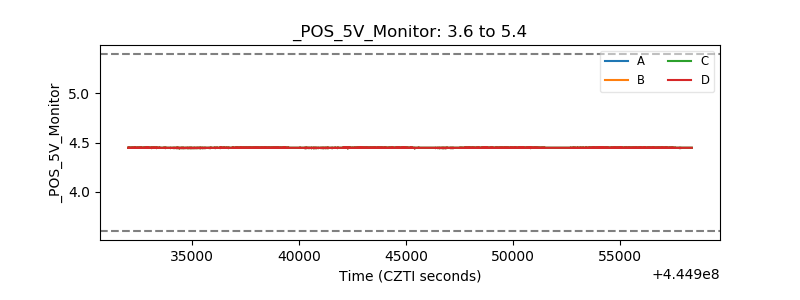 |
| _ROLL_ROT | 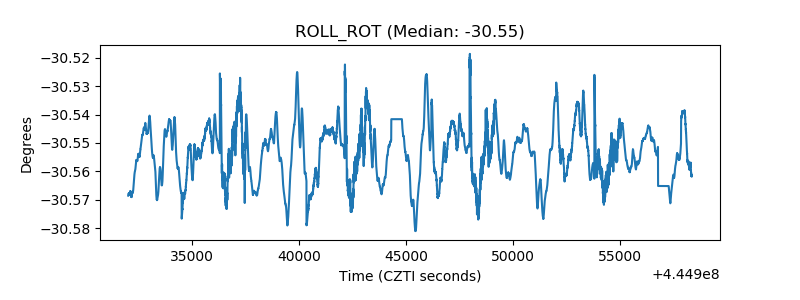 |
| _Roll_DEC | 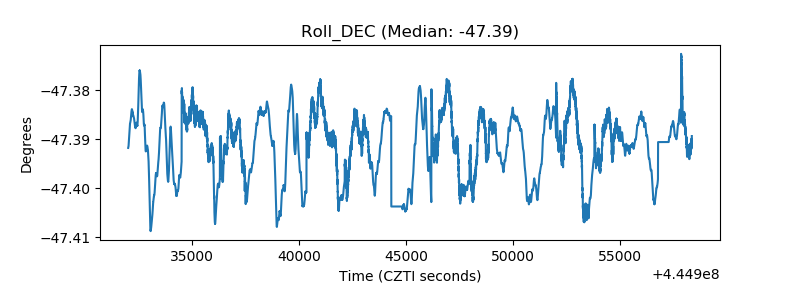 |
| _Roll_RA | 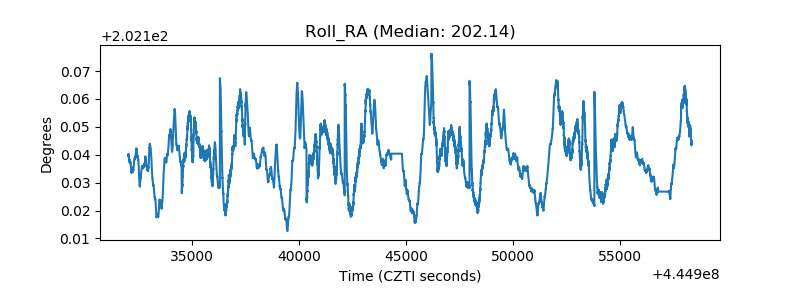 |
| Veto Counter | 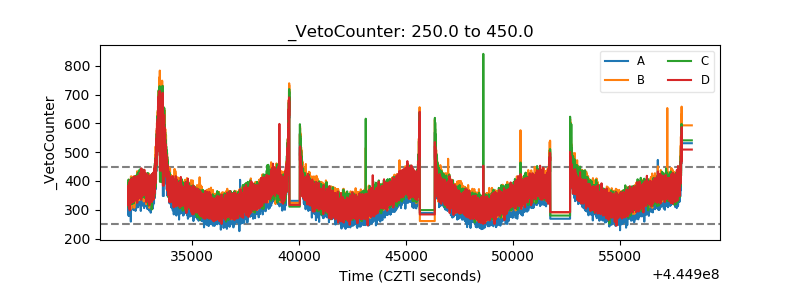 |