| Param | Original file | Final file |
|---|---|---|
| Filename | modeM0/AS1A13_049T06_9000006054_45211cztM0_level2.fits | modeM0/AS1A13_049T06_9000006054_45211cztM0_level2_quad_clean.evt |
| Size (bytes) | 531,031,680 | 125,248,320 |
| Size | 506.4 MB | 119.4 MB |
| Events in quadrant A | 6,101,725 | 828,722 |
| Events in quadrant B | 3,926,527 | 866,007 |
| Events in quadrant C | 3,665,036 | 844,634 |
| Events in quadrant D | 5,387,954 | 736,166 |
| Mode M0 | |||
|---|---|---|---|
| Quadrant | BADHDUFLAG | Total packets | Discarded packets |
| A | 0 | 23900 | 2 |
| B | 0 | 16611 | 2 |
| C | 0 | 16039 | 2 |
| D | 0 | 21289 | 2 |
| Mode M9 | |||
|---|---|---|---|
| Quadrant | BADHDUFLAG | Total packets | Discarded packets |
| A | 0 | 21 | 0 |
| B | 0 | 21 | 0 |
| C | 0 | 21 | 0 |
| D | 0 | 21 | 0 |
| Mode SS | |||
|---|---|---|---|
| Quadrant | BADHDUFLAG | Total packets | Discarded packets |
| A | 0 | 154 | 0 |
| B | 0 | 154 | 0 |
| C | 0 | 154 | 0 |
| D | 0 | 154 | 0 |
| Quadrant | Total seconds | Saturated seconds | Saturation percentage |
|---|---|---|---|
| A | 7423 | 171 | 2.303651% |
| B | 7423 | 152 | 2.047690% |
| C | 7424 | 48 | 0.646552% |
| D | 7424 | 384 | 5.172414% |
Noise dominated data is calculated using 1-second bins in cleaned event files. If a bin has >2000 counts, and if more than 50% of those come from <1% of pixels, then it is considered to be noise-dominated and hence unusable.
| Quadrant | # 1 sec bins | Bins with >0 counts | Bins with >2000 counts | High rate bins dominated by noise | Noise dominated (total time) | Noise dominated (detector-on time) | Marked lightcurve |
|---|---|---|---|---|---|---|---|
| A | 9588 | 7425 | 15 | 15 | 0.16% | 0.20% | 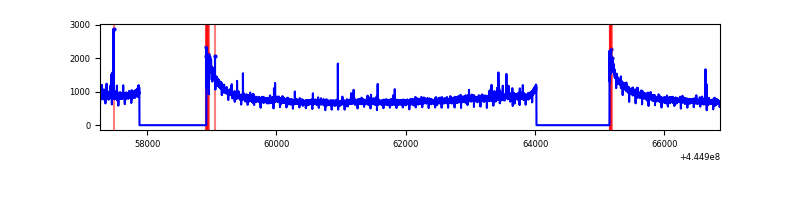 |
| B | 9588 | 7424 | 62 | 62 | 0.65% | 0.84% | 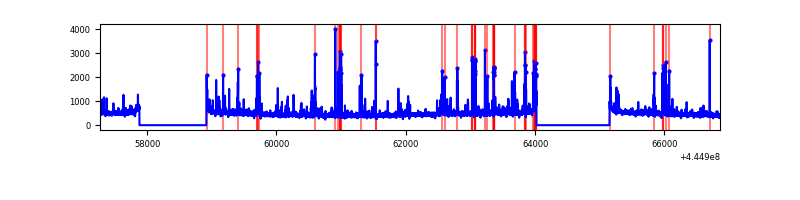 |
| C | 9589 | 7426 | 29 | 29 | 0.30% | 0.39% | 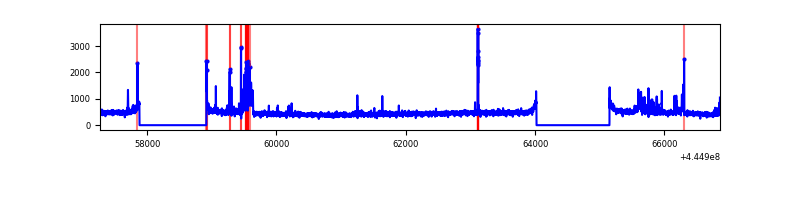 |
| D | 9589 | 7426 | 315 | 315 | 3.29% | 4.24% | 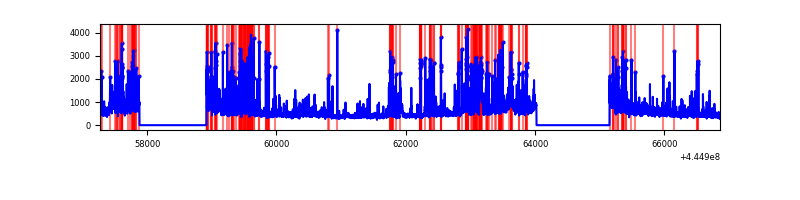 |
Top three noisy pixels from each quadrant. If the there are fewer than three noisy pixels in the level2.evt file, extra rows are filled as -1
| Pixel properties | Quadrant properties | ||||||
|---|---|---|---|---|---|---|---|
| Quadrant | DetID | PixID | Counts | Sigma | Mean | Median | Sigma |
| A | 10 | 83 | 2757094 | 15832.67 | 844 | 826 | 174.1 |
| A | 13 | 248 | 36142 | 202.86 | 844 | 826 | 174.1 |
| A | 0 | 243 | 25412 | 141.23 | 844 | 826 | 174.1 |
| B | 3 | 112 | 210422 | 1263.0 | 851 | 826 | 166.0 |
| B | 5 | 172 | 103445 | 618.37 | 851 | 826 | 166.0 |
| B | 10 | 3 | 94810 | 566.33 | 851 | 826 | 166.0 |
| C | 1 | 3 | 127286 | 635.08 | 848 | 853 | 199.1 |
| C | 12 | 2 | 88482 | 440.16 | 848 | 853 | 199.1 |
| C | 1 | 241 | 63247 | 313.4 | 848 | 853 | 199.1 |
| D | 13 | 249 | 668181 | 3208.08 | 824 | 800 | 208.0 |
| D | 1 | 47 | 394291 | 1891.5 | 824 | 800 | 208.0 |
| D | 7 | 96 | 234161 | 1121.76 | 824 | 800 | 208.0 |
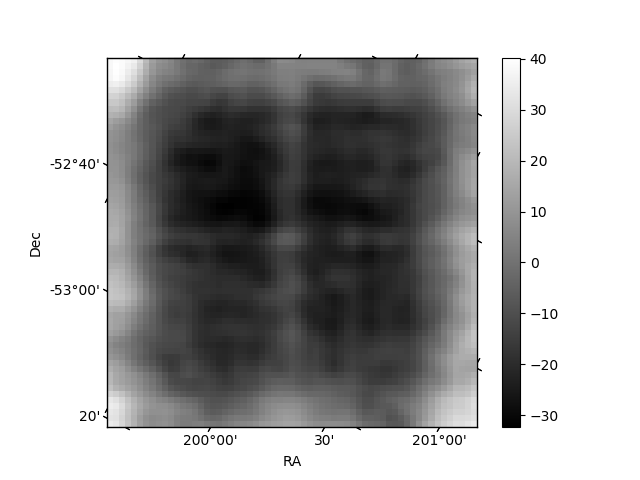
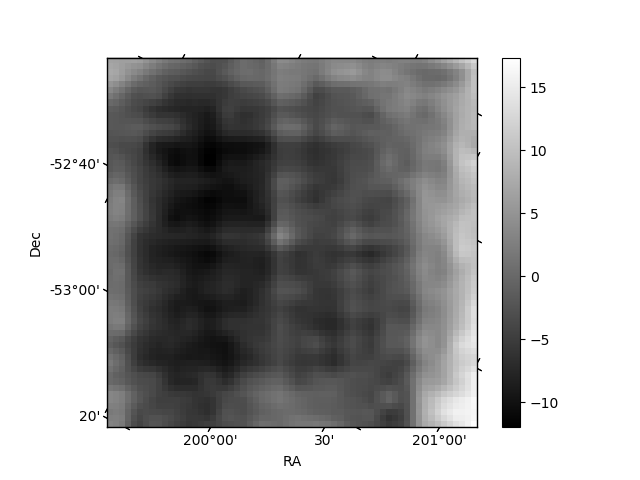
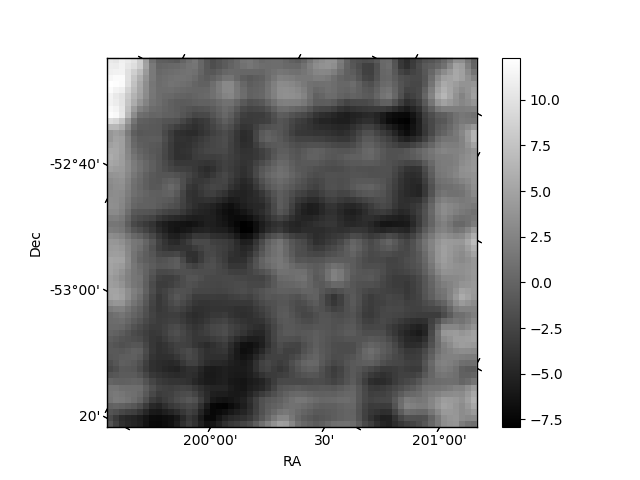
Histogram calculated using DETX and DETY for each event in the final _common_clean file
| Quadrant A | 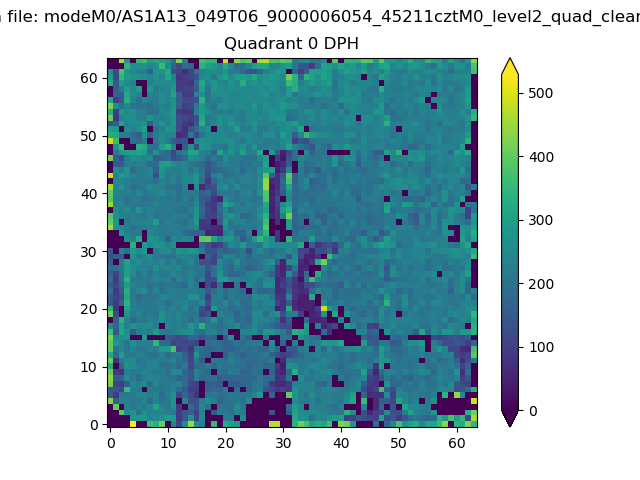 |
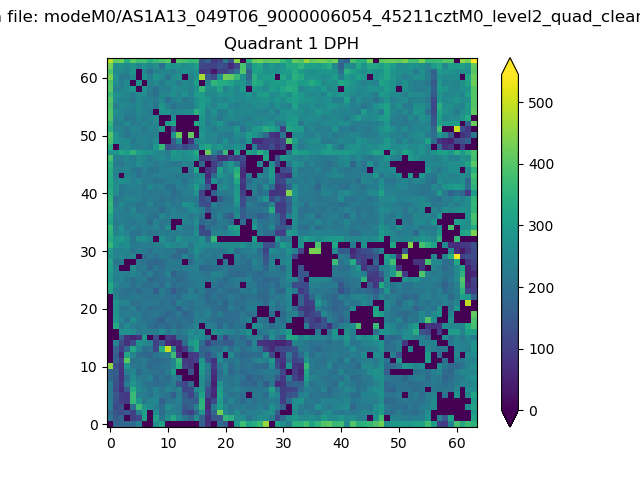 |
Quadrant B |
|---|---|---|---|
| Quadrant D | 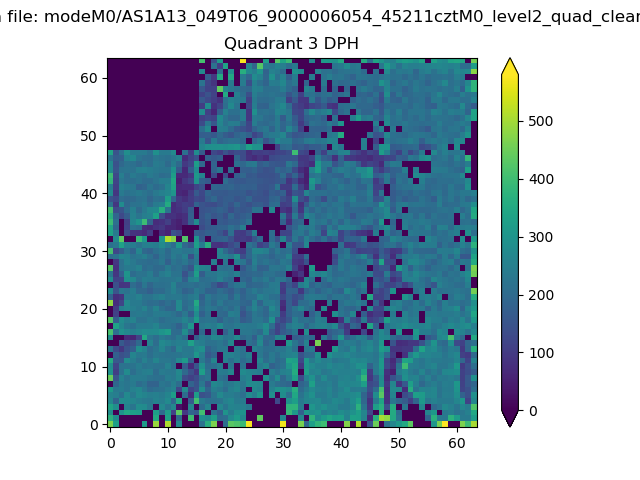 |
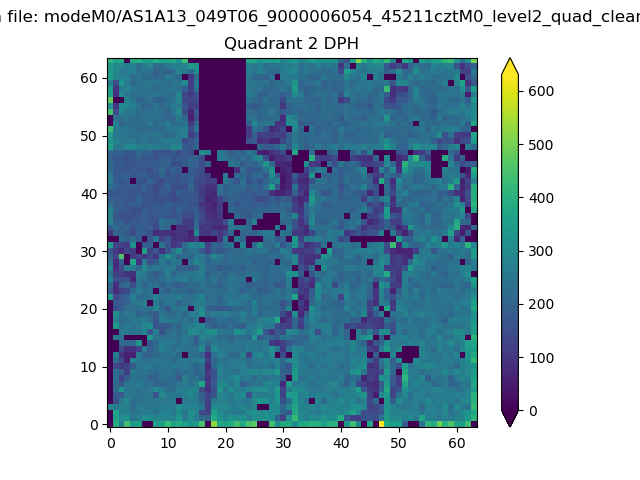 |
Quadrant C |
| Plot type | Count rate plots | Images |
|---|---|---|
| Comparison with Poisson distribution Blue bars denote a histogram of data divided into 1 sec bins. Red curve is a Poisson curve with rate = median count rate of data. |
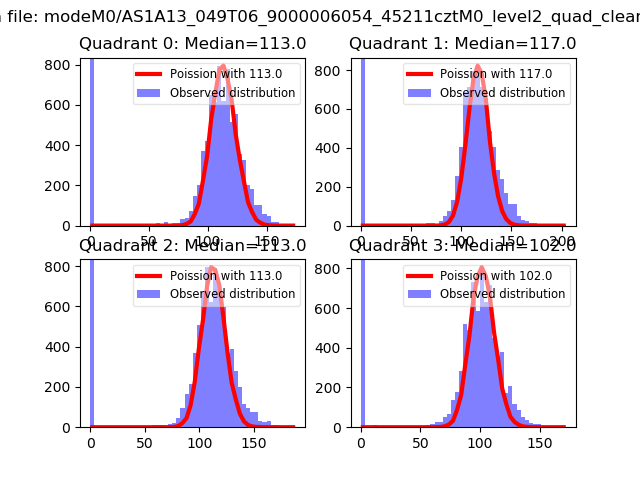 |
 |
| Quadrant-wise count rates Data is divided into 100 sec bins |
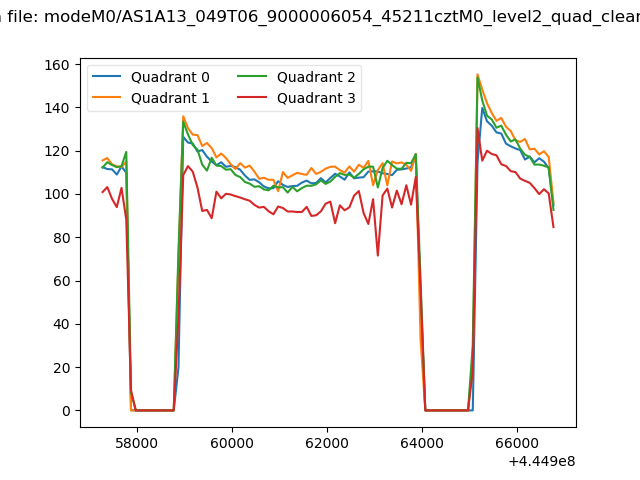 |
|
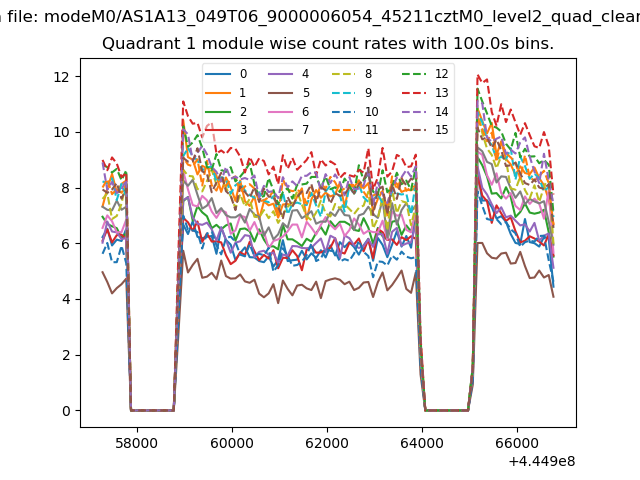
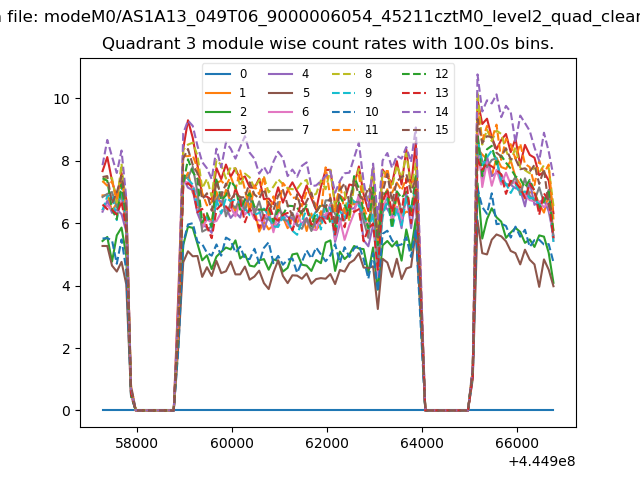
| Module-wise count rates for Quadrant A Data is divided into 100 sec bins |
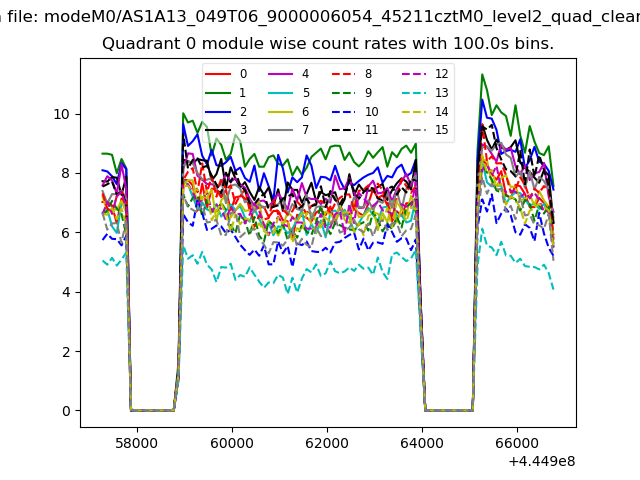 |
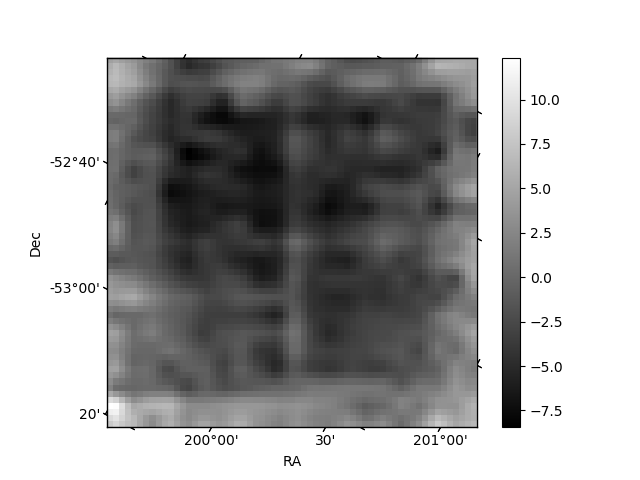 |
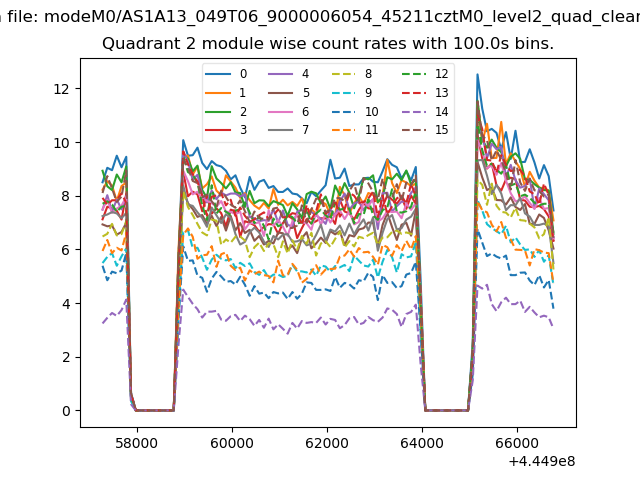
| Module-wise count rates for Quadrant B Data is divided into 100 sec bins |
 |
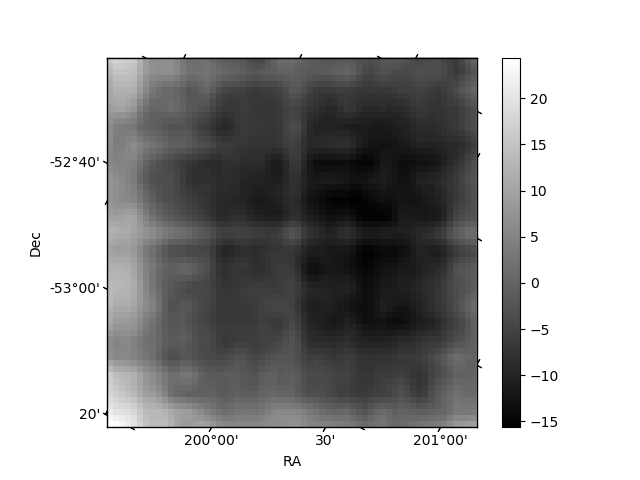 |
| Module-wise count rates for Quadrant C Data is divided into 100 sec bins |
 |
 |
| Module-wise count rates for Quadrant D Data is divided into 100 sec bins |
 |
 |
| Parameter | Plot |
|---|---|
| CZT HV Monitor | 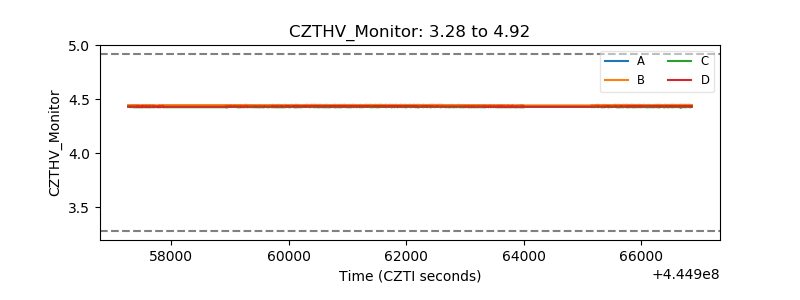 |
| D_VDD | 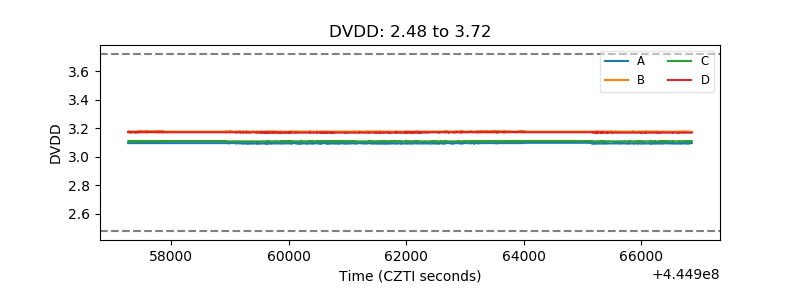 |
| Temperature 1 | 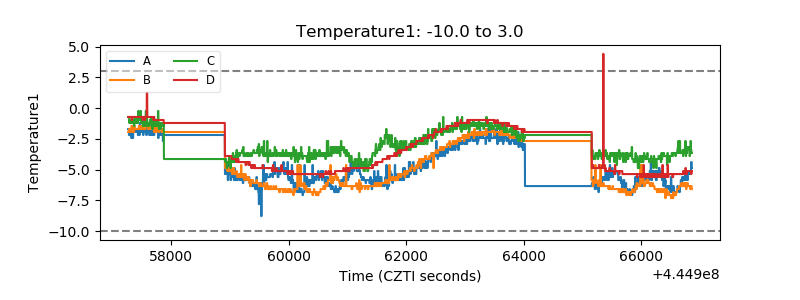 |
| Veto HV Monitor | 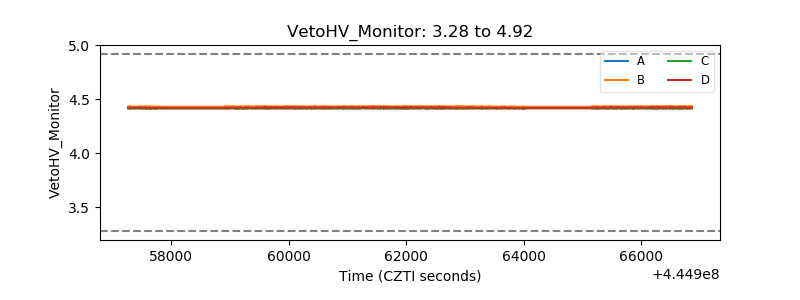 |
| Veto LLD | 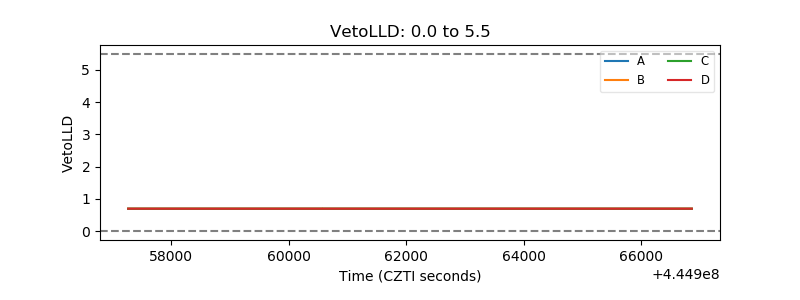 |
| Alpha Counter | 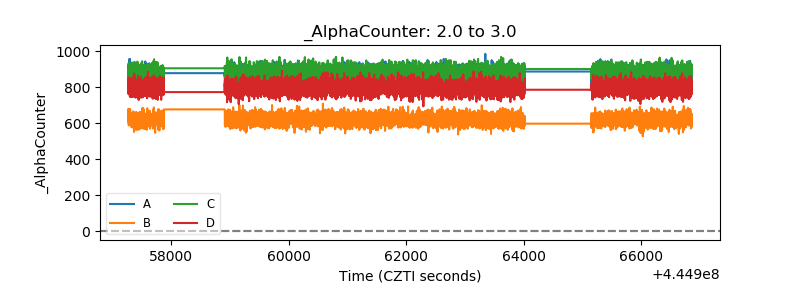 |
| _CPM_Rate | 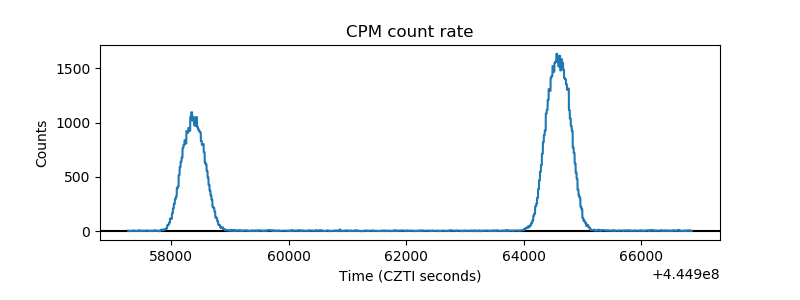 |
| CZT Counter | 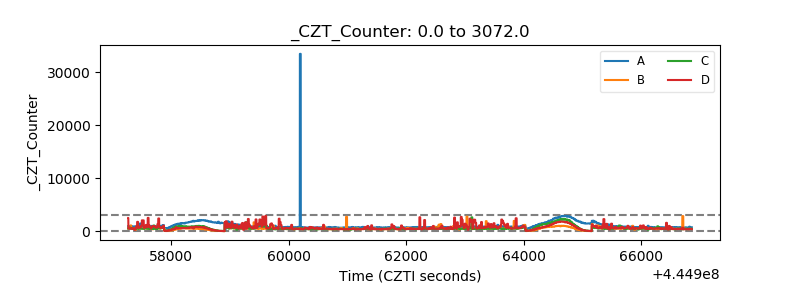 |
| +2.5 Volts monitor | 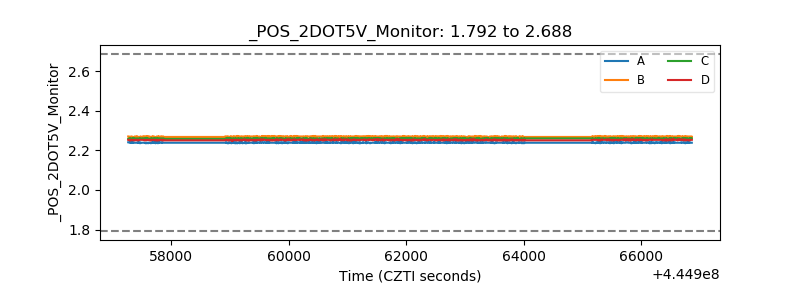 |
| +5 Volts monitor | 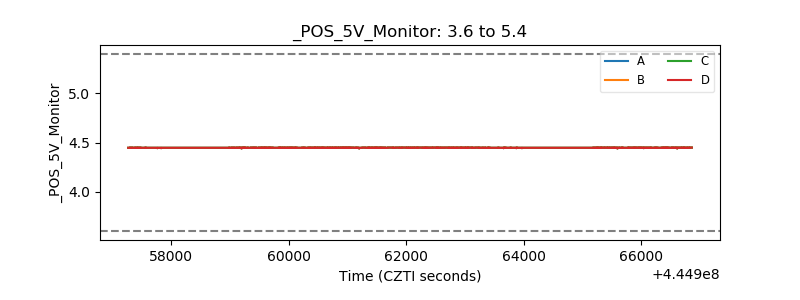 |
| _ROLL_ROT | 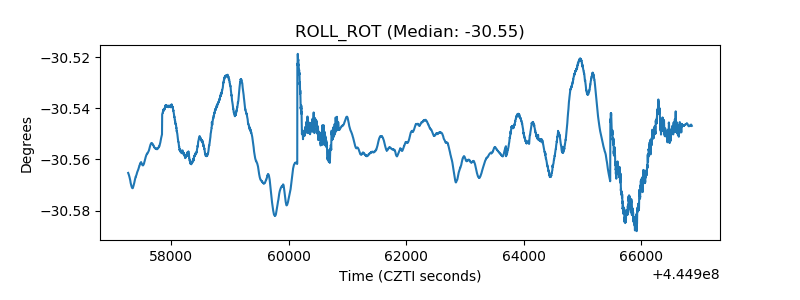 |
| _Roll_DEC | 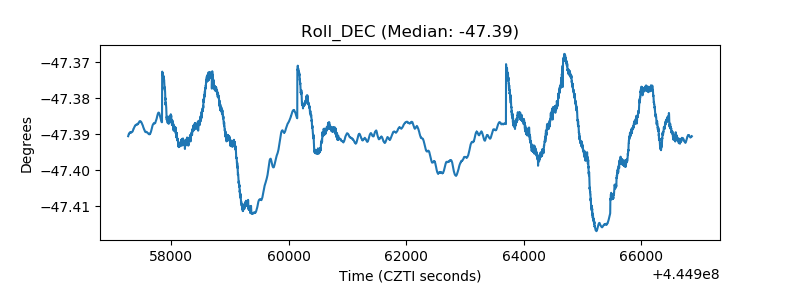 |
| _Roll_RA | 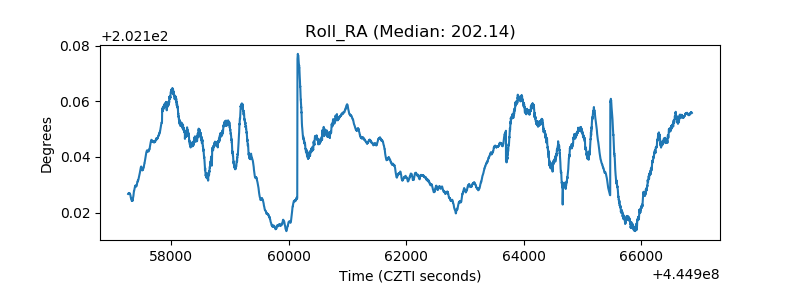 |
| Veto Counter | 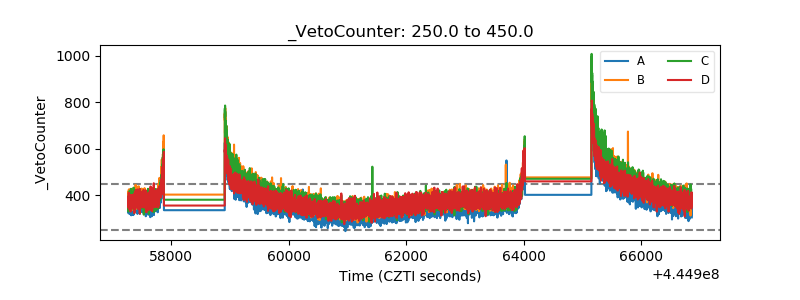 |