| Param | Original file | Final file |
|---|---|---|
| Filename | modeM0/AS1A13_049T06_9000006054_45212cztM0_level2.fits | modeM0/AS1A13_049T06_9000006054_45212cztM0_level2_quad_clean.evt |
| Size (bytes) | 430,223,040 | 106,125,120 |
| Size | 410.3 MB | 101.2 MB |
| Events in quadrant A | 4,899,996 | 706,469 |
| Events in quadrant B | 3,495,277 | 732,752 |
| Events in quadrant C | 3,192,893 | 718,552 |
| Events in quadrant D | 3,864,871 | 631,150 |
| Mode M0 | |||
|---|---|---|---|
| Quadrant | BADHDUFLAG | Total packets | Discarded packets |
| A | 0 | 19192 | 1 |
| B | 0 | 14400 | 1 |
| C | 0 | 13478 | 1 |
| D | 0 | 15683 | 1 |
| Mode M9 | |||
|---|---|---|---|
| Quadrant | BADHDUFLAG | Total packets | Discarded packets |
| A | 0 | 12 | 0 |
| B | 0 | 12 | 0 |
| C | 0 | 12 | 0 |
| D | 0 | 12 | 0 |
| Mode SS | |||
|---|---|---|---|
| Quadrant | BADHDUFLAG | Total packets | Discarded packets |
| A | 0 | 124 | 0 |
| B | 0 | 124 | 0 |
| C | 0 | 124 | 0 |
| D | 0 | 124 | 0 |
| Quadrant | Total seconds | Saturated seconds | Saturation percentage |
|---|---|---|---|
| A | 6081 | 89 | 1.463575% |
| B | 6082 | 178 | 2.926669% |
| C | 6082 | 46 | 0.756330% |
| D | 6082 | 206 | 3.387044% |
Noise dominated data is calculated using 1-second bins in cleaned event files. If a bin has >2000 counts, and if more than 50% of those come from <1% of pixels, then it is considered to be noise-dominated and hence unusable.
| Quadrant | # 1 sec bins | Bins with >0 counts | Bins with >2000 counts | High rate bins dominated by noise | Noise dominated (total time) | Noise dominated (detector-on time) | Marked lightcurve |
|---|---|---|---|---|---|---|---|
| A | 7301 | 6082 | 25 | 25 | 0.34% | 0.41% | 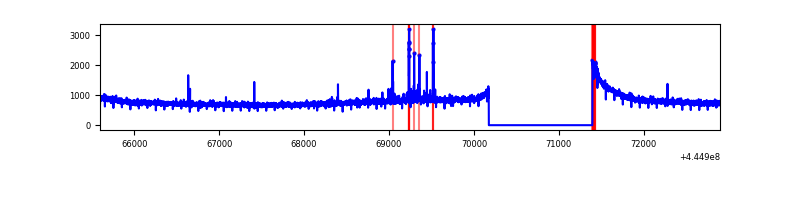 |
| B | 7302 | 6083 | 111 | 111 | 1.52% | 1.82% | 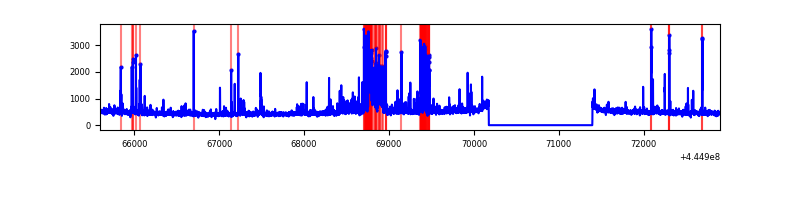 |
| C | 7302 | 6083 | 40 | 40 | 0.55% | 0.66% | 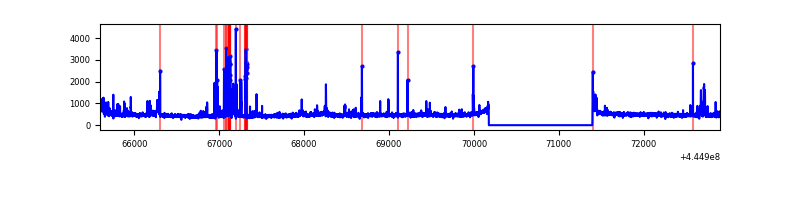 |
| D | 7302 | 6082 | 162 | 162 | 2.22% | 2.66% | 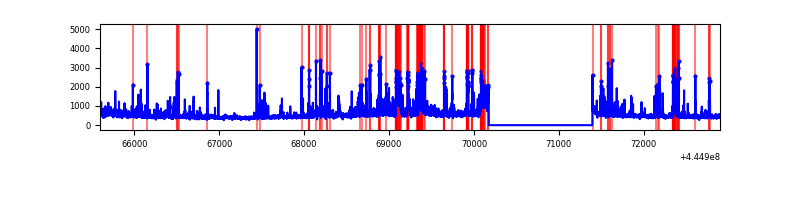 |
Top three noisy pixels from each quadrant. If the there are fewer than three noisy pixels in the level2.evt file, extra rows are filled as -1
| Pixel properties | Quadrant properties | ||||||
|---|---|---|---|---|---|---|---|
| Quadrant | DetID | PixID | Counts | Sigma | Mean | Median | Sigma |
| A | 10 | 83 | 2132568 | 15015.85 | 692 | 676 | 142.0 |
| A | 13 | 248 | 46016 | 319.35 | 692 | 676 | 142.0 |
| A | 0 | 243 | 23458 | 160.46 | 692 | 676 | 142.0 |
| B | 3 | 112 | 323921 | 2391.7 | 698 | 674 | 135.2 |
| B | 5 | 172 | 148719 | 1095.38 | 698 | 674 | 135.2 |
| B | 4 | 171 | 89463 | 656.95 | 698 | 674 | 135.2 |
| C | 12 | 2 | 334276 | 2032.01 | 703 | 708 | 164.2 |
| C | 1 | 241 | 61037 | 367.51 | 703 | 708 | 164.2 |
| C | 3 | 233 | 28684 | 170.42 | 703 | 708 | 164.2 |
| D | 13 | 249 | 417882 | 2431.44 | 687 | 667 | 171.6 |
| D | 5 | 171 | 170914 | 992.16 | 687 | 667 | 171.6 |
| D | 4 | 221 | 138330 | 802.27 | 687 | 667 | 171.6 |
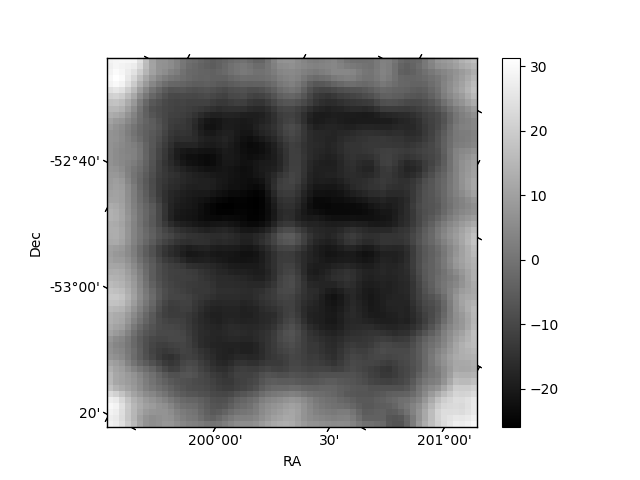
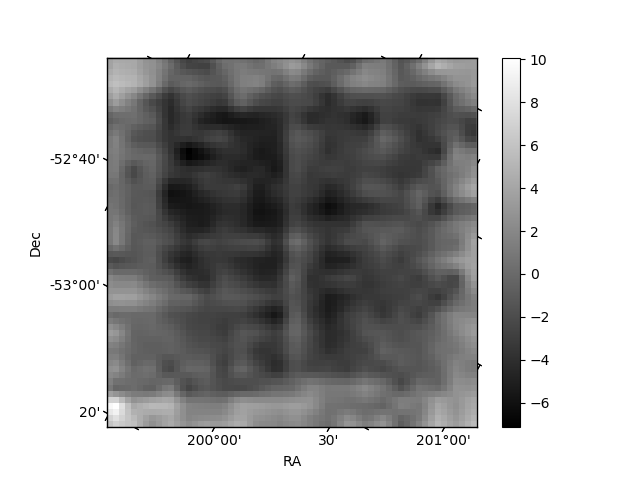
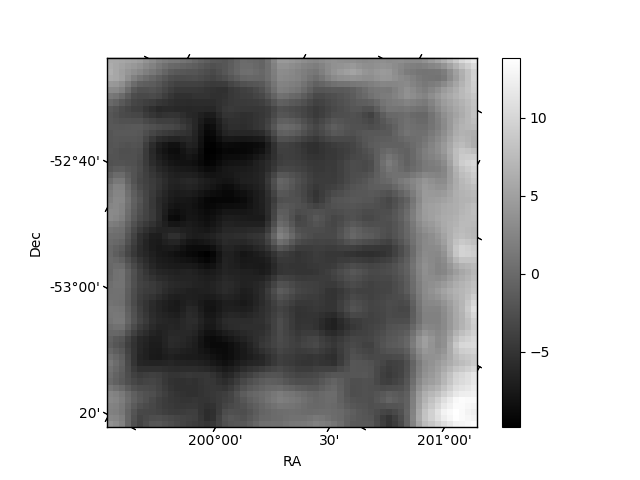
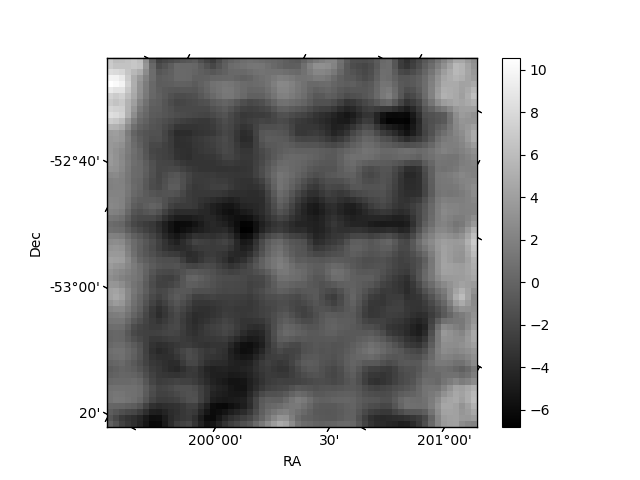
Histogram calculated using DETX and DETY for each event in the final _common_clean file
| Quadrant A | 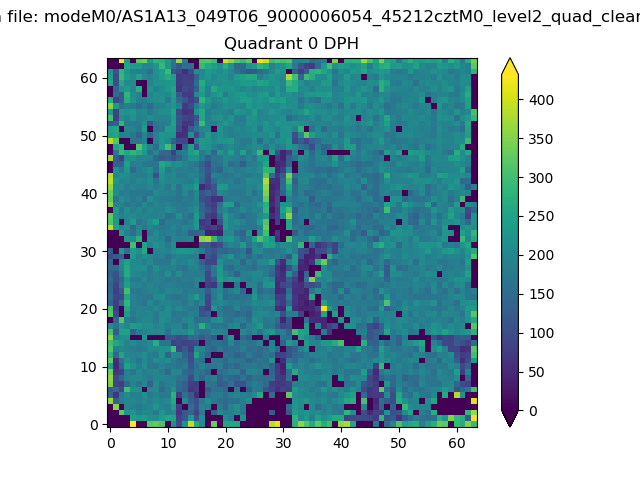 |
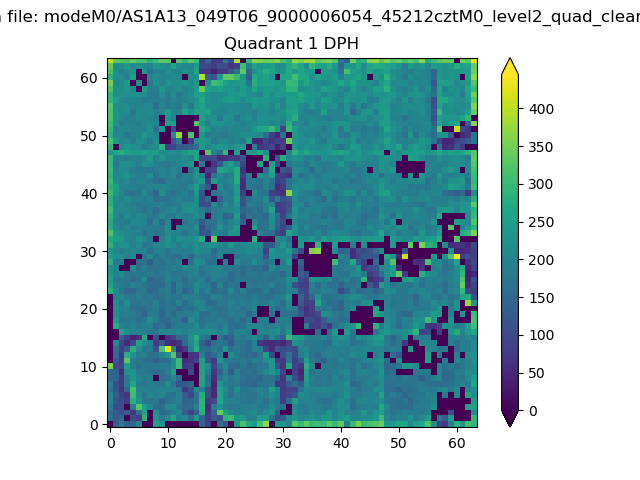 |
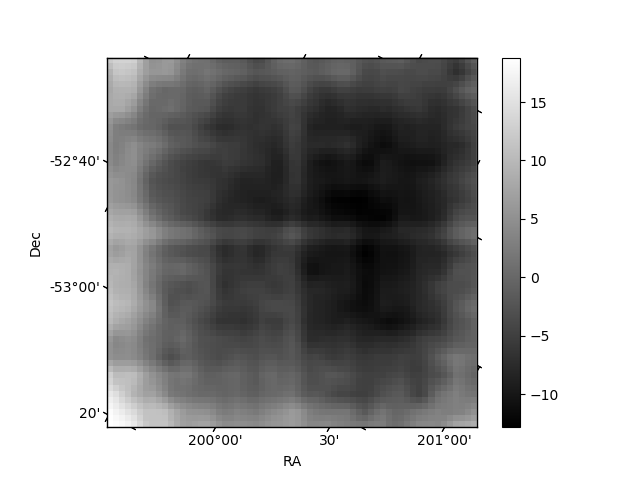
Quadrant B |
|---|---|---|---|
| Quadrant D | 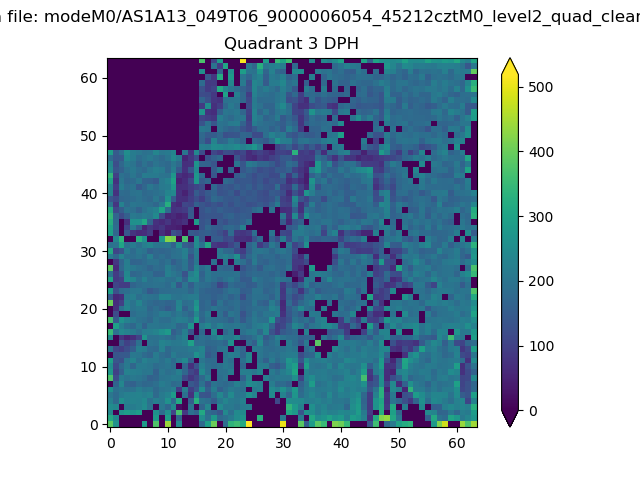 |
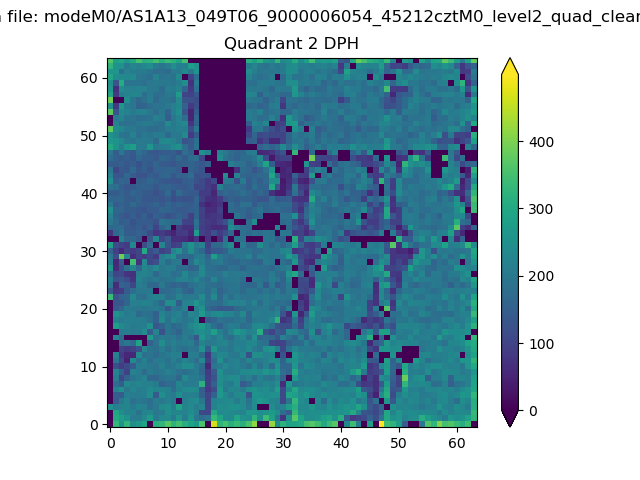 |
Quadrant C |
| Plot type | Count rate plots | Images |
|---|---|---|
| Comparison with Poisson distribution Blue bars denote a histogram of data divided into 1 sec bins. Red curve is a Poisson curve with rate = median count rate of data. |
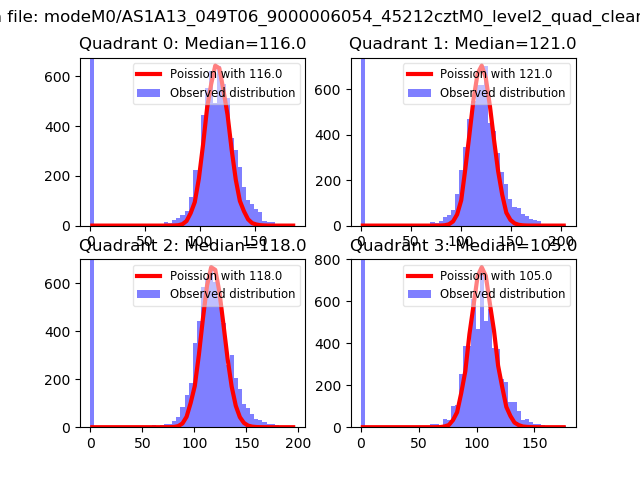 |
 |
| Quadrant-wise count rates Data is divided into 100 sec bins |
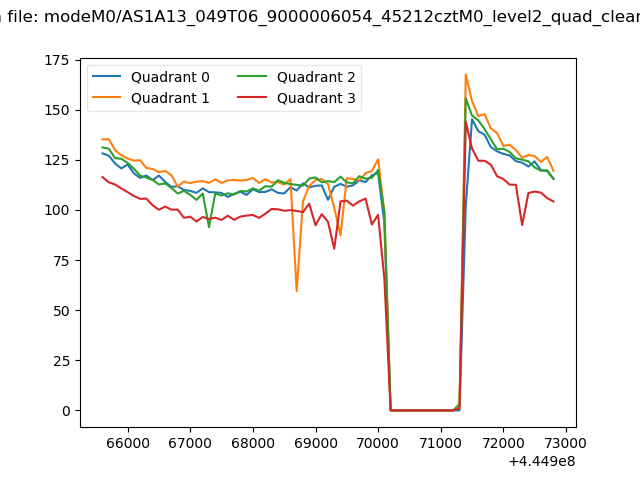 |
|
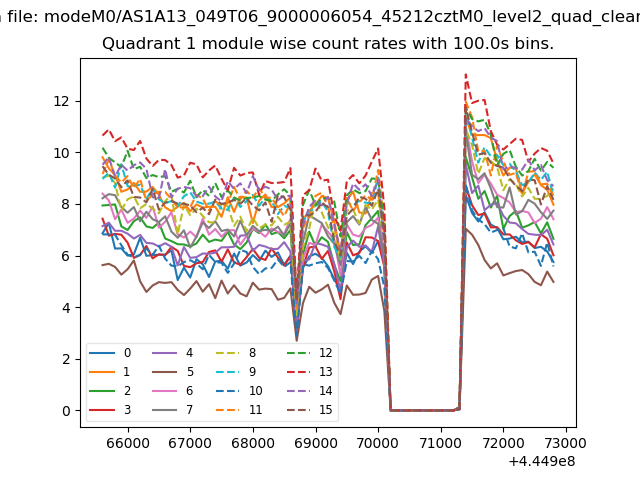
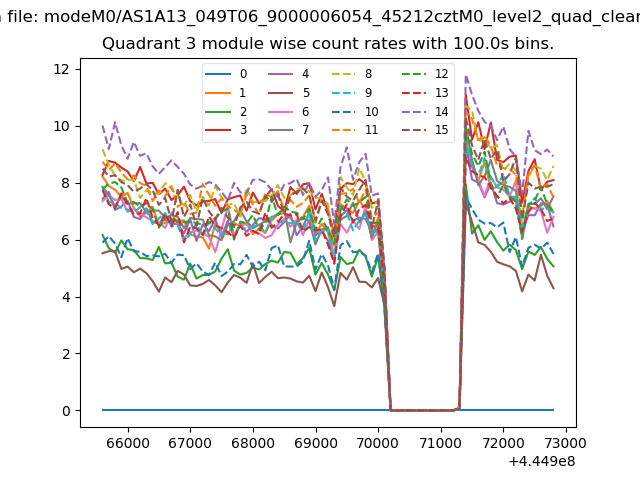
| Module-wise count rates for Quadrant A Data is divided into 100 sec bins |
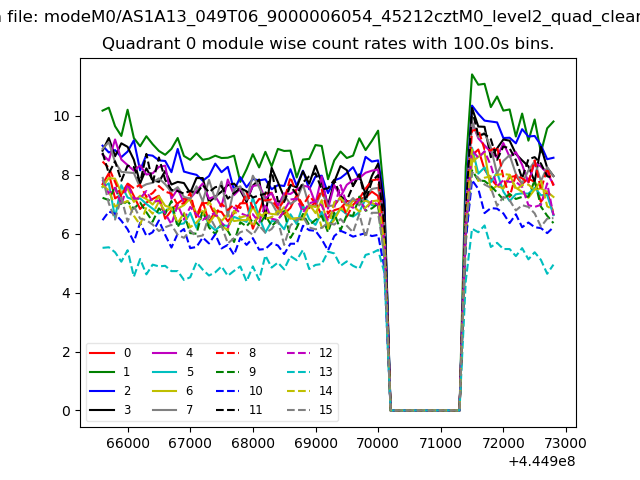 |
 |
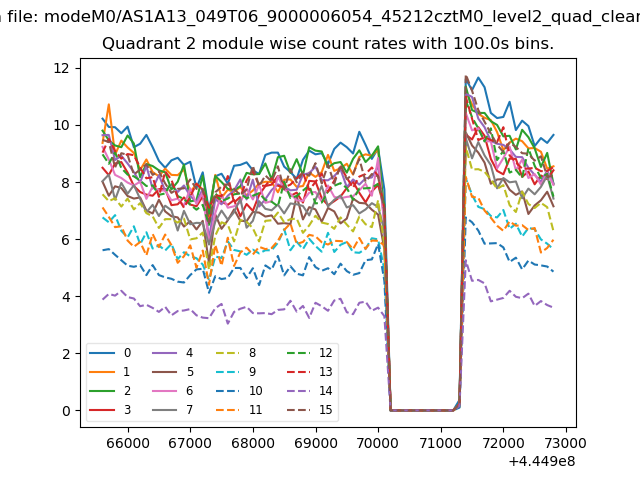
| Module-wise count rates for Quadrant B Data is divided into 100 sec bins |
 |
 |
| Module-wise count rates for Quadrant C Data is divided into 100 sec bins |
 |
 |
| Module-wise count rates for Quadrant D Data is divided into 100 sec bins |
 |
 |
| Parameter | Plot |
|---|---|
| CZT HV Monitor | 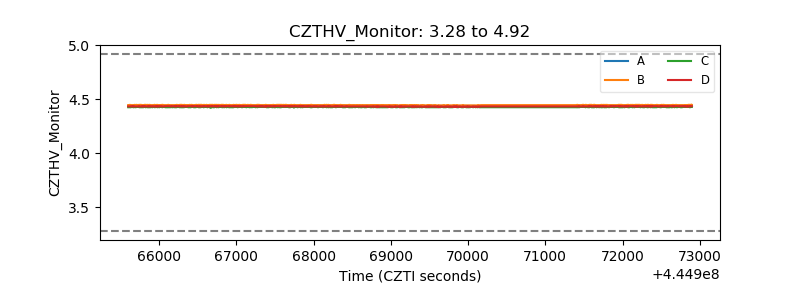 |
| D_VDD | 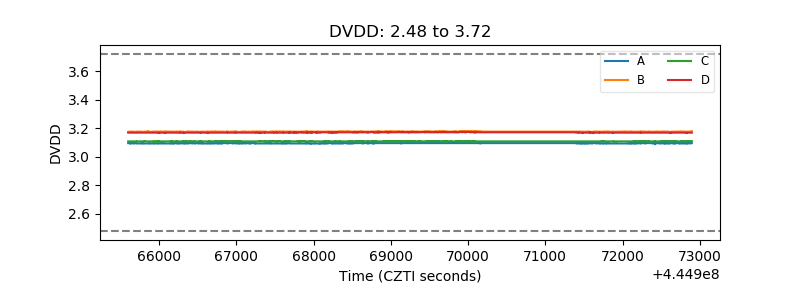 |
| Temperature 1 | 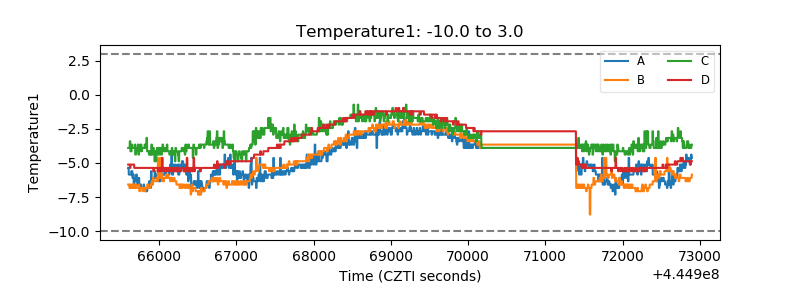 |
| Veto HV Monitor | 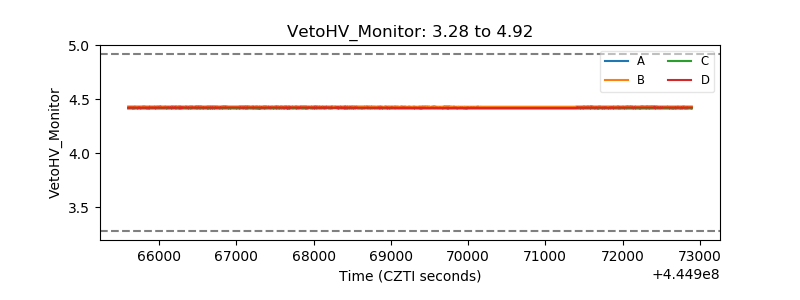 |
| Veto LLD | 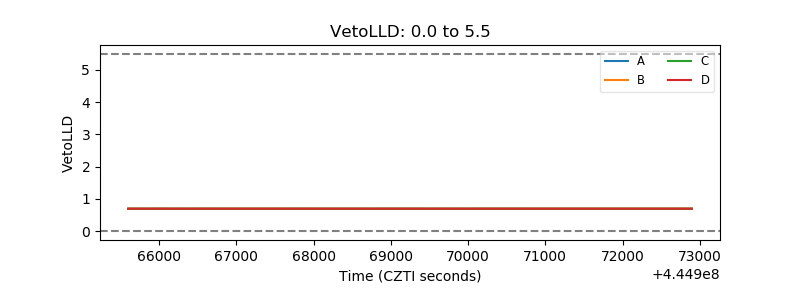 |
| Alpha Counter | 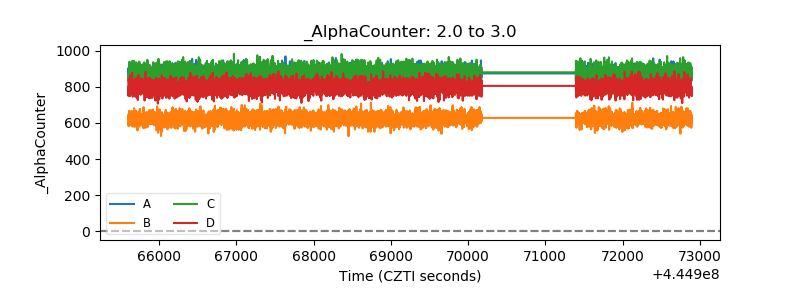 |
| _CPM_Rate | 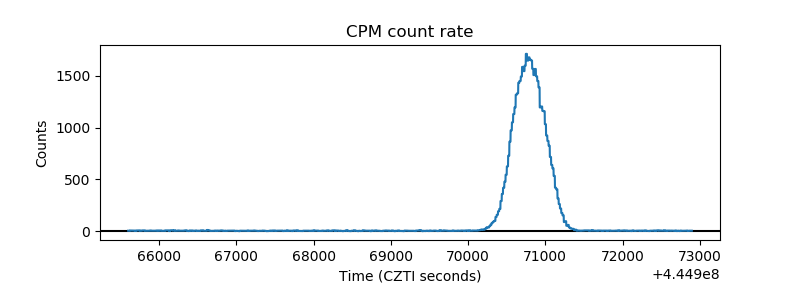 |
| CZT Counter | 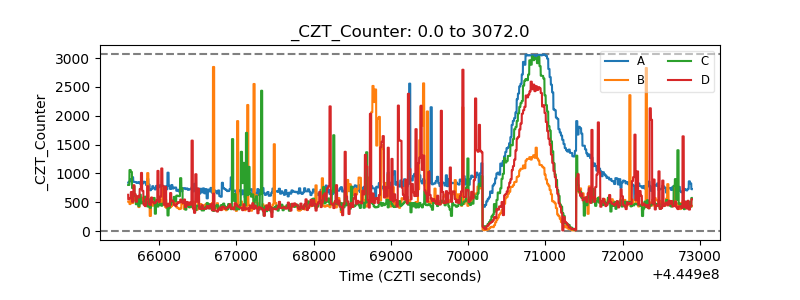 |
| +2.5 Volts monitor | 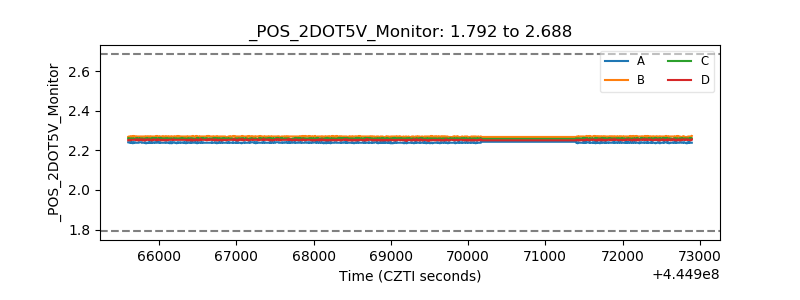 |
| +5 Volts monitor |  |
| _ROLL_ROT | 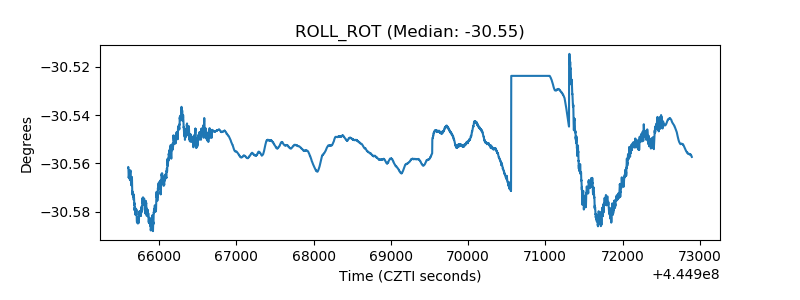 |
| _Roll_DEC | 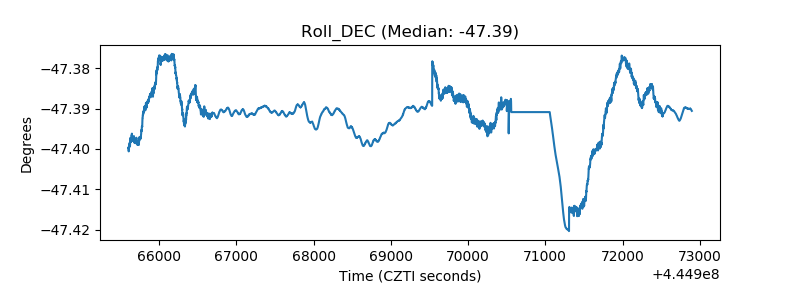 |
| _Roll_RA | 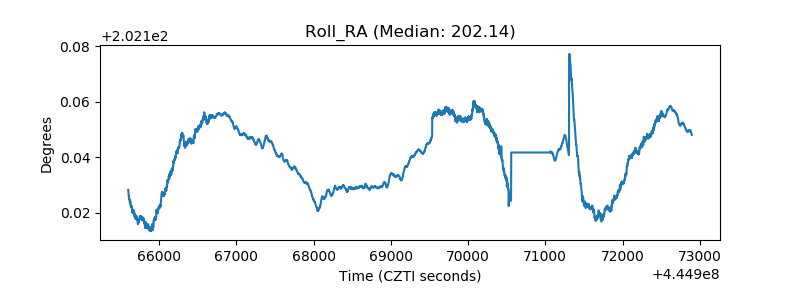 |
| Veto Counter | 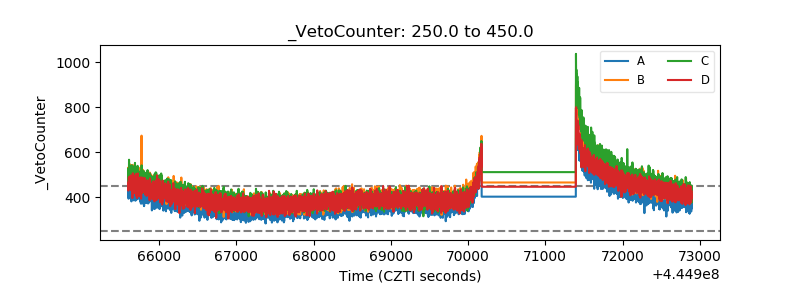 |