| Param | Original file | Final file |
|---|---|---|
| Filename | modeM0/AS1A13_049T06_9000006054_45213cztM0_level2.fits | modeM0/AS1A13_049T06_9000006054_45213cztM0_level2_quad_clean.evt |
| Size (bytes) | 479,744,640 | 113,705,280 |
| Size | 457.5 MB | 108.4 MB |
| Events in quadrant A | 5,519,074 | 755,137 |
| Events in quadrant B | 4,294,615 | 772,642 |
| Events in quadrant C | 3,180,776 | 781,749 |
| Events in quadrant D | 4,266,255 | 686,206 |
| Mode M0 | |||
|---|---|---|---|
| Quadrant | BADHDUFLAG | Total packets | Discarded packets |
| A | 0 | 20962 | 2 |
| B | 0 | 16924 | 2 |
| C | 0 | 13630 | 2 |
| D | 0 | 17025 | 2 |
| Mode M9 | |||
|---|---|---|---|
| Quadrant | BADHDUFLAG | Total packets | Discarded packets |
| A | 0 | 14 | 0 |
| B | 0 | 14 | 0 |
| C | 0 | 15 | 0 |
| D | 0 | 15 | 0 |
| Mode SS | |||
|---|---|---|---|
| Quadrant | BADHDUFLAG | Total packets | Discarded packets |
| A | 0 | 130 | 0 |
| B | 0 | 130 | 0 |
| C | 0 | 130 | 0 |
| D | 0 | 130 | 0 |
| Quadrant | Total seconds | Saturated seconds | Saturation percentage |
|---|---|---|---|
| A | 6414 | 193 | 3.009043% |
| B | 6414 | 374 | 5.830995% |
| C | 6414 | 37 | 0.576863% |
| D | 6414 | 269 | 4.193951% |
Noise dominated data is calculated using 1-second bins in cleaned event files. If a bin has >2000 counts, and if more than 50% of those come from <1% of pixels, then it is considered to be noise-dominated and hence unusable.
| Quadrant | # 1 sec bins | Bins with >0 counts | Bins with >2000 counts | High rate bins dominated by noise | Noise dominated (total time) | Noise dominated (detector-on time) | Marked lightcurve |
|---|---|---|---|---|---|---|---|
| A | 7629 | 6415 | 42 | 42 | 0.55% | 0.65% | 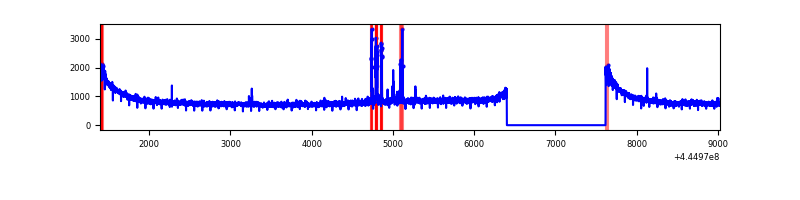 |
| B | 7629 | 6415 | 259 | 259 | 3.39% | 4.04% | 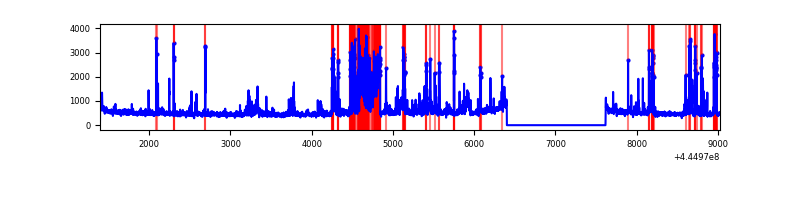 |
| C | 7629 | 6415 | 6 | 6 | 0.08% | 0.09% | 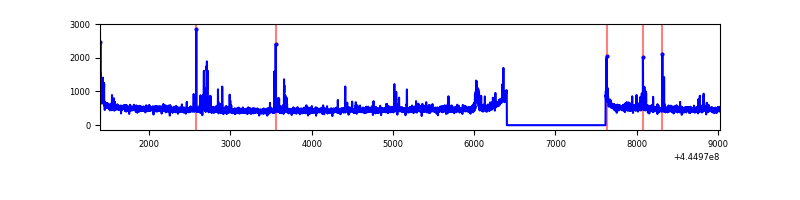 |
| D | 7629 | 6415 | 204 | 204 | 2.67% | 3.18% | 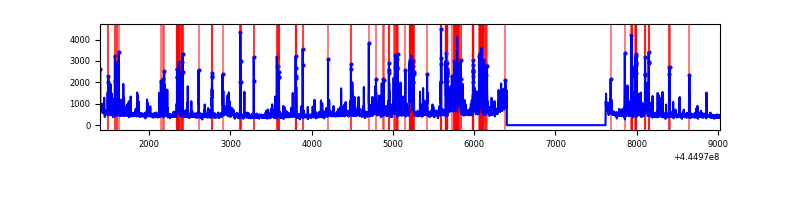 |
Top three noisy pixels from each quadrant. If the there are fewer than three noisy pixels in the level2.evt file, extra rows are filled as -1
| Pixel properties | Quadrant properties | ||||||
|---|---|---|---|---|---|---|---|
| Quadrant | DetID | PixID | Counts | Sigma | Mean | Median | Sigma |
| A | 10 | 83 | 2480529 | 16017.7 | 752 | 737 | 154.8 |
| A | 15 | 174 | 76303 | 488.1 | 752 | 737 | 154.8 |
| A | 13 | 248 | 30319 | 191.08 | 752 | 737 | 154.8 |
| B | 4 | 171 | 1027641 | 7104.29 | 749 | 725 | 144.5 |
| B | 3 | 112 | 141119 | 971.26 | 749 | 725 | 144.5 |
| B | 10 | 3 | 57532 | 393.0 | 749 | 725 | 144.5 |
| C | 12 | 2 | 156433 | 866.96 | 767 | 773 | 179.5 |
| C | 3 | 233 | 13555 | 71.19 | 767 | 773 | 179.5 |
| C | 12 | 250 | 11559 | 60.07 | 767 | 773 | 179.5 |
| D | 13 | 249 | 832344 | 4429.31 | 747 | 725 | 187.8 |
| D | 5 | 222 | 112424 | 594.92 | 747 | 725 | 187.8 |
| D | 2 | 249 | 108590 | 574.5 | 747 | 725 | 187.8 |
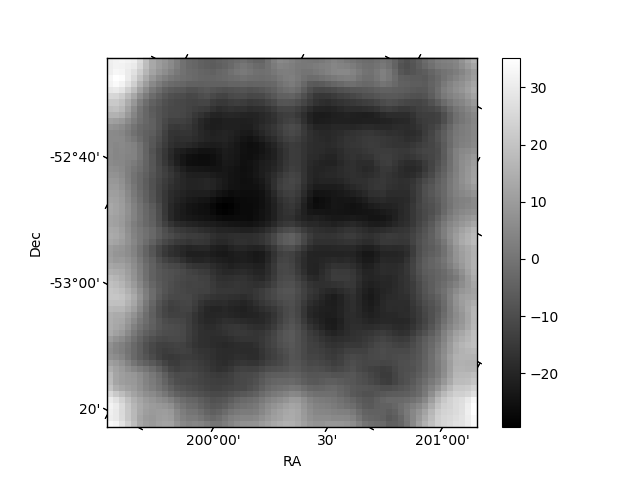
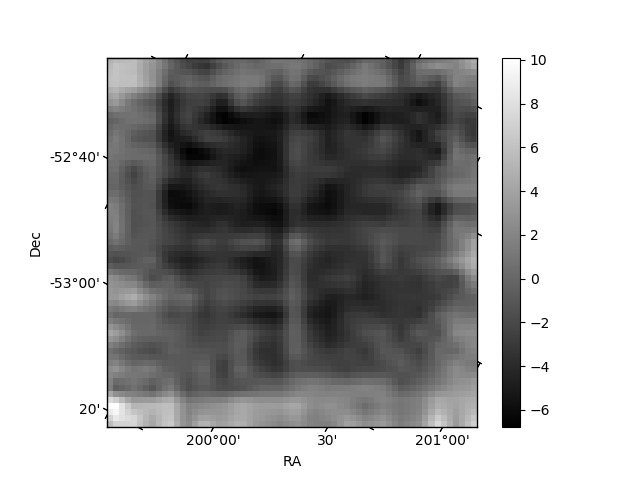
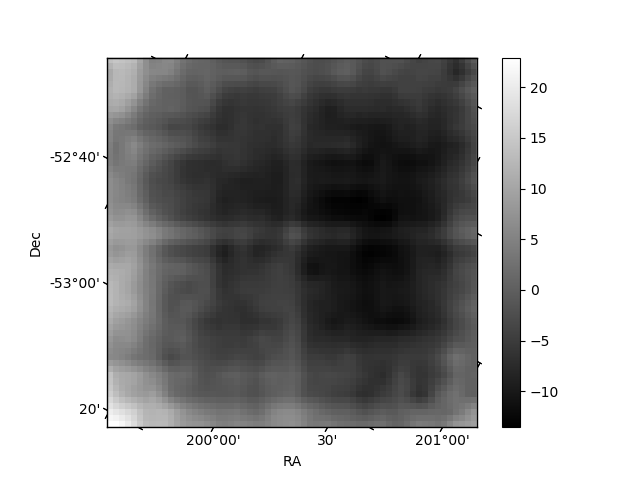
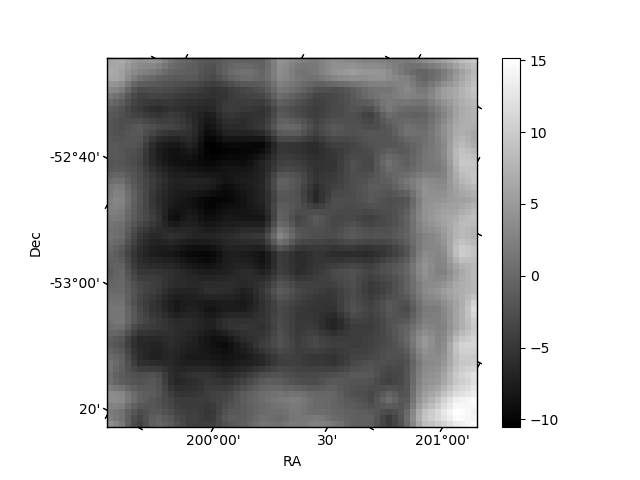
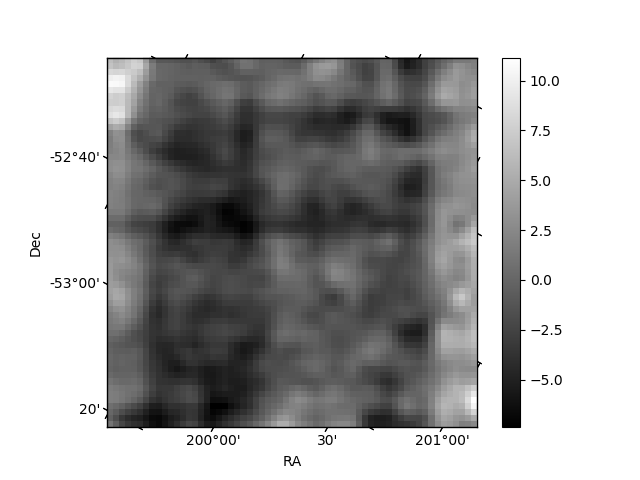
Histogram calculated using DETX and DETY for each event in the final _common_clean file
| Quadrant A | 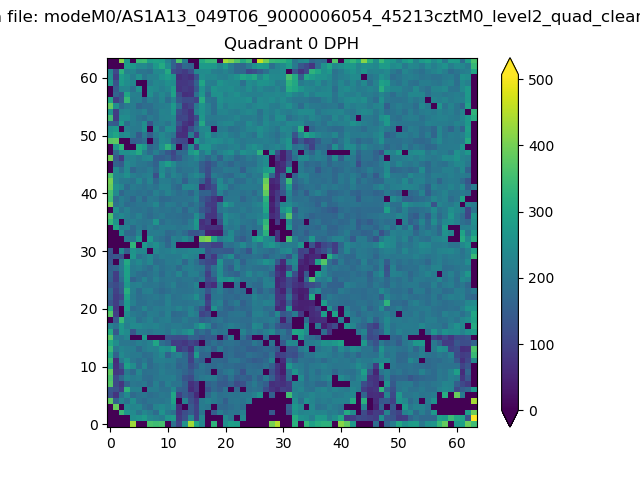 |
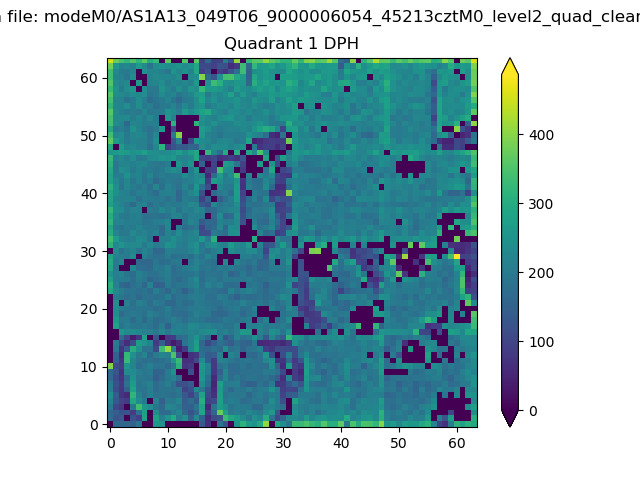 |
Quadrant B |
|---|---|---|---|
| Quadrant D | 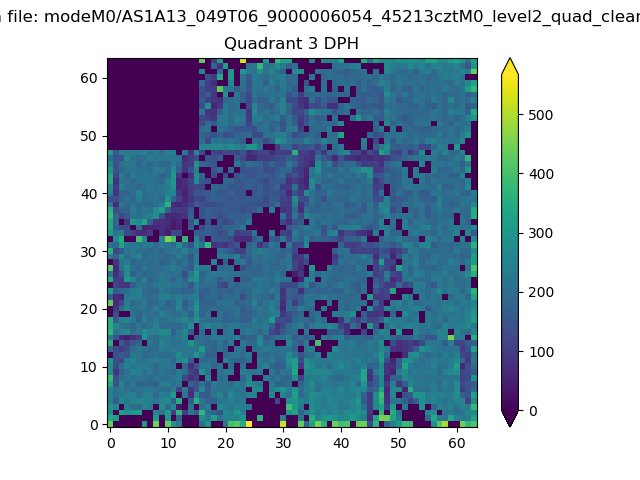 |
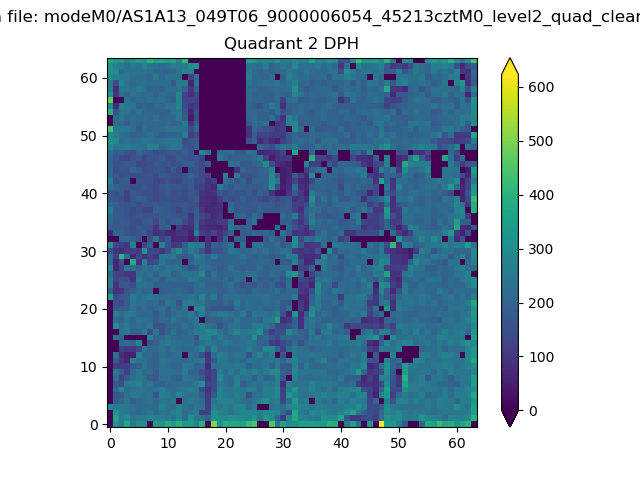 |
Quadrant C |
| Plot type | Count rate plots | Images |
|---|---|---|
| Comparison with Poisson distribution Blue bars denote a histogram of data divided into 1 sec bins. Red curve is a Poisson curve with rate = median count rate of data. |
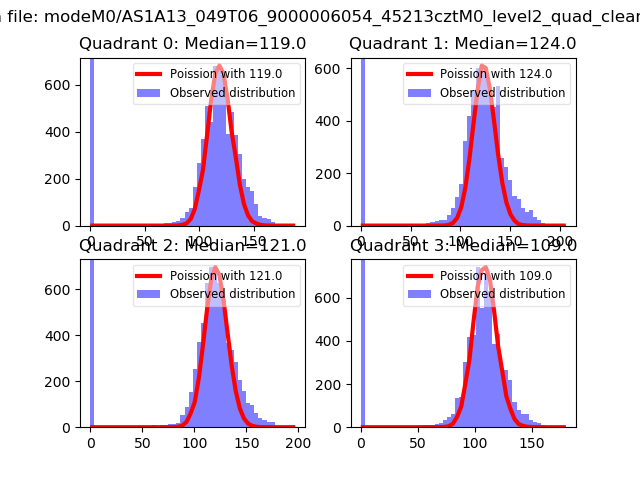 |
 |
| Quadrant-wise count rates Data is divided into 100 sec bins |
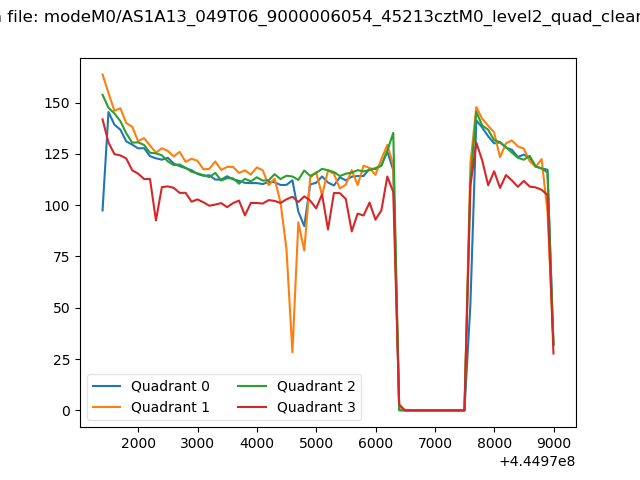 |
|
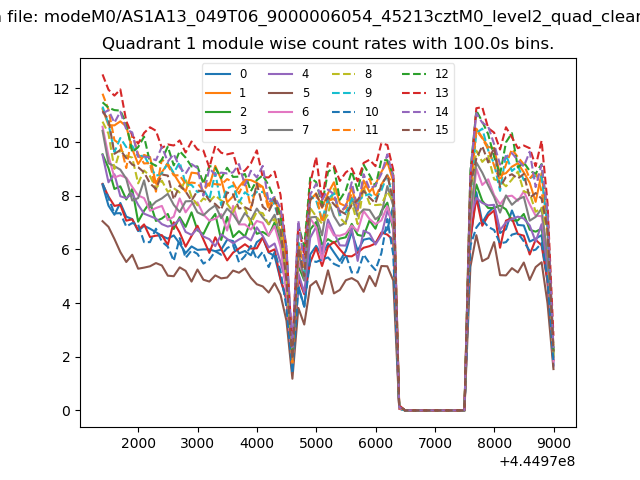
| Module-wise count rates for Quadrant A Data is divided into 100 sec bins |
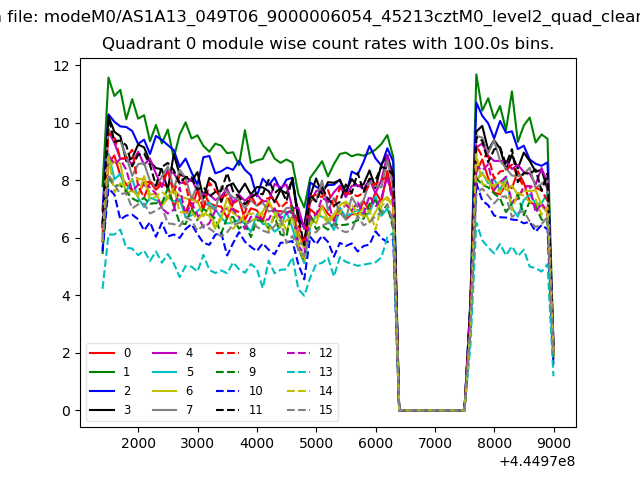 |
 |
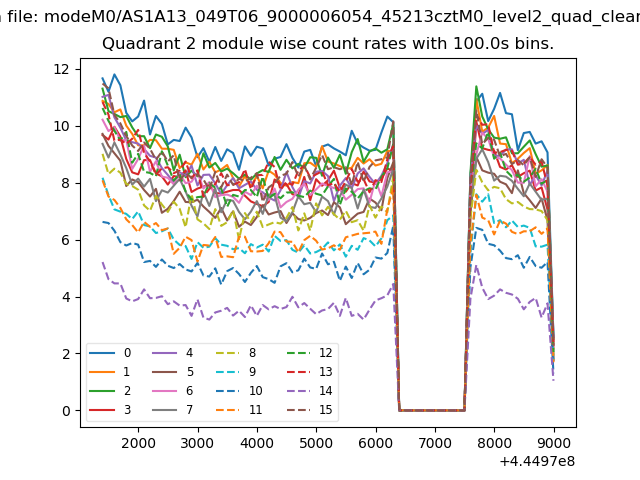
| Module-wise count rates for Quadrant B Data is divided into 100 sec bins |
 |
 |
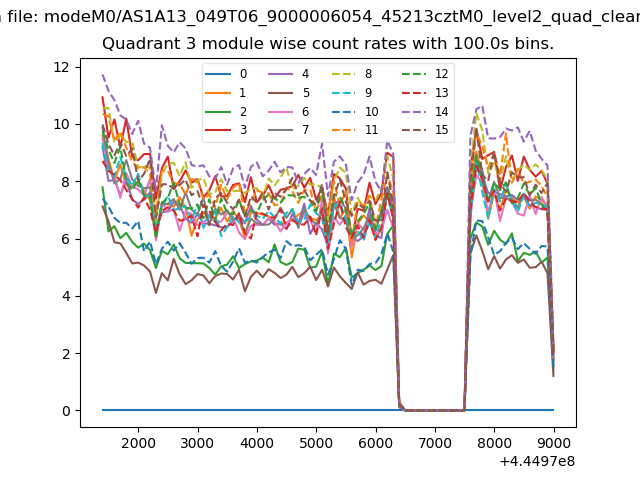
| Module-wise count rates for Quadrant C Data is divided into 100 sec bins |
 |
 |
| Module-wise count rates for Quadrant D Data is divided into 100 sec bins |
 |
 |
| Parameter | Plot |
|---|---|
| CZT HV Monitor | 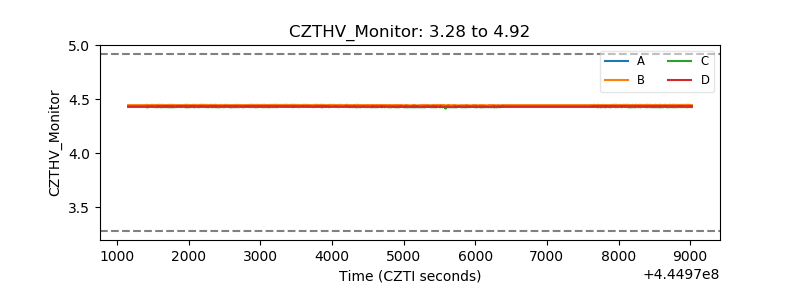 |
| D_VDD | 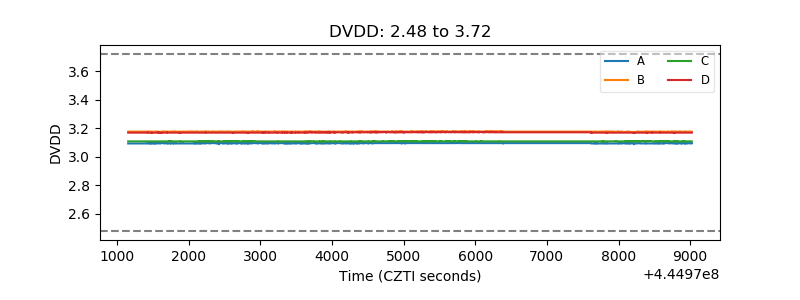 |
| Temperature 1 | 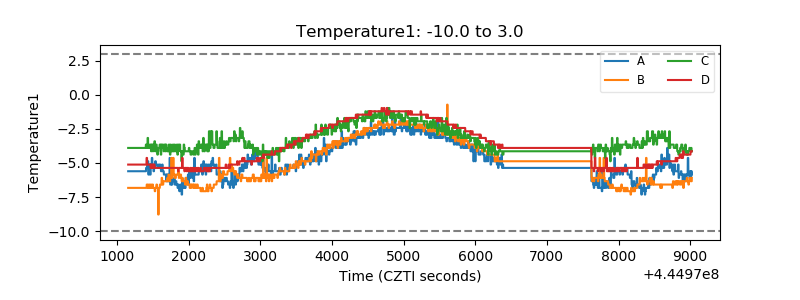 |
| Veto HV Monitor |  |
| Veto LLD | 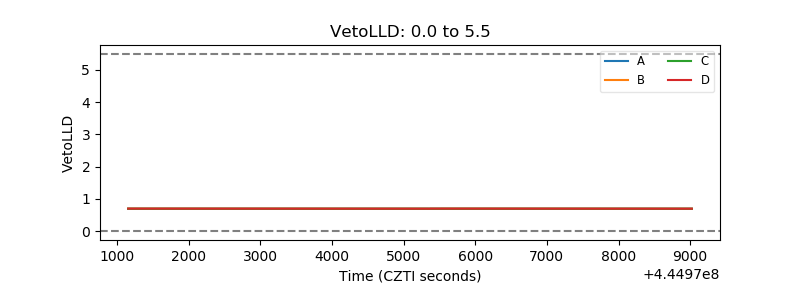 |
| Alpha Counter | 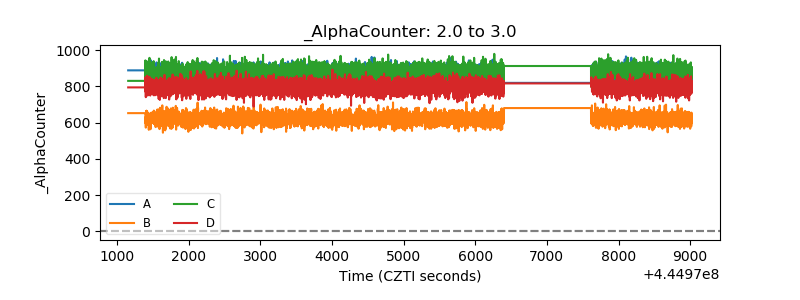 |
| _CPM_Rate | 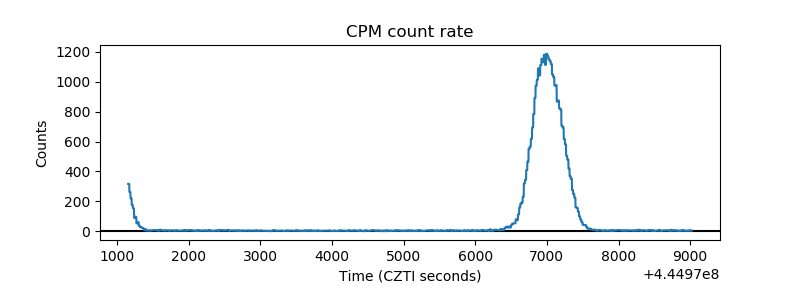 |
| CZT Counter | 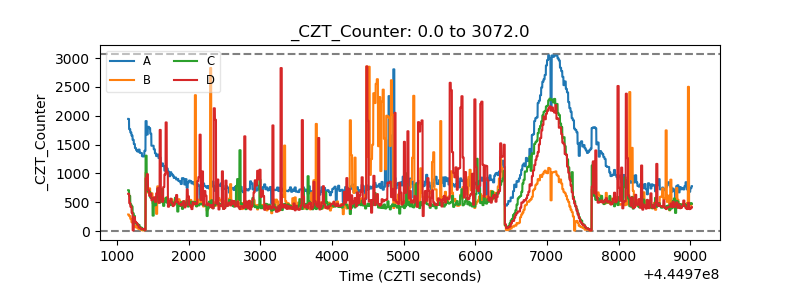 |
| +2.5 Volts monitor | 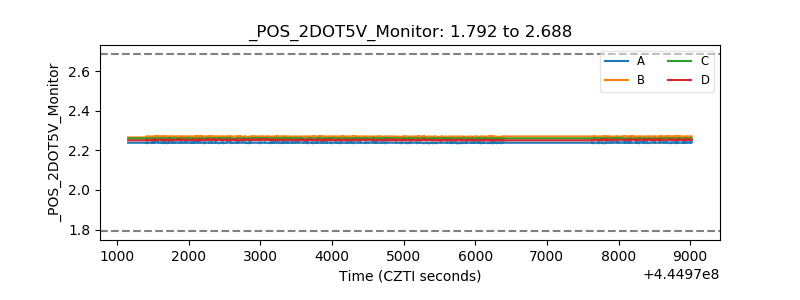 |
| +5 Volts monitor | 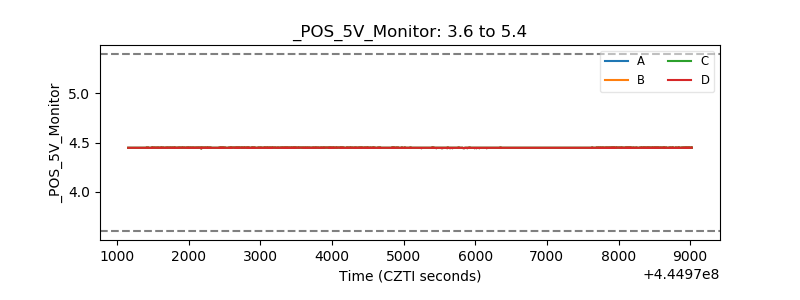 |
| _ROLL_ROT | 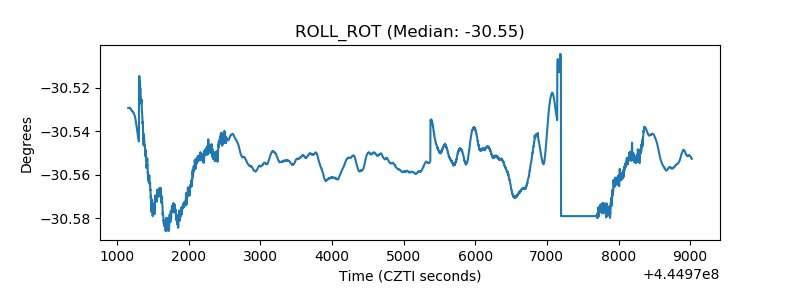 |
| _Roll_DEC | 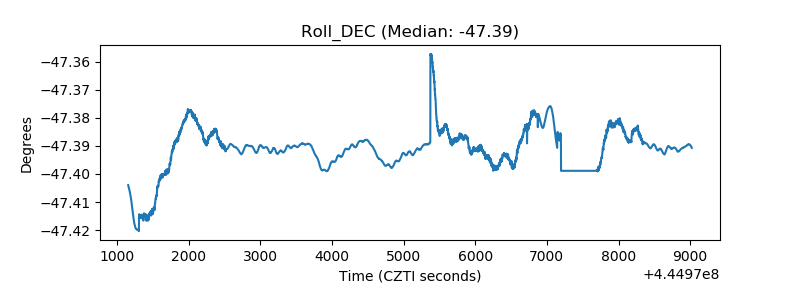 |
| _Roll_RA | 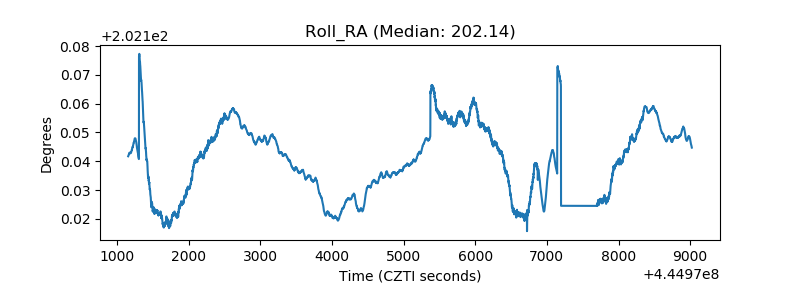 |
| Veto Counter | 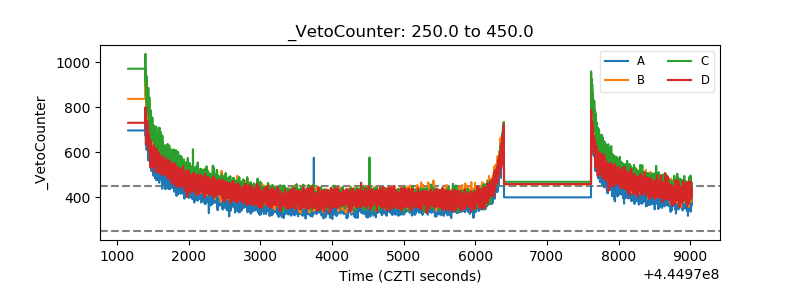 |