| Param | Original file | Final file |
|---|---|---|
| Filename | modeM0/AS1A13_049T06_9000006054_45214cztM0_level2.fits | modeM0/AS1A13_049T06_9000006054_45214cztM0_level2_quad_clean.evt |
| Size (bytes) | 489,070,080 | 109,673,280 |
| Size | 466.4 MB | 104.6 MB |
| Events in quadrant A | 5,277,873 | 738,206 |
| Events in quadrant B | 3,504,059 | 772,210 |
| Events in quadrant C | 3,826,271 | 732,067 |
| Events in quadrant D | 5,003,178 | 635,366 |
| Mode M0 | |||
|---|---|---|---|
| Quadrant | BADHDUFLAG | Total packets | Discarded packets |
| A | 0 | 20258 | 1 |
| B | 0 | 14495 | 1 |
| C | 0 | 15588 | 1 |
| D | 0 | 19230 | 2 |
| Mode M9 | |||
|---|---|---|---|
| Quadrant | BADHDUFLAG | Total packets | Discarded packets |
| A | 0 | 11 | 0 |
| B | 0 | 11 | 0 |
| C | 0 | 11 | 0 |
| D | 0 | 11 | 0 |
| Mode SS | |||
|---|---|---|---|
| Quadrant | BADHDUFLAG | Total packets | Discarded packets |
| A | 0 | 130 | 0 |
| B | 0 | 130 | 0 |
| C | 0 | 130 | 0 |
| D | 0 | 130 | 0 |
| Quadrant | Total seconds | Saturated seconds | Saturation percentage |
|---|---|---|---|
| A | 6346 | 108 | 1.701859% |
| B | 6346 | 107 | 1.686101% |
| C | 6347 | 226 | 3.560737% |
| D | 6346 | 528 | 8.320202% |
Noise dominated data is calculated using 1-second bins in cleaned event files. If a bin has >2000 counts, and if more than 50% of those come from <1% of pixels, then it is considered to be noise-dominated and hence unusable.
| Quadrant | # 1 sec bins | Bins with >0 counts | Bins with >2000 counts | High rate bins dominated by noise | Noise dominated (total time) | Noise dominated (detector-on time) | Marked lightcurve |
|---|---|---|---|---|---|---|---|
| A | 7526 | 6346 | 13 | 13 | 0.17% | 0.20% | 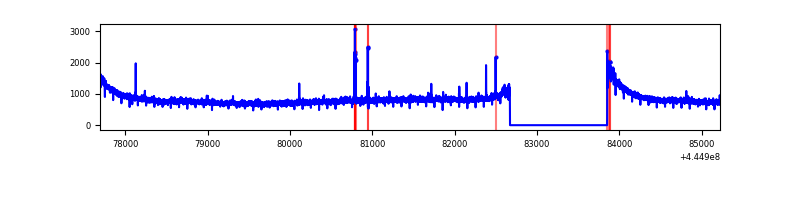 |
| B | 7526 | 6347 | 61 | 61 | 0.81% | 0.96% | 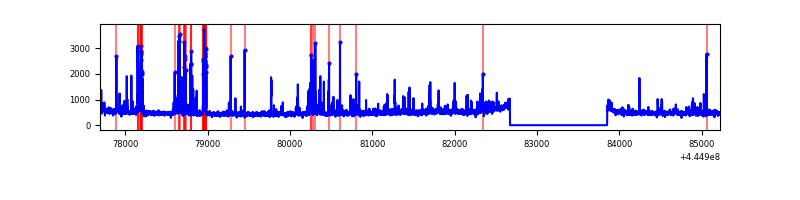 |
| C | 7527 | 6348 | 186 | 186 | 2.47% | 2.93% | 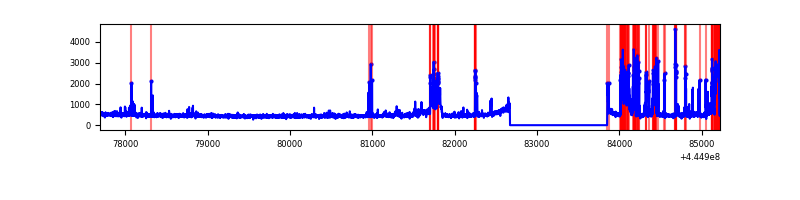 |
| D | 7526 | 6347 | 483 | 483 | 6.42% | 7.61% | 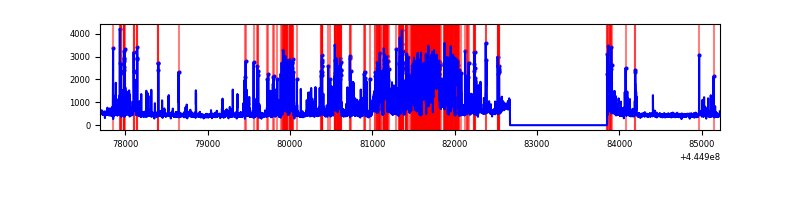 |
Top three noisy pixels from each quadrant. If the there are fewer than three noisy pixels in the level2.evt file, extra rows are filled as -1
| Pixel properties | Quadrant properties | ||||||
|---|---|---|---|---|---|---|---|
| Quadrant | DetID | PixID | Counts | Sigma | Mean | Median | Sigma |
| A | 10 | 83 | 2361232 | 15710.52 | 737 | 723 | 150.3 |
| A | 0 | 243 | 23628 | 152.45 | 737 | 723 | 150.3 |
| A | 15 | 174 | 22065 | 142.04 | 737 | 723 | 150.3 |
| B | 4 | 171 | 344180 | 2403.23 | 739 | 717 | 142.9 |
| B | 3 | 112 | 124572 | 866.62 | 739 | 717 | 142.9 |
| B | 0 | 168 | 30742 | 210.09 | 739 | 717 | 142.9 |
| C | 12 | 2 | 919233 | 5314.2 | 736 | 740 | 172.8 |
| C | 3 | 233 | 23226 | 130.1 | 736 | 740 | 172.8 |
| C | 1 | 3 | 11737 | 63.63 | 736 | 740 | 172.8 |
| D | 13 | 249 | 1357701 | 7524.73 | 713 | 692 | 180.3 |
| D | 5 | 171 | 386165 | 2137.48 | 713 | 692 | 180.3 |
| D | 2 | 249 | 194973 | 1077.3 | 713 | 692 | 180.3 |
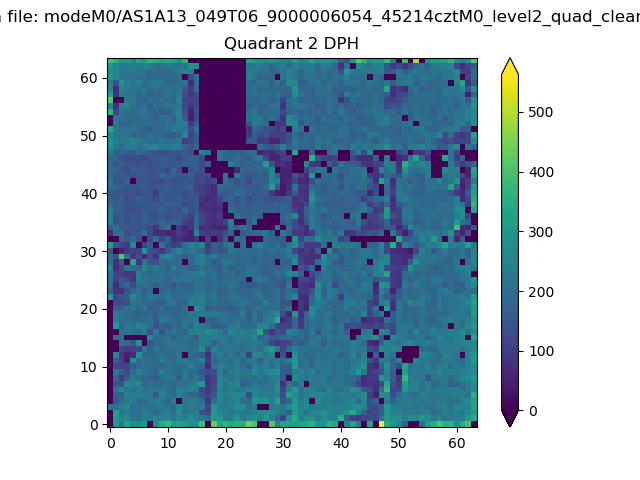
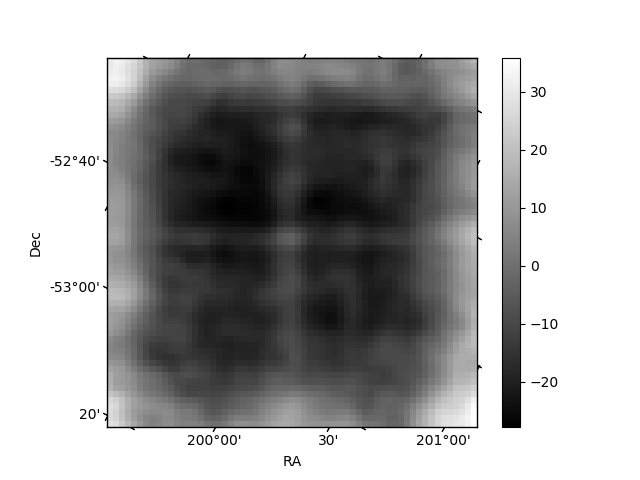
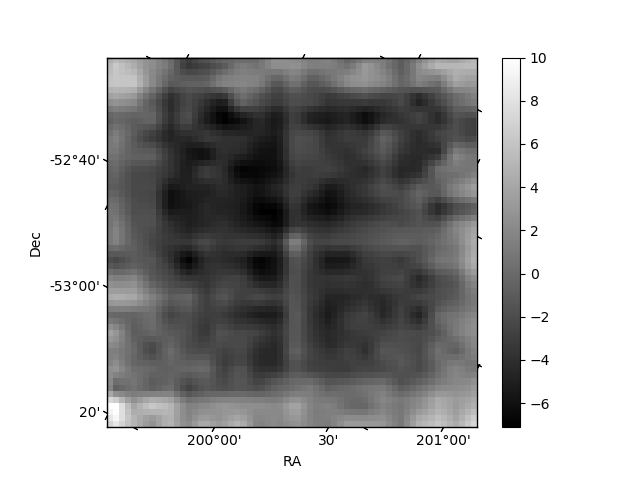
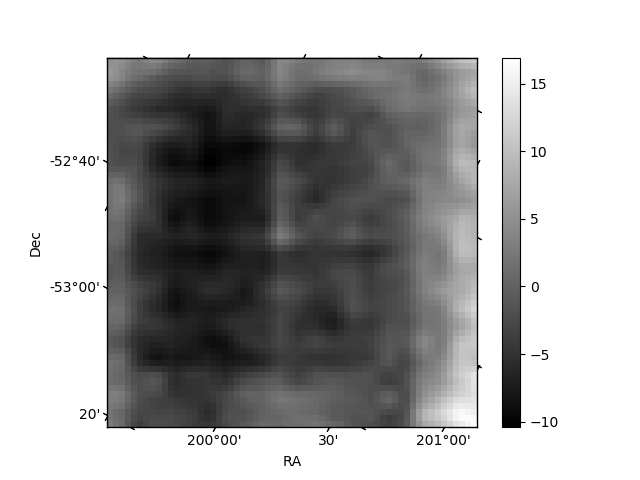
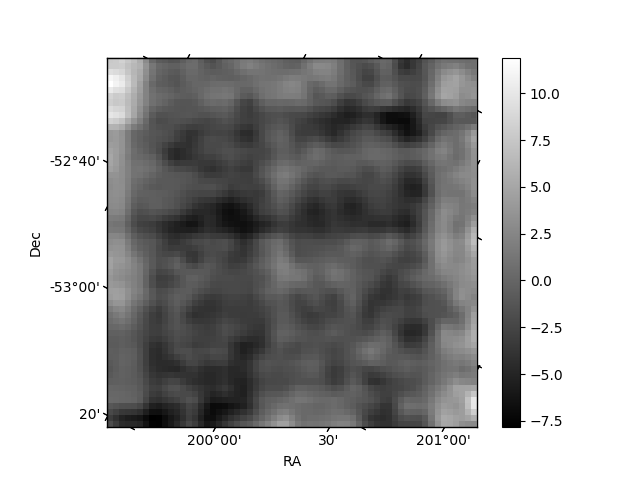
Histogram calculated using DETX and DETY for each event in the final _common_clean file
| Quadrant A | 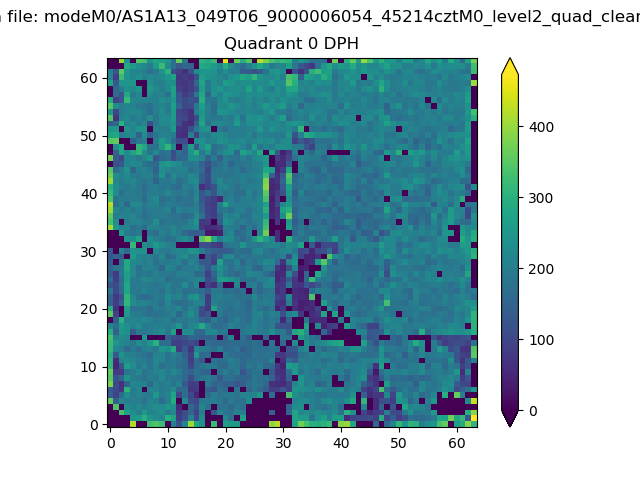 |
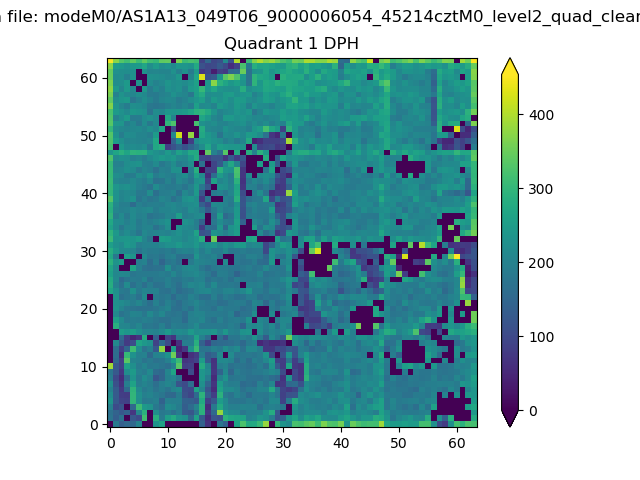 |
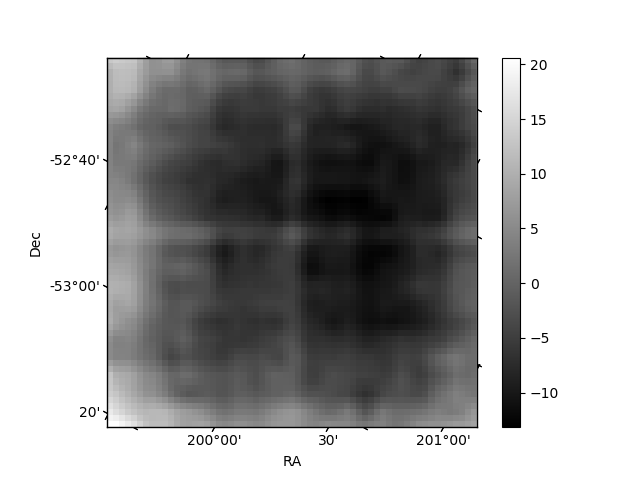
Quadrant B |
|---|---|---|---|
| Quadrant D | 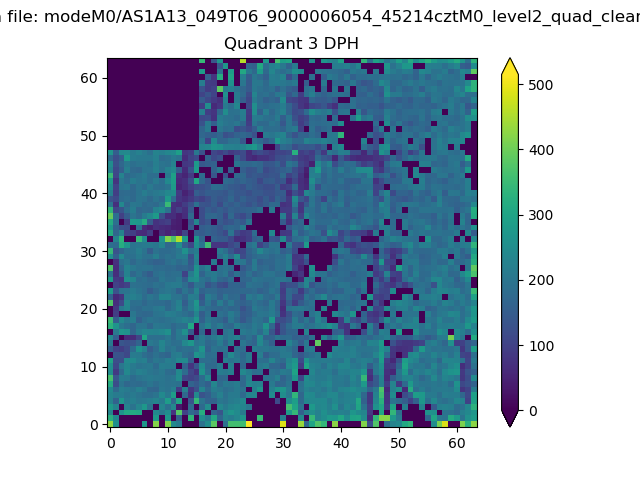 |
 |
Quadrant C |
| Plot type | Count rate plots | Images |
|---|---|---|
| Comparison with Poisson distribution Blue bars denote a histogram of data divided into 1 sec bins. Red curve is a Poisson curve with rate = median count rate of data. |
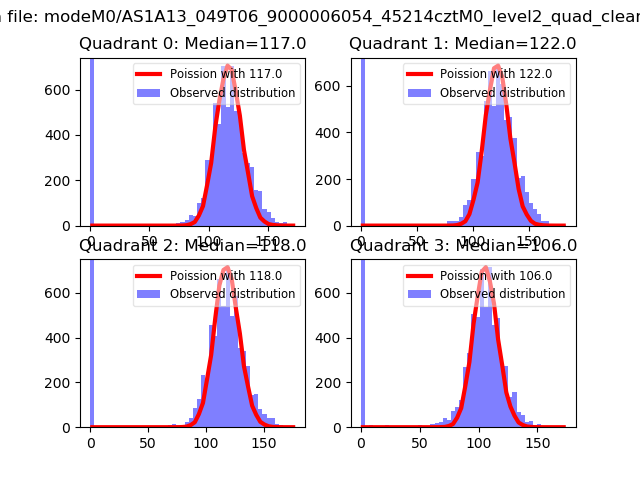 |
 |
| Quadrant-wise count rates Data is divided into 100 sec bins |
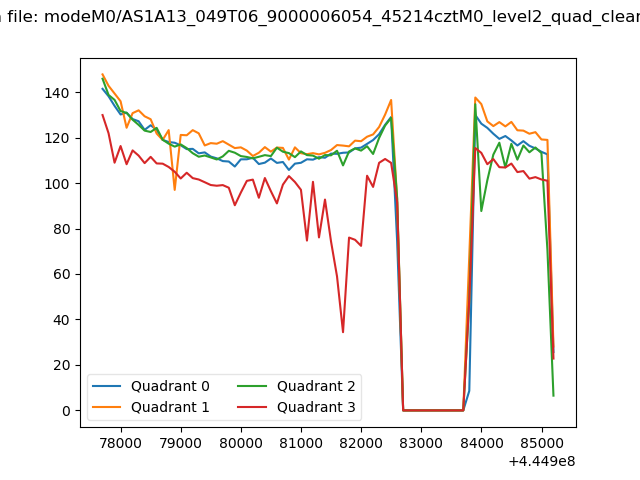 |
|
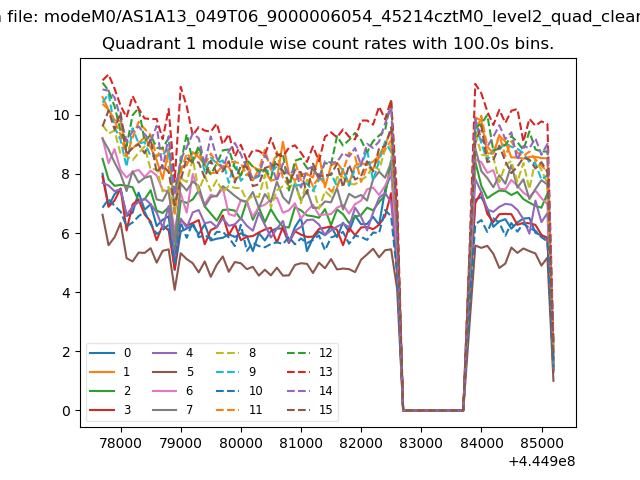
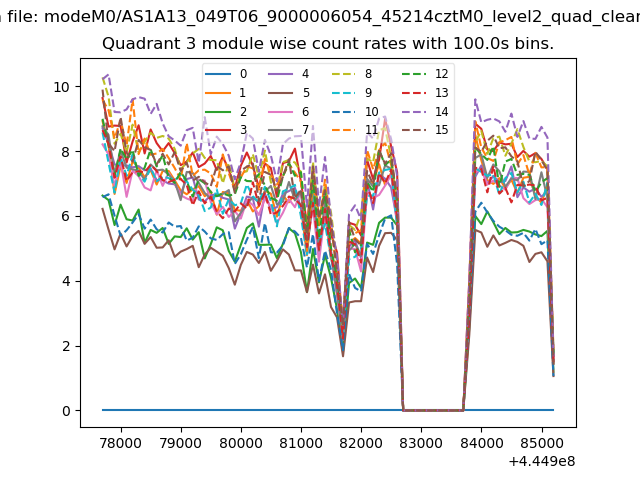
| Module-wise count rates for Quadrant A Data is divided into 100 sec bins |
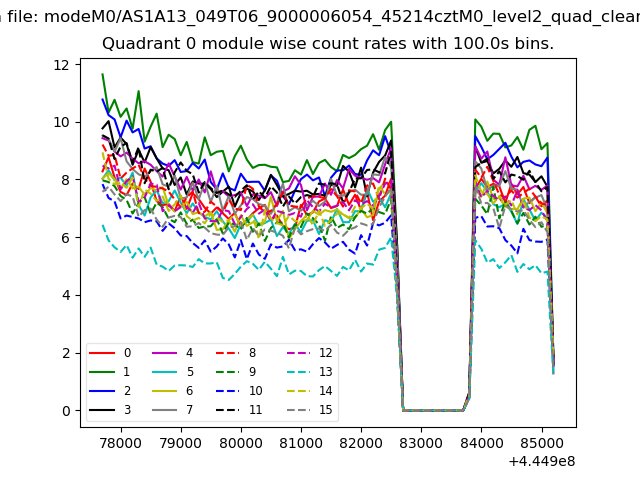 |
 |
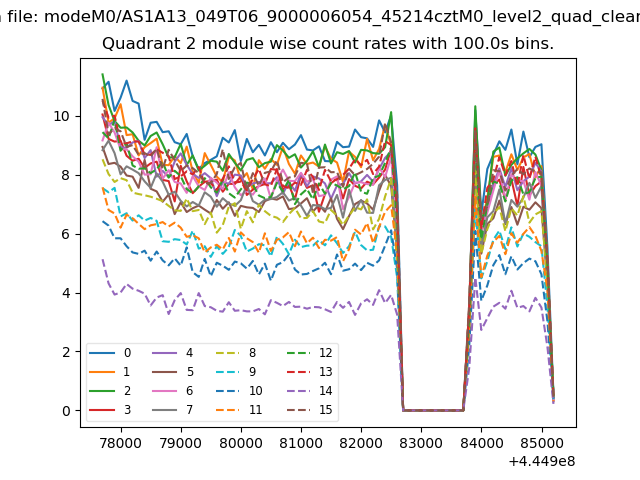
| Module-wise count rates for Quadrant B Data is divided into 100 sec bins |
 |
 |
| Module-wise count rates for Quadrant C Data is divided into 100 sec bins |
 |
 |
| Module-wise count rates for Quadrant D Data is divided into 100 sec bins |
 |
 |
| Parameter | Plot |
|---|---|
| CZT HV Monitor | 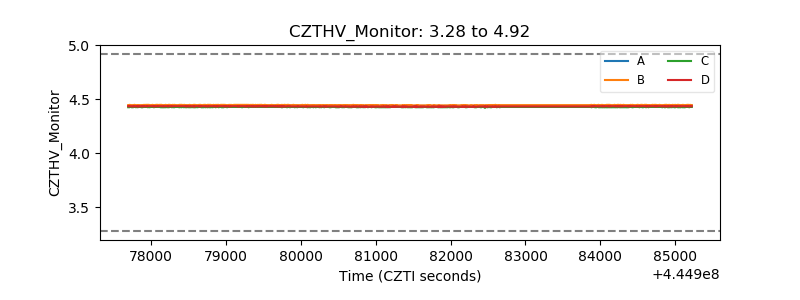 |
| D_VDD | 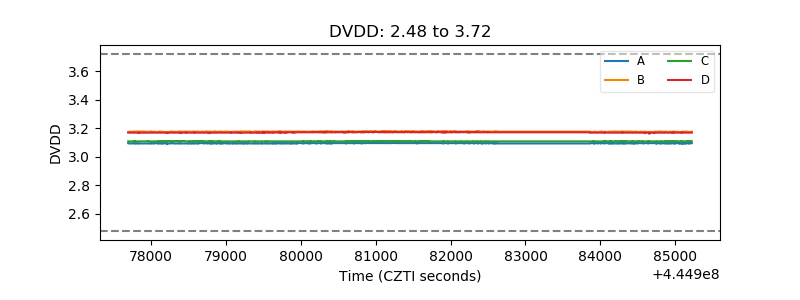 |
| Temperature 1 | 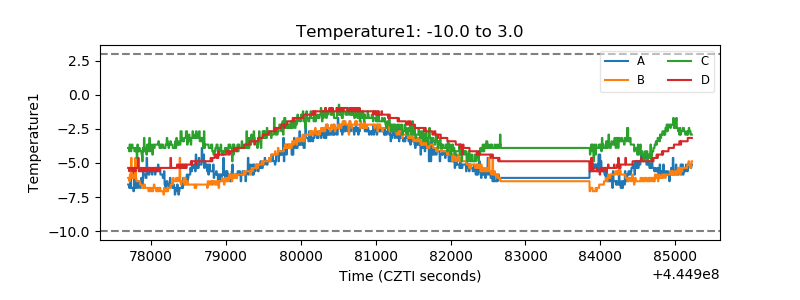 |
| Veto HV Monitor |  |
| Veto LLD | 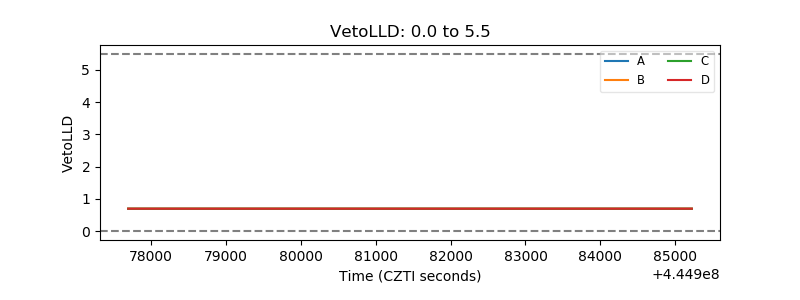 |
| Alpha Counter | 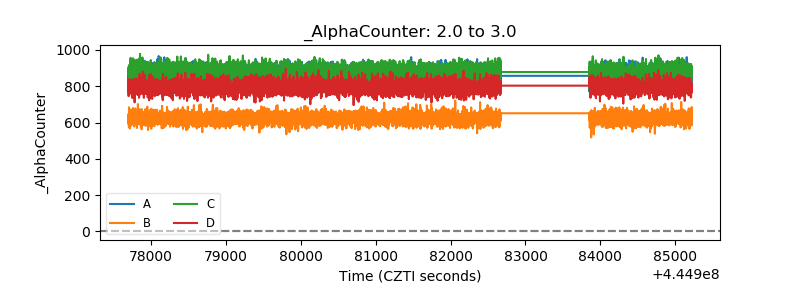 |
| _CPM_Rate | 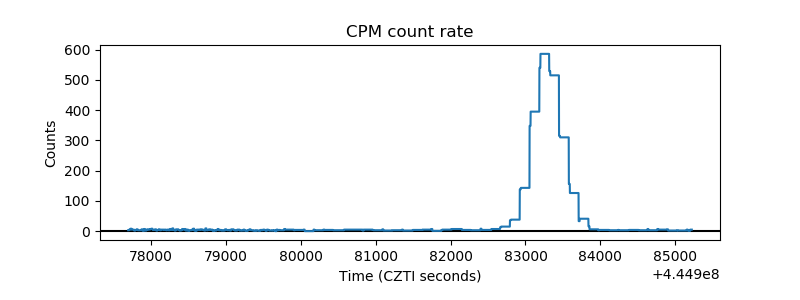 |
| CZT Counter | 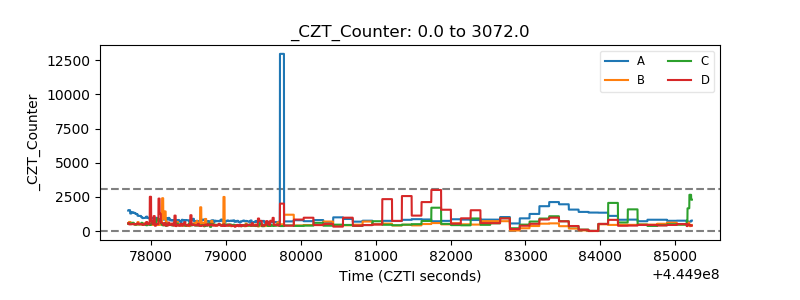 |
| +2.5 Volts monitor | 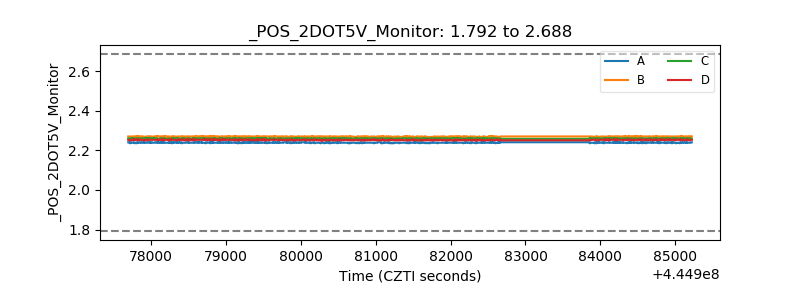 |
| +5 Volts monitor |  |
| _ROLL_ROT | 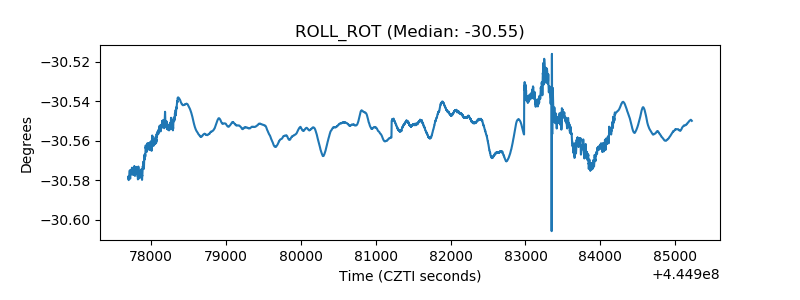 |
| _Roll_DEC | 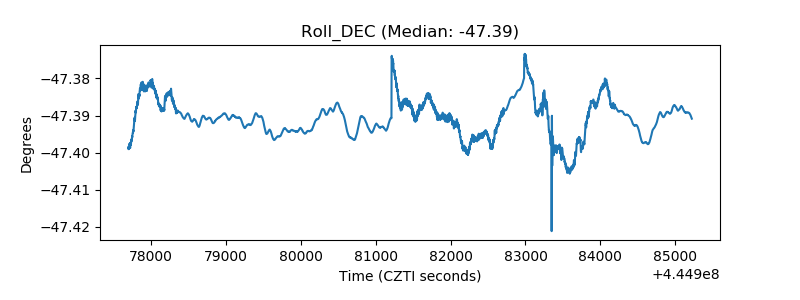 |
| _Roll_RA | 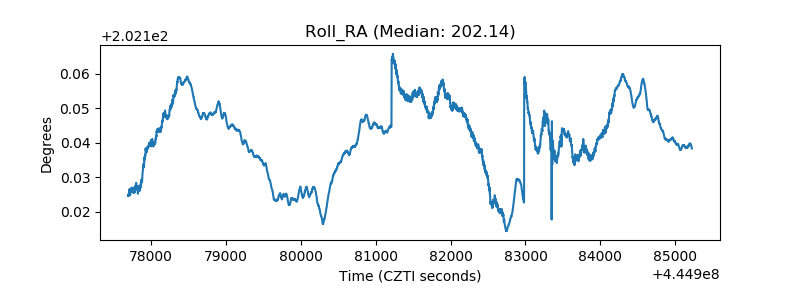 |
| Veto Counter | 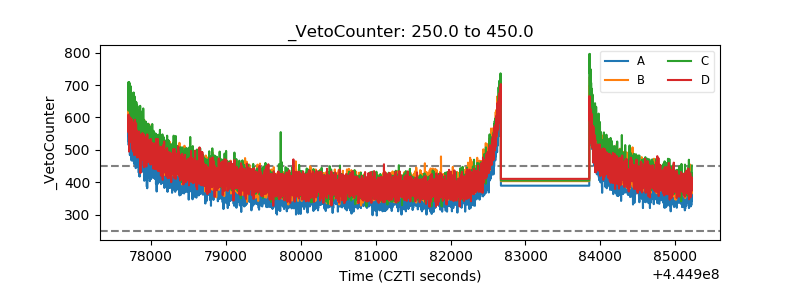 |