| Param | Original file | Final file |
|---|---|---|
| Filename | modeM0/AS1A13_049T06_9000006054_45215cztM0_level2.fits | modeM0/AS1A13_049T06_9000006054_45215cztM0_level2_quad_clean.evt |
| Size (bytes) | 470,041,920 | 99,990,720 |
| Size | 448.3 MB | 95.4 MB |
| Events in quadrant A | 5,009,736 | 672,006 |
| Events in quadrant B | 3,068,411 | 705,858 |
| Events in quadrant C | 3,539,616 | 660,402 |
| Events in quadrant D | 5,304,263 | 560,092 |
| Mode M0 | |||
|---|---|---|---|
| Quadrant | BADHDUFLAG | Total packets | Discarded packets |
| A | 0 | 19225 | 1 |
| B | 0 | 13071 | 1 |
| C | 0 | 14651 | 1 |
| D | 0 | 19986 | 1 |
| Mode M9 | |||
|---|---|---|---|
| Quadrant | BADHDUFLAG | Total packets | Discarded packets |
| A | 0 | 9 | 0 |
| B | 0 | 9 | 0 |
| C | 0 | 9 | 0 |
| D | 0 | 9 | 0 |
| Mode SS | |||
|---|---|---|---|
| Quadrant | BADHDUFLAG | Total packets | Discarded packets |
| A | 0 | 126 | 0 |
| B | 0 | 126 | 0 |
| C | 0 | 126 | 0 |
| D | 0 | 126 | 0 |
| Quadrant | Total seconds | Saturated seconds | Saturation percentage |
|---|---|---|---|
| A | 6145 | 178 | 2.896664% |
| B | 6145 | 116 | 1.887714% |
| C | 6146 | 279 | 4.539538% |
| D | 6145 | 805 | 13.100081% |
Noise dominated data is calculated using 1-second bins in cleaned event files. If a bin has >2000 counts, and if more than 50% of those come from <1% of pixels, then it is considered to be noise-dominated and hence unusable.
| Quadrant | # 1 sec bins | Bins with >0 counts | Bins with >2000 counts | High rate bins dominated by noise | Noise dominated (total time) | Noise dominated (detector-on time) | Marked lightcurve |
|---|---|---|---|---|---|---|---|
| A | 7095 | 6145 | 10 | 10 | 0.14% | 0.16% | 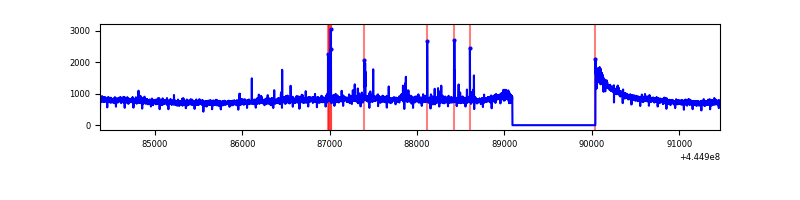 |
| B | 7095 | 6145 | 6 | 6 | 0.08% | 0.10% | 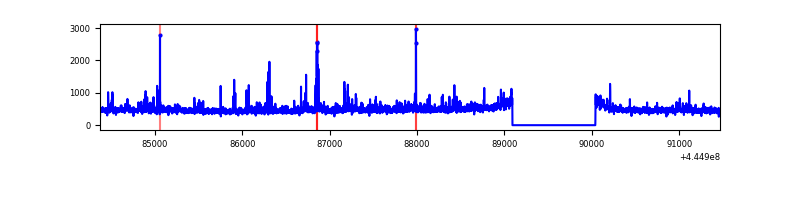 |
| C | 7096 | 6146 | 152 | 152 | 2.14% | 2.47% | 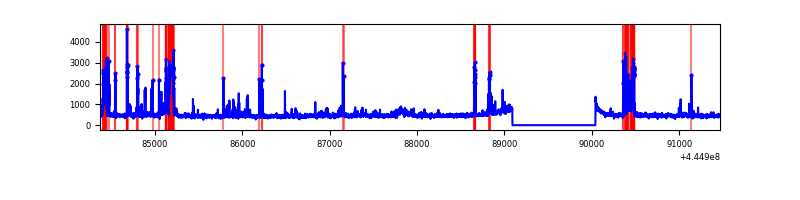 |
| D | 7095 | 6145 | 640 | 640 | 9.02% | 10.41% | 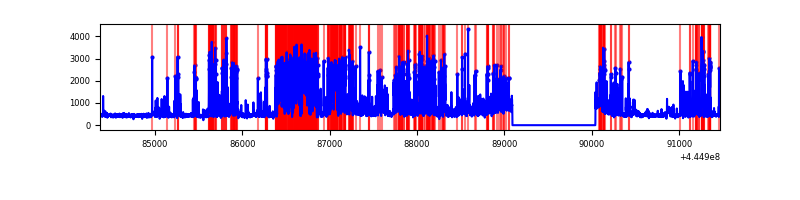 |
Top three noisy pixels from each quadrant. If the there are fewer than three noisy pixels in the level2.evt file, extra rows are filled as -1
| Pixel properties | Quadrant properties | ||||||
|---|---|---|---|---|---|---|---|
| Quadrant | DetID | PixID | Counts | Sigma | Mean | Median | Sigma |
| A | 10 | 83 | 2196520 | 15204.14 | 699 | 683 | 144.4 |
| A | 13 | 248 | 54883 | 375.28 | 699 | 683 | 144.4 |
| A | 0 | 243 | 28135 | 190.08 | 699 | 683 | 144.4 |
| B | 3 | 112 | 165758 | 1201.08 | 702 | 680 | 137.4 |
| B | 4 | 171 | 53256 | 382.53 | 702 | 680 | 137.4 |
| B | 0 | 246 | 20844 | 146.71 | 702 | 680 | 137.4 |
| C | 12 | 2 | 747133 | 4593.12 | 691 | 694 | 162.5 |
| C | 3 | 233 | 69784 | 425.14 | 691 | 694 | 162.5 |
| C | 2 | 14 | 10808 | 62.24 | 691 | 694 | 162.5 |
| D | 13 | 249 | 1949539 | 11678.28 | 668 | 647 | 166.9 |
| D | 2 | 249 | 263020 | 1572.21 | 668 | 647 | 166.9 |
| D | 4 | 221 | 147082 | 877.48 | 668 | 647 | 166.9 |
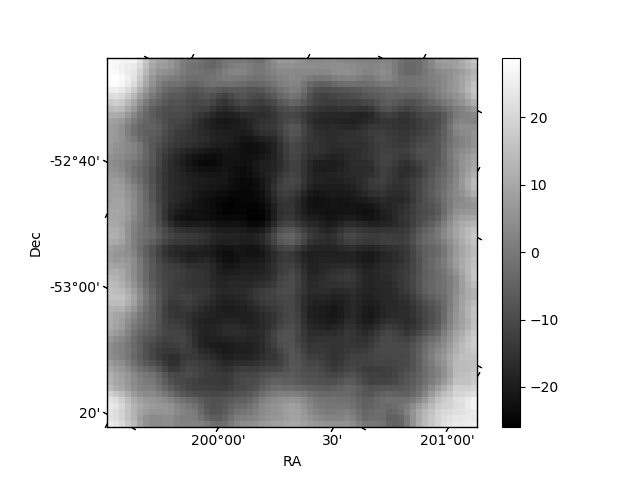
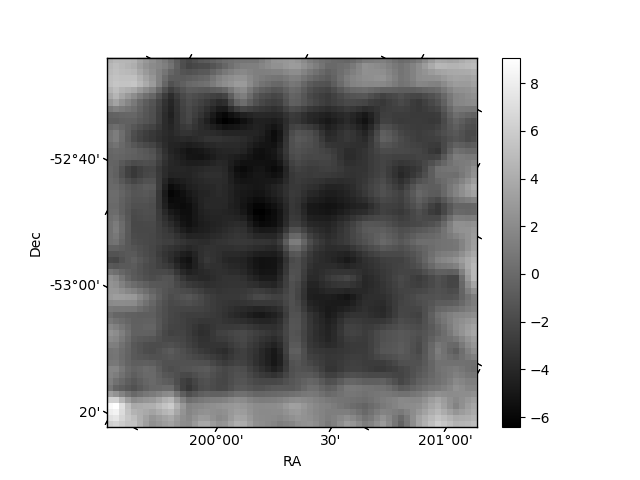
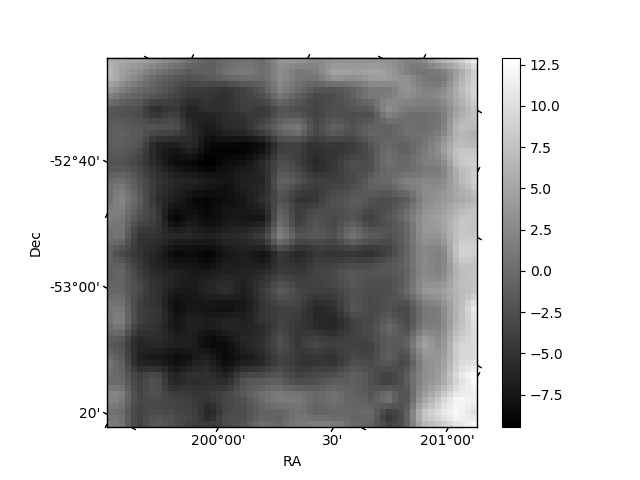
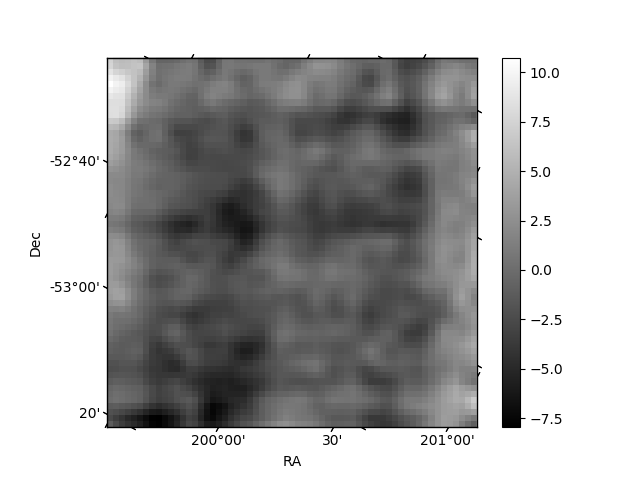
Histogram calculated using DETX and DETY for each event in the final _common_clean file
| Quadrant A | 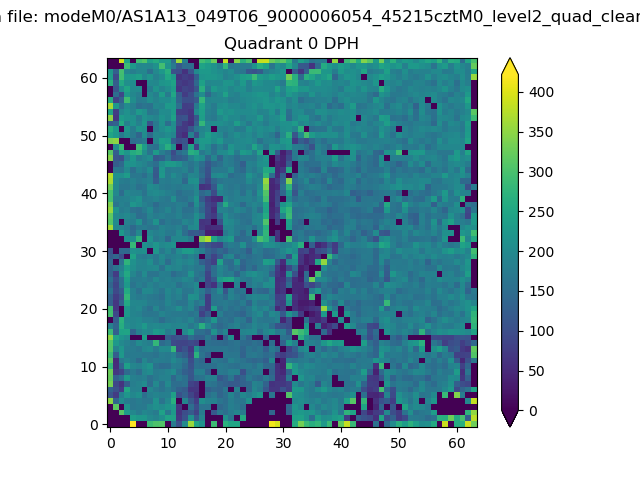 |
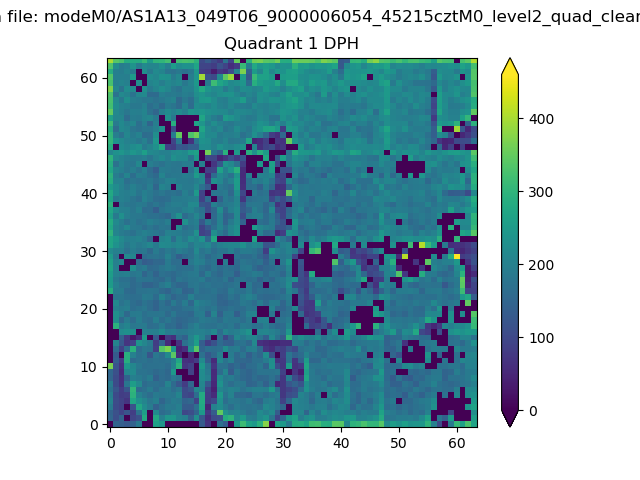 |
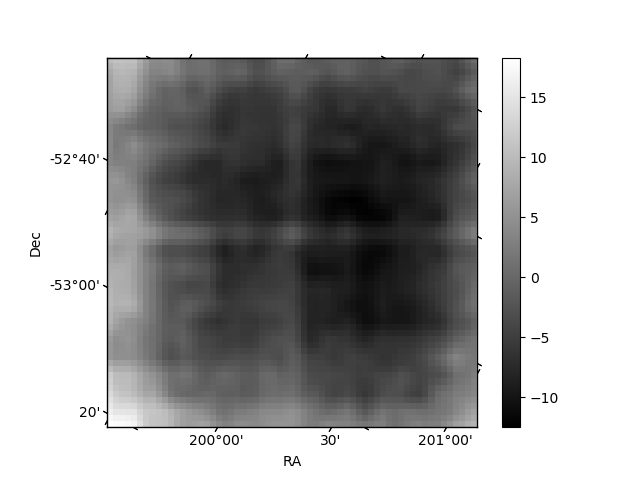
Quadrant B |
|---|---|---|---|
| Quadrant D | 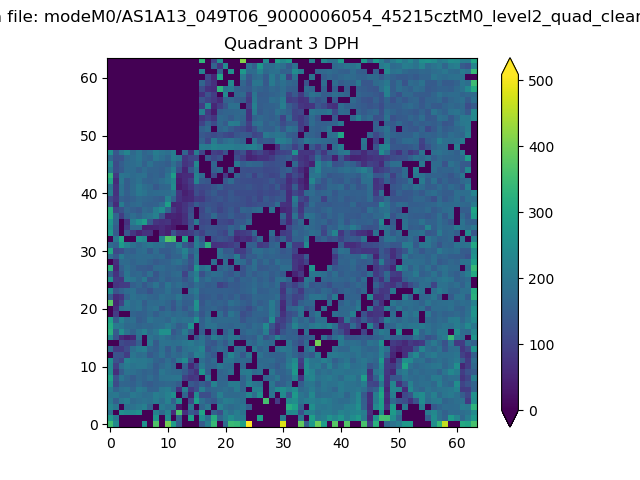 |
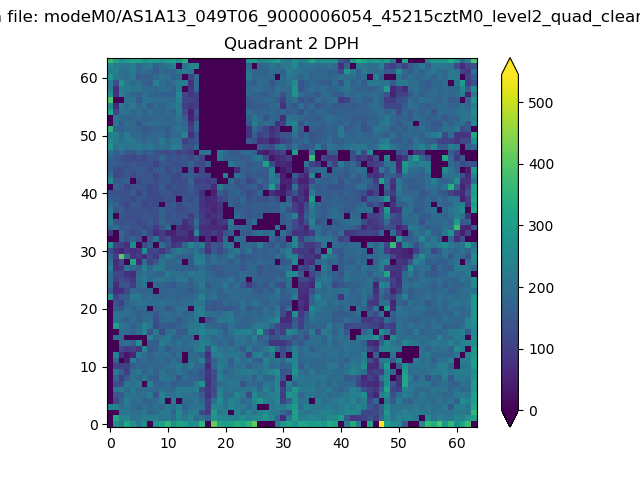 |
Quadrant C |
| Plot type | Count rate plots | Images |
|---|---|---|
| Comparison with Poisson distribution Blue bars denote a histogram of data divided into 1 sec bins. Red curve is a Poisson curve with rate = median count rate of data. |
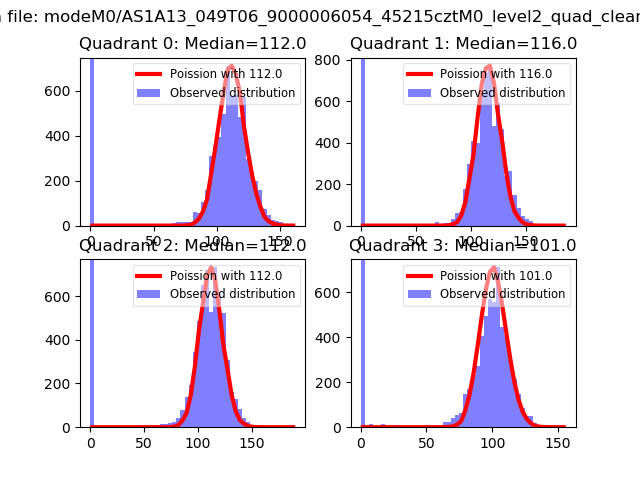 |
 |
| Quadrant-wise count rates Data is divided into 100 sec bins |
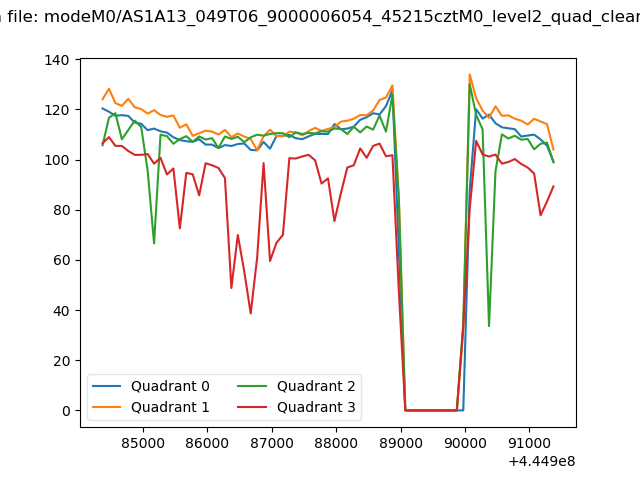 |
|
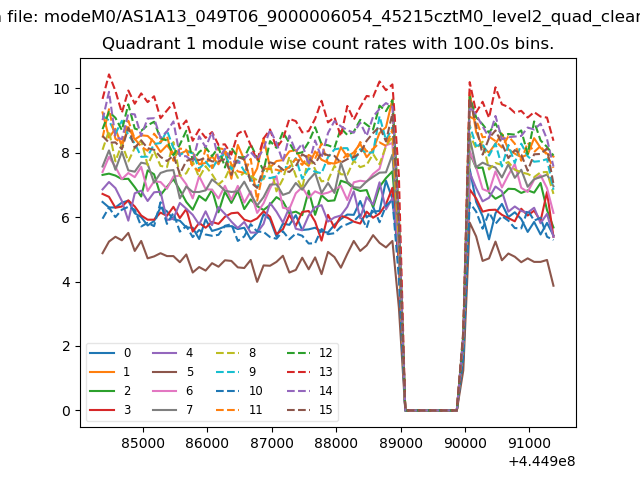
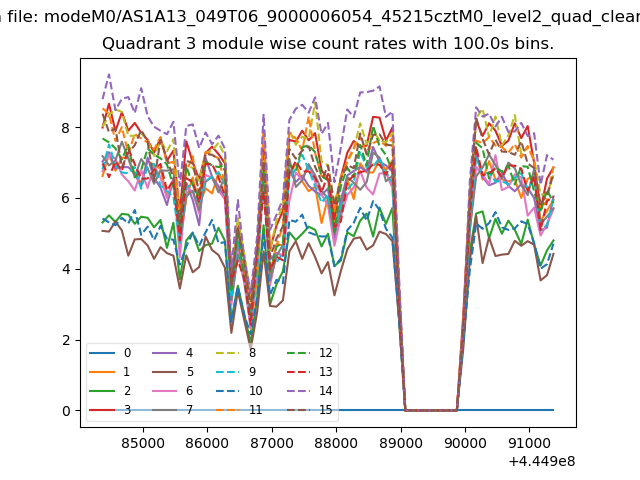
| Module-wise count rates for Quadrant A Data is divided into 100 sec bins |
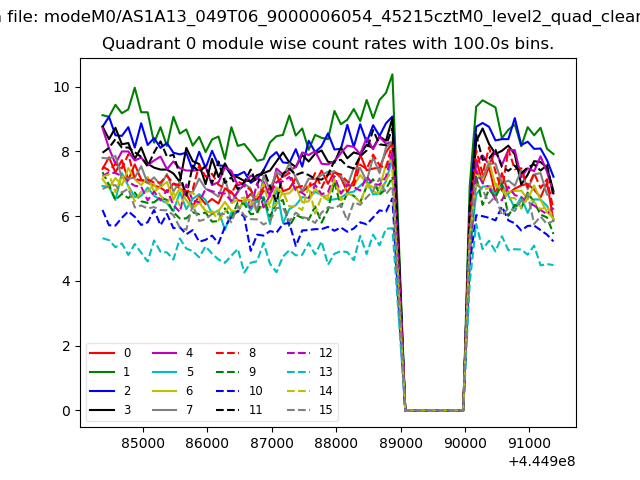 |
 |
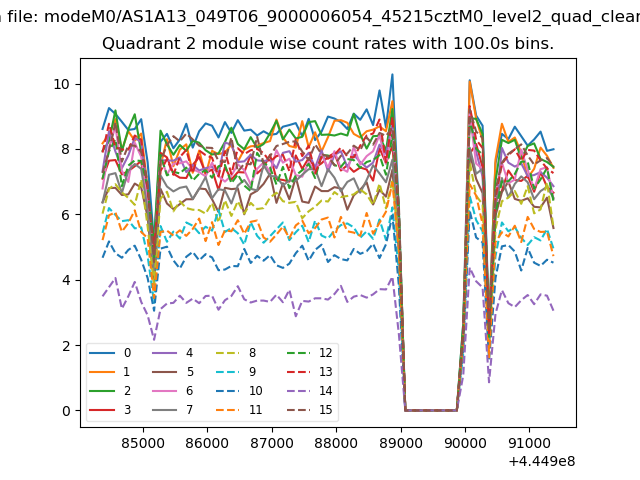
| Module-wise count rates for Quadrant B Data is divided into 100 sec bins |
 |
 |
| Module-wise count rates for Quadrant C Data is divided into 100 sec bins |
 |
 |
| Module-wise count rates for Quadrant D Data is divided into 100 sec bins |
 |
 |
| Parameter | Plot |
|---|---|
| CZT HV Monitor | 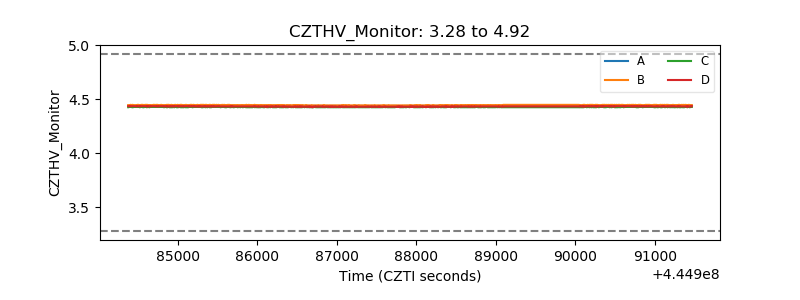 |
| D_VDD | 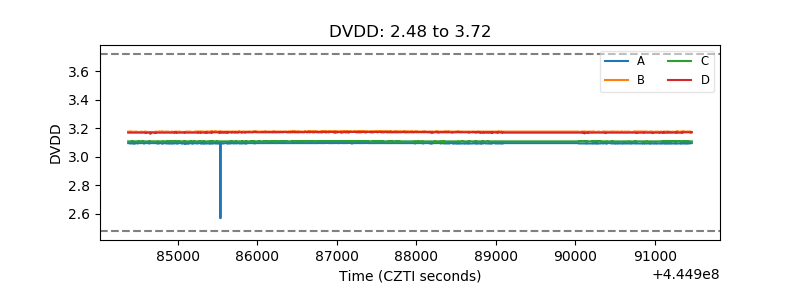 |
| Temperature 1 | 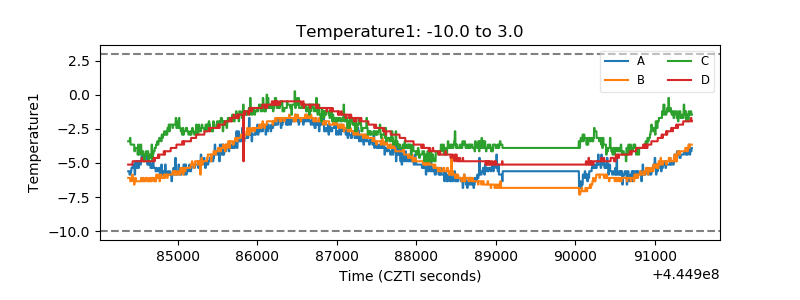 |
| Veto HV Monitor | 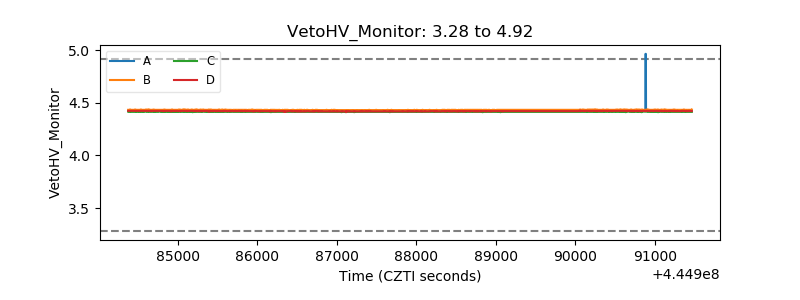 |
| Veto LLD | 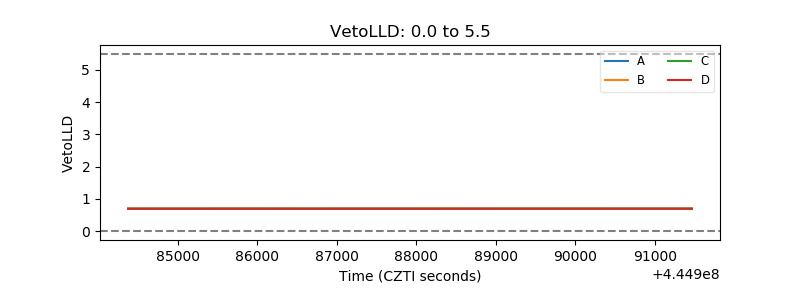 |
| Alpha Counter | 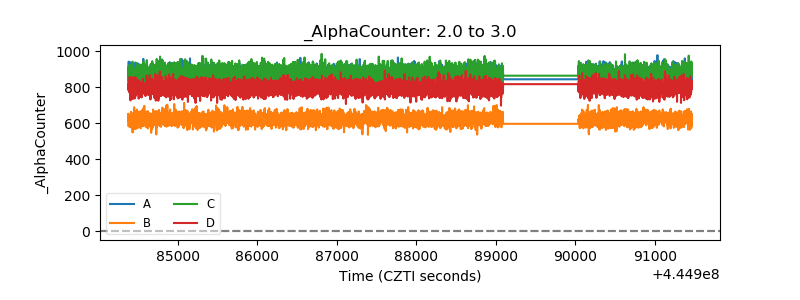 |
| _CPM_Rate | 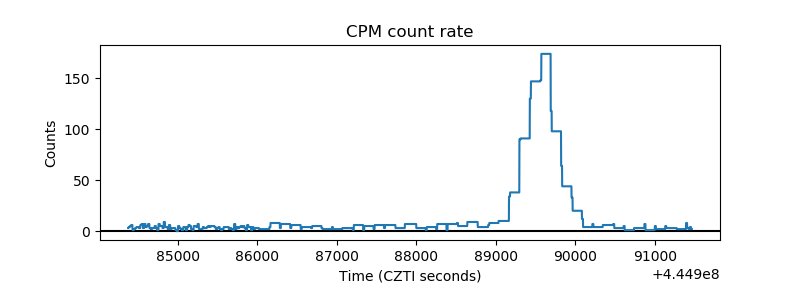 |
| CZT Counter | 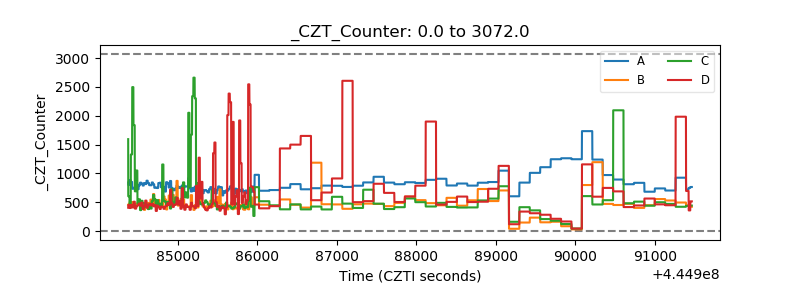 |
| +2.5 Volts monitor | 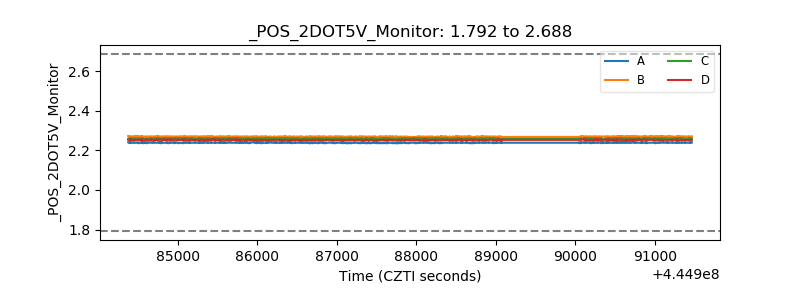 |
| +5 Volts monitor | 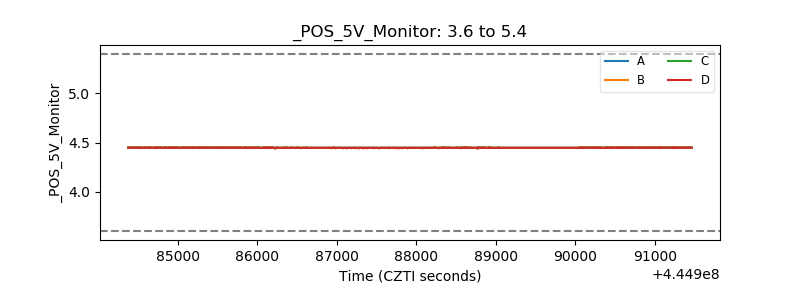 |
| _ROLL_ROT | 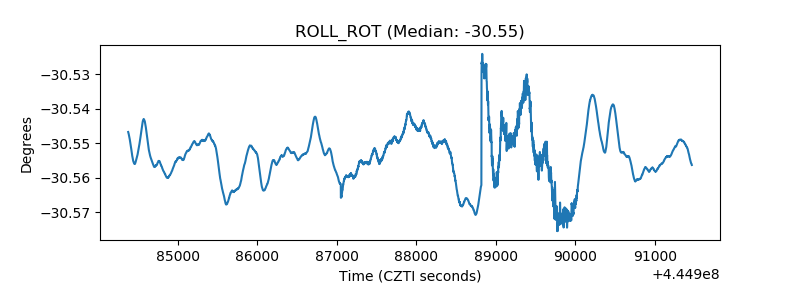 |
| _Roll_DEC | 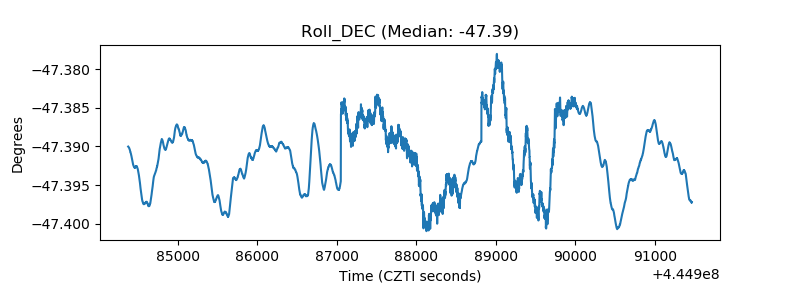 |
| _Roll_RA | 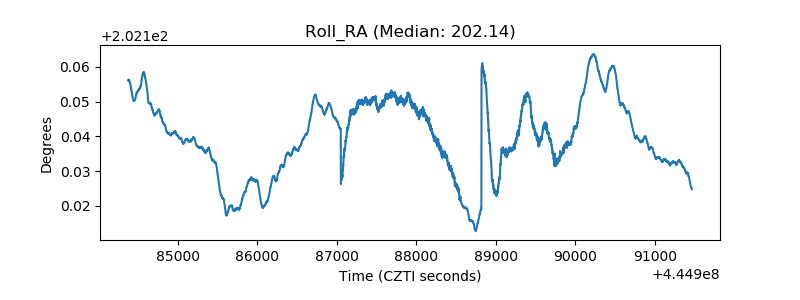 |
| Veto Counter | 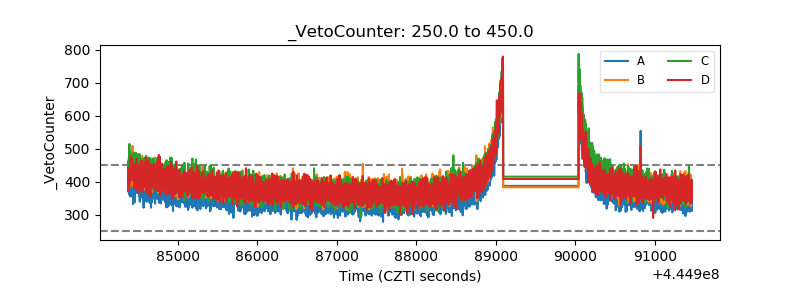 |