| Param | Original file | Final file |
|---|---|---|
| Filename | modeM0/AS1A13_049T06_9000006054_45393cztM0_level2.fits | modeM0/AS1A13_049T06_9000006054_45393cztM0_level2_quad_clean.evt |
| Size (bytes) | 567,872,640 | 123,672,960 |
| Size | 541.6 MB | 117.9 MB |
| Events in quadrant A | 6,549,462 | 814,718 |
| Events in quadrant B | 3,846,867 | 843,405 |
| Events in quadrant C | 4,001,711 | 818,188 |
| Events in quadrant D | 6,027,363 | 734,081 |
| Mode M0 | |||
|---|---|---|---|
| Quadrant | BADHDUFLAG | Total packets | Discarded packets |
| A | 0 | 24281 | 0 |
| B | 0 | 16760 | 0 |
| C | 0 | 17346 | 0 |
| D | 0 | 23191 | 0 |
| Mode SS | |||
|---|---|---|---|
| Quadrant | BADHDUFLAG | Total packets | Discarded packets |
| A | 0 | 152 | 0 |
| B | 0 | 152 | 0 |
| C | 0 | 152 | 0 |
| D | 0 | 152 | 0 |
| Quadrant | Total seconds | Saturated seconds | Saturation percentage |
|---|---|---|---|
| A | 7681 | 174 | 2.265330% |
| B | 7681 | 139 | 1.809660% |
| C | 7681 | 86 | 1.119646% |
| D | 7681 | 341 | 4.439526% |
Noise dominated data is calculated using 1-second bins in cleaned event files. If a bin has >2000 counts, and if more than 50% of those come from <1% of pixels, then it is considered to be noise-dominated and hence unusable.
| Quadrant | # 1 sec bins | Bins with >0 counts | Bins with >2000 counts | High rate bins dominated by noise | Noise dominated (total time) | Noise dominated (detector-on time) | Marked lightcurve |
|---|---|---|---|---|---|---|---|
| A | 7681 | 7681 | 8 | 8 | 0.10% | 0.10% | 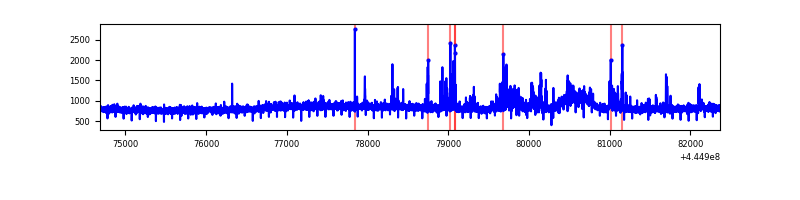 |
| B | 7681 | 7681 | 55 | 55 | 0.72% | 0.72% | 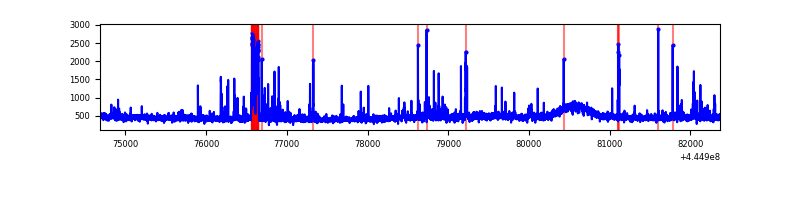 |
| C | 7681 | 7681 | 61 | 61 | 0.79% | 0.79% | 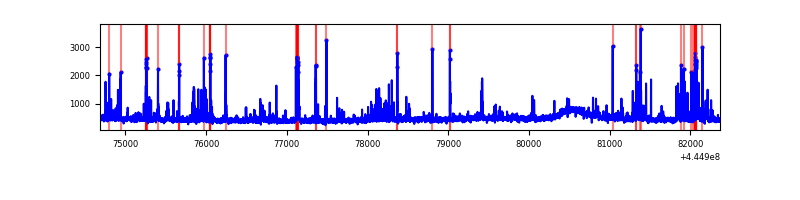 |
| D | 7681 | 7681 | 309 | 309 | 4.02% | 4.02% | 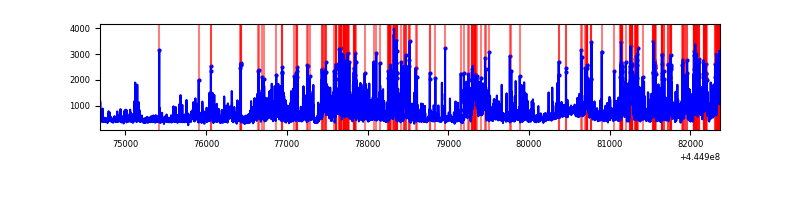 |
Top three noisy pixels from each quadrant. If the there are fewer than three noisy pixels in the level2.evt file, extra rows are filled as -1
| Pixel properties | Quadrant properties | ||||||
|---|---|---|---|---|---|---|---|
| Quadrant | DetID | PixID | Counts | Sigma | Mean | Median | Sigma |
| A | 10 | 83 | 2877776 | 15735.79 | 870 | 848 | 182.8 |
| A | 9 | 191 | 295347 | 1610.81 | 870 | 848 | 182.8 |
| A | 13 | 254 | 10710 | 53.94 | 870 | 848 | 182.8 |
| B | 0 | 199 | 156633 | 888.99 | 868 | 839 | 175.2 |
| B | 5 | 255 | 67176 | 378.53 | 868 | 839 | 175.2 |
| B | 15 | 201 | 60864 | 342.51 | 868 | 839 | 175.2 |
| C | 14 | 254 | 371877 | 1836.37 | 849 | 855 | 202.0 |
| C | 0 | 239 | 171630 | 845.25 | 849 | 855 | 202.0 |
| C | 3 | 233 | 66832 | 326.55 | 849 | 855 | 202.0 |
| D | 1 | 52 | 1902872 | 8945.16 | 843 | 816 | 212.6 |
| D | 2 | 249 | 394490 | 1851.41 | 843 | 816 | 212.6 |
| D | 12 | 233 | 121021 | 565.31 | 843 | 816 | 212.6 |
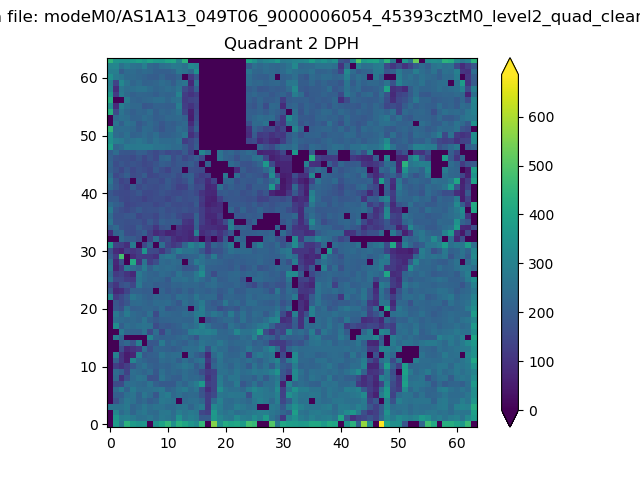
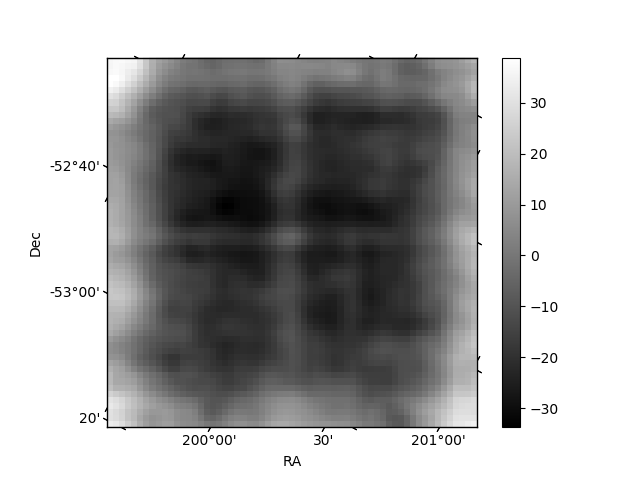
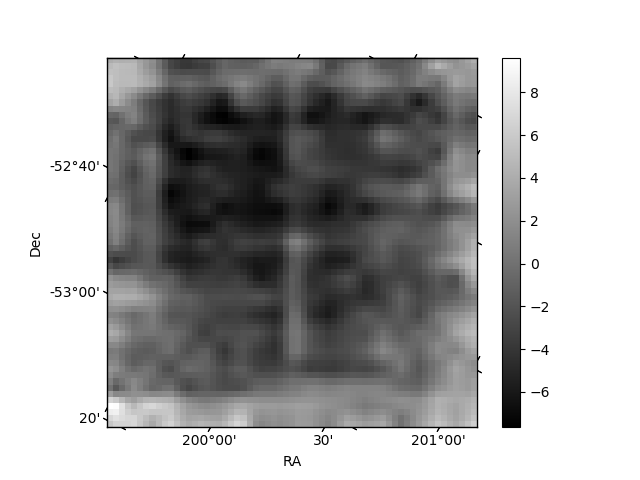
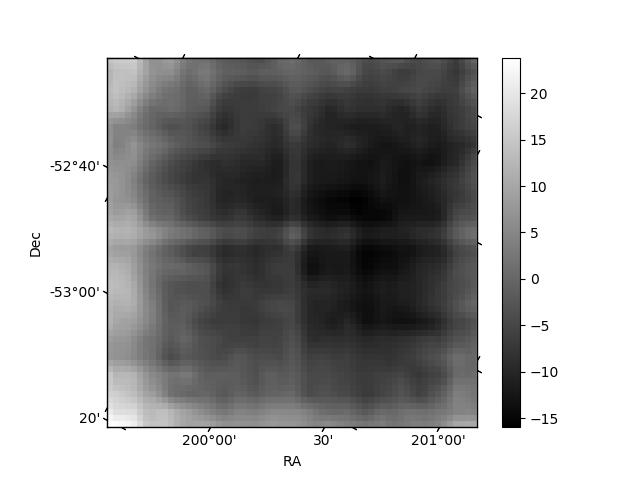
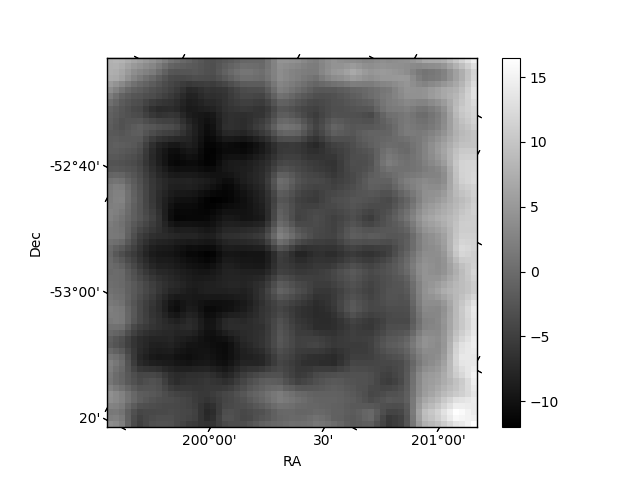
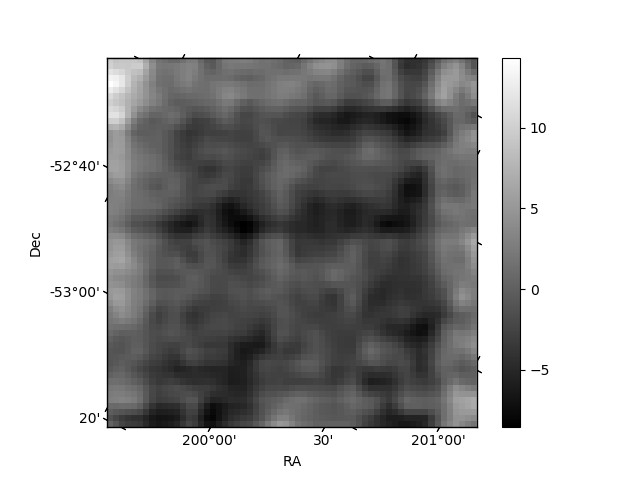
Histogram calculated using DETX and DETY for each event in the final _common_clean file
| Quadrant A | 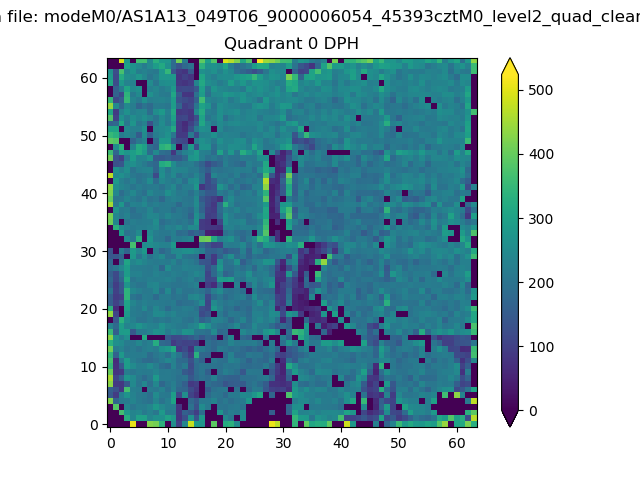 |
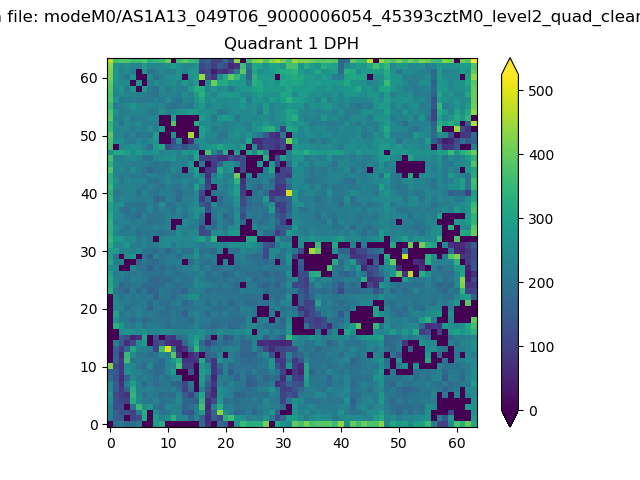 |
Quadrant B |
|---|---|---|---|
| Quadrant D | 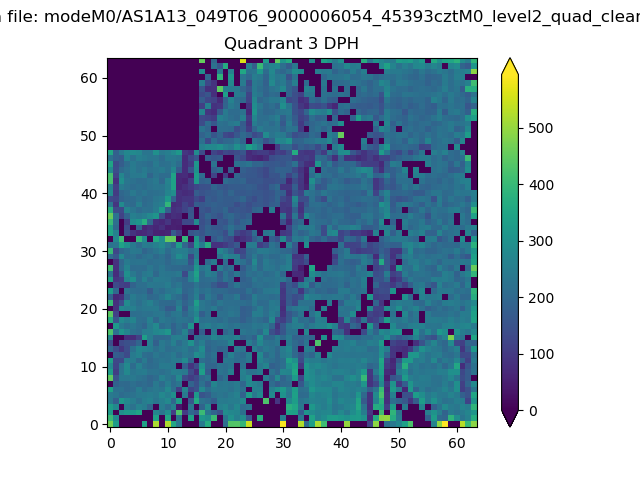 |
 |
Quadrant C |
| Plot type | Count rate plots | Images |
|---|---|---|
| Comparison with Poisson distribution Blue bars denote a histogram of data divided into 1 sec bins. Red curve is a Poisson curve with rate = median count rate of data. |
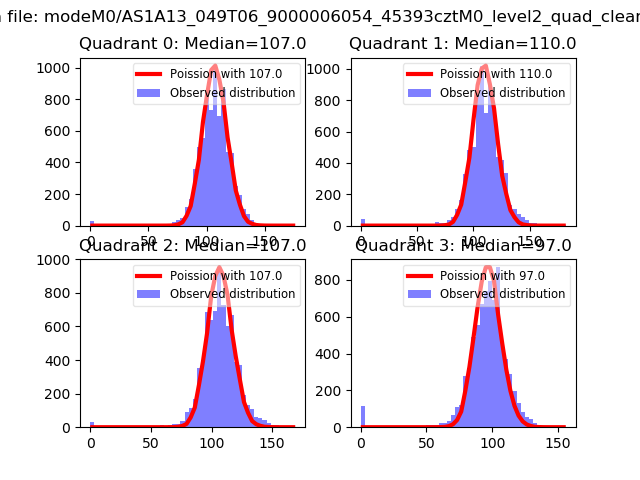 |
 |
| Quadrant-wise count rates Data is divided into 100 sec bins |
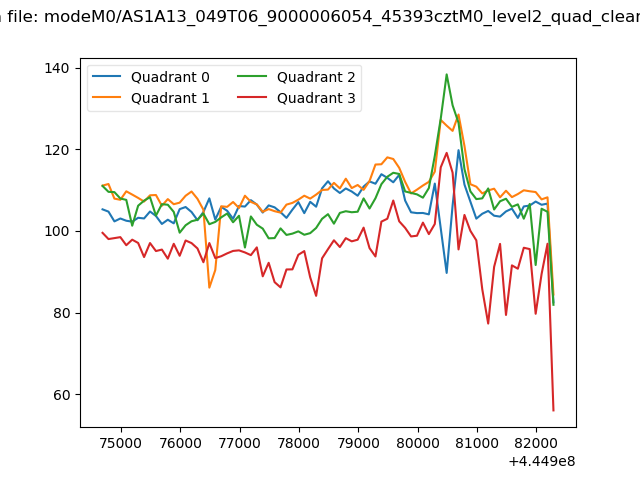 |
|
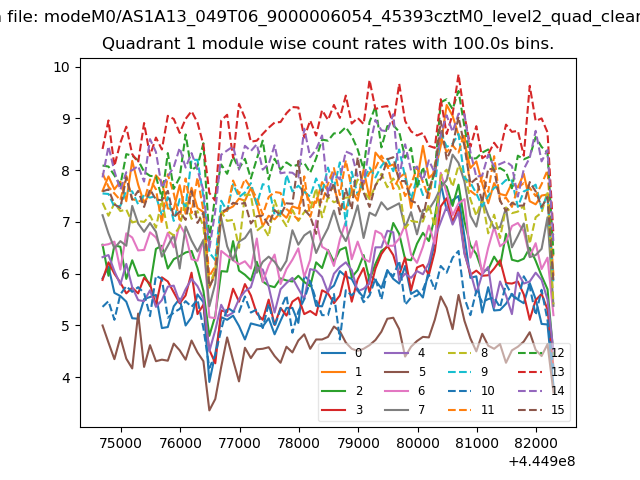
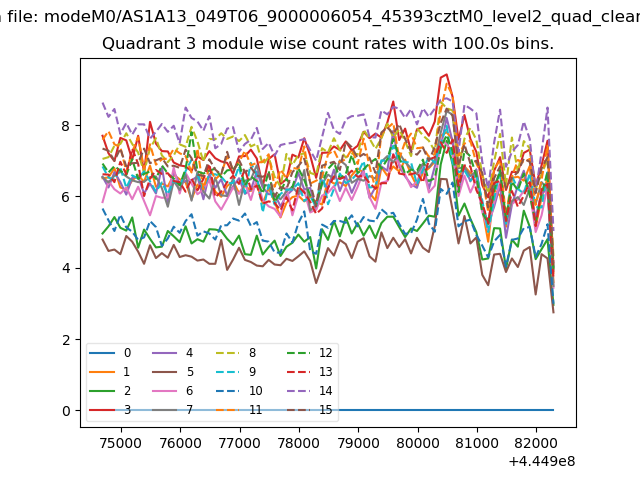
| Module-wise count rates for Quadrant A Data is divided into 100 sec bins |
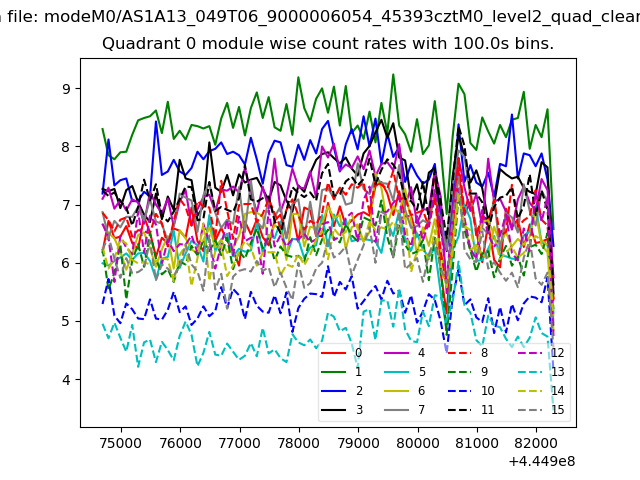 |
 |
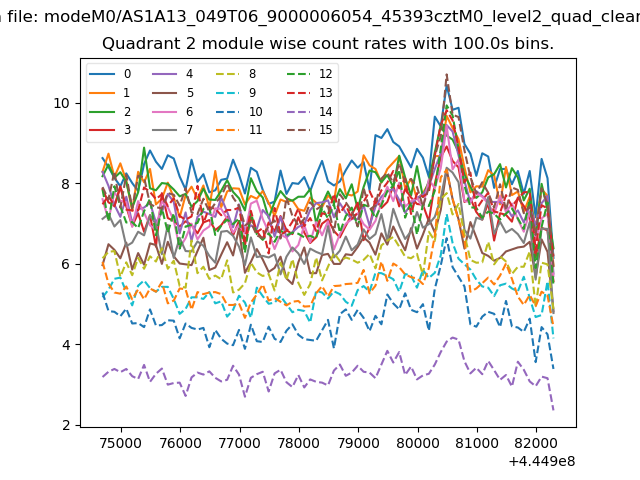
| Module-wise count rates for Quadrant B Data is divided into 100 sec bins |
 |
 |
| Module-wise count rates for Quadrant C Data is divided into 100 sec bins |
 |
 |
| Module-wise count rates for Quadrant D Data is divided into 100 sec bins |
 |
 |
| Parameter | Plot |
|---|---|
| CZT HV Monitor | 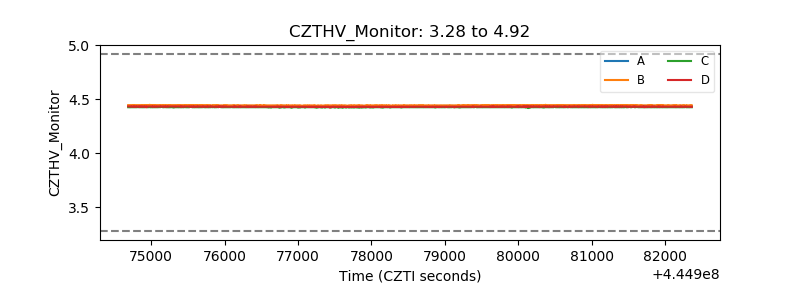 |
| D_VDD | 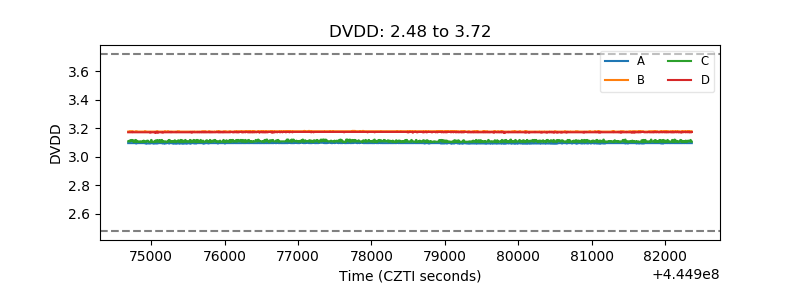 |
| Temperature 1 | 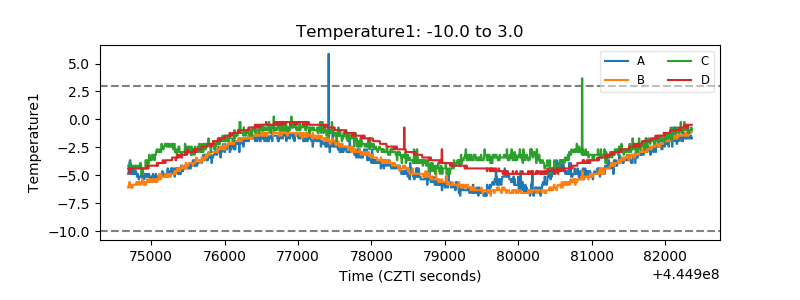 |
| Veto HV Monitor | 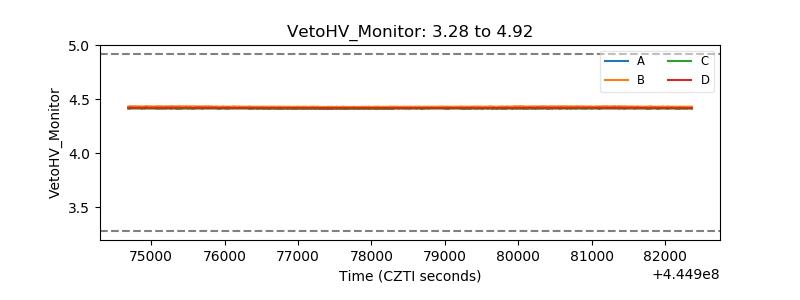 |
| Veto LLD | 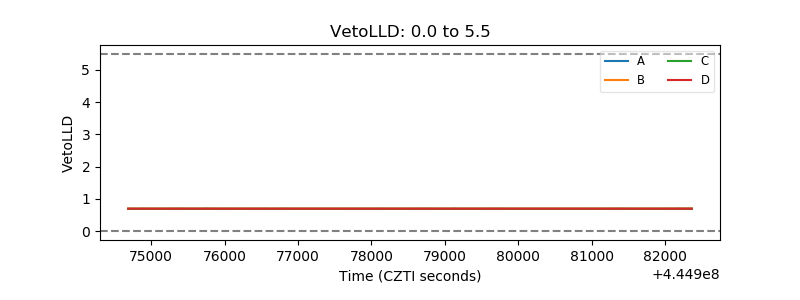 |
| Alpha Counter | 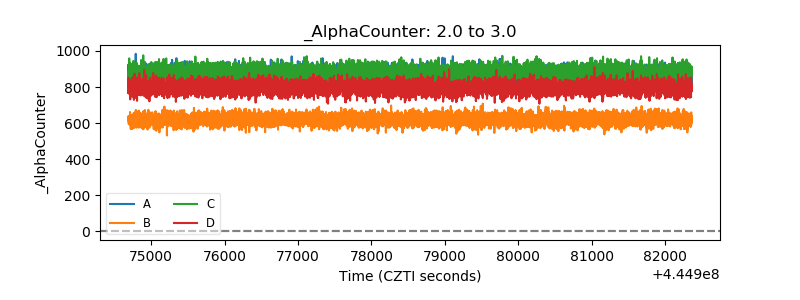 |
| _CPM_Rate | 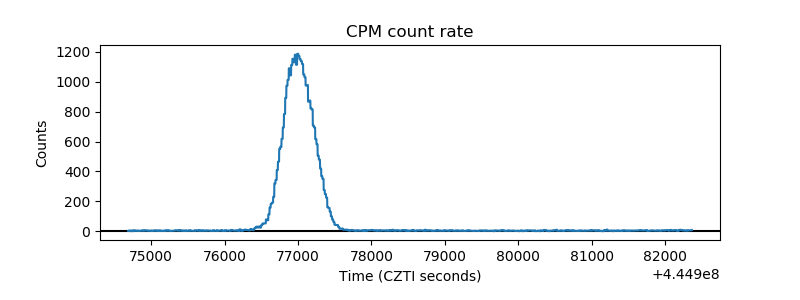 |
| CZT Counter | 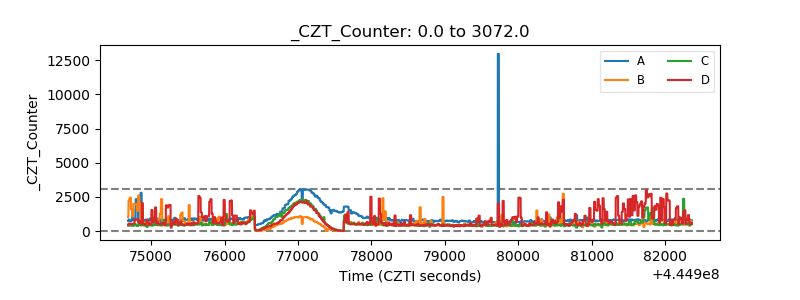 |
| +2.5 Volts monitor | 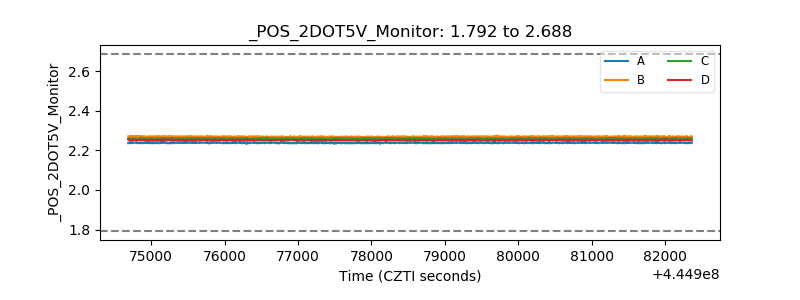 |
| +5 Volts monitor | 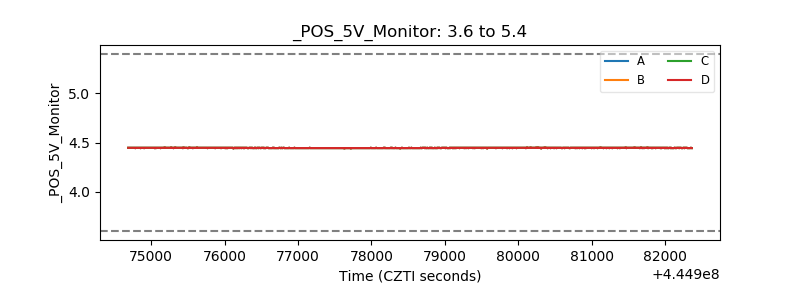 |
| _ROLL_ROT | 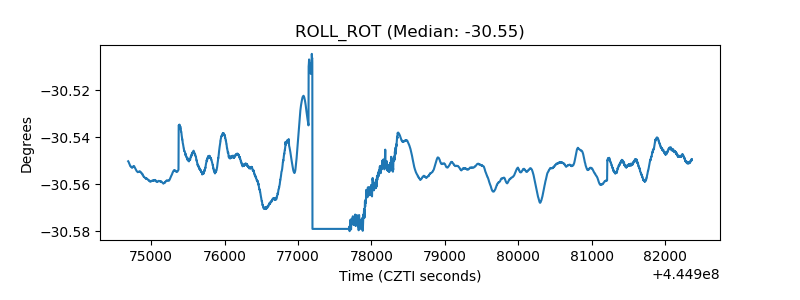 |
| _Roll_DEC | 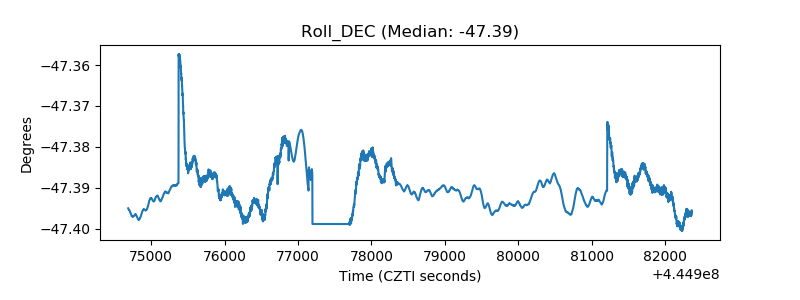 |
| _Roll_RA | 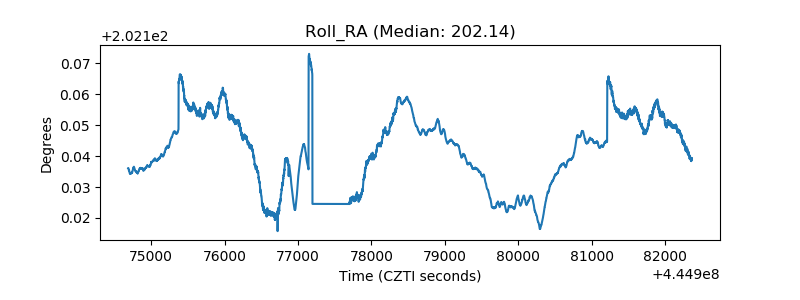 |
| Veto Counter | 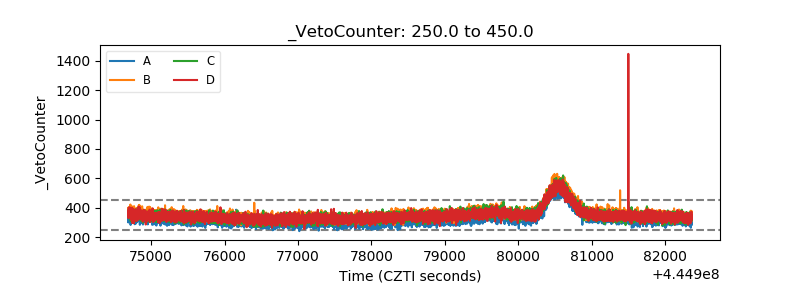 |