| Param | Original file | Final file |
|---|---|---|
| Filename | modeM0/AS1A13_049T06_9000006054_45395cztM0_level2.fits | modeM0/AS1A13_049T06_9000006054_45395cztM0_level2_quad_clean.evt |
| Size (bytes) | 580,017,600 | 108,967,680 |
| Size | 553.1 MB | 103.9 MB |
| Events in quadrant A | 6,077,204 | 721,002 |
| Events in quadrant B | 3,596,724 | 748,695 |
| Events in quadrant C | 3,847,652 | 730,611 |
| Events in quadrant D | 7,411,232 | 615,500 |
| Mode M0 | |||
|---|---|---|---|
| Quadrant | BADHDUFLAG | Total packets | Discarded packets |
| A | 0 | 22352 | 1 |
| B | 0 | 15455 | 1 |
| C | 0 | 16328 | 1 |
| D | 0 | 26835 | 1 |
| Mode M9 | |||
|---|---|---|---|
| Quadrant | BADHDUFLAG | Total packets | Discarded packets |
| A | 0 | 3 | 0 |
| B | 0 | 3 | 0 |
| C | 0 | 3 | 0 |
| D | 0 | 3 | 0 |
| Mode SS | |||
|---|---|---|---|
| Quadrant | BADHDUFLAG | Total packets | Discarded packets |
| A | 0 | 140 | 0 |
| B | 0 | 140 | 0 |
| C | 0 | 140 | 0 |
| D | 0 | 140 | 0 |
| Quadrant | Total seconds | Saturated seconds | Saturation percentage |
|---|---|---|---|
| A | 6939 | 273 | 3.934284% |
| B | 6940 | 218 | 3.141210% |
| C | 6940 | 145 | 2.089337% |
| D | 6940 | 910 | 13.112392% |
Noise dominated data is calculated using 1-second bins in cleaned event files. If a bin has >2000 counts, and if more than 50% of those come from <1% of pixels, then it is considered to be noise-dominated and hence unusable.
| Quadrant | # 1 sec bins | Bins with >0 counts | Bins with >2000 counts | High rate bins dominated by noise | Noise dominated (total time) | Noise dominated (detector-on time) | Marked lightcurve |
|---|---|---|---|---|---|---|---|
| A | 7164 | 6940 | 55 | 55 | 0.77% | 0.79% | 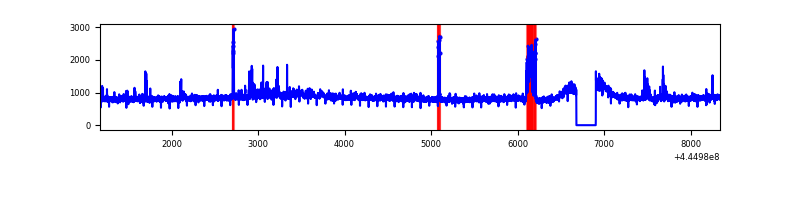 |
| B | 7165 | 6940 | 36 | 36 | 0.50% | 0.52% | 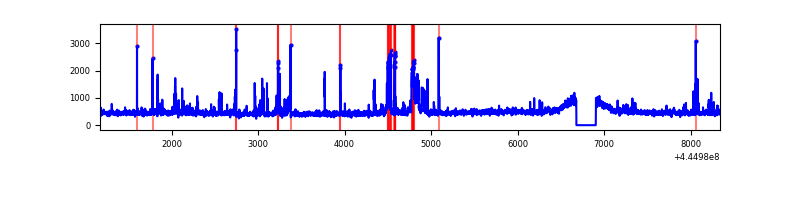 |
| C | 7165 | 6941 | 72 | 72 | 1.00% | 1.04% | 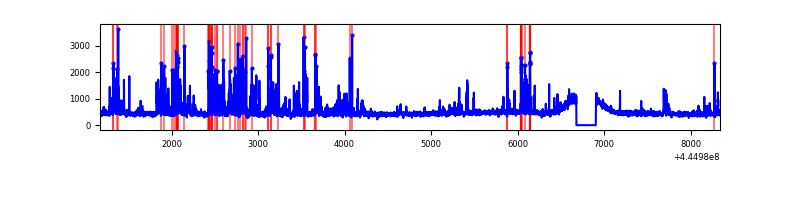 |
| D | 7165 | 6941 | 754 | 754 | 10.52% | 10.86% | 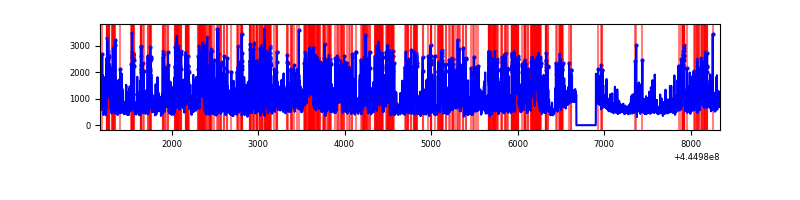 |
Top three noisy pixels from each quadrant. If the there are fewer than three noisy pixels in the level2.evt file, extra rows are filled as -1
| Pixel properties | Quadrant properties | ||||||
|---|---|---|---|---|---|---|---|
| Quadrant | DetID | PixID | Counts | Sigma | Mean | Median | Sigma |
| A | 10 | 83 | 2699396 | 16338.79 | 786 | 768 | 165.2 |
| A | 9 | 191 | 152682 | 919.76 | 786 | 768 | 165.2 |
| A | 7 | 3 | 118874 | 715.07 | 786 | 768 | 165.2 |
| B | 15 | 201 | 219730 | 1388.12 | 784 | 759 | 157.7 |
| B | 0 | 186 | 54259 | 339.15 | 784 | 759 | 157.7 |
| B | 4 | 67 | 46672 | 291.06 | 784 | 759 | 157.7 |
| C | 14 | 254 | 658809 | 3589.02 | 769 | 774 | 183.3 |
| C | 3 | 233 | 63094 | 339.9 | 769 | 774 | 183.3 |
| C | 0 | 239 | 53324 | 286.62 | 769 | 774 | 183.3 |
| D | 1 | 52 | 3068334 | 16134.87 | 743 | 720 | 190.1 |
| D | 2 | 249 | 587574 | 3086.7 | 743 | 720 | 190.1 |
| D | 5 | 222 | 250654 | 1314.59 | 743 | 720 | 190.1 |
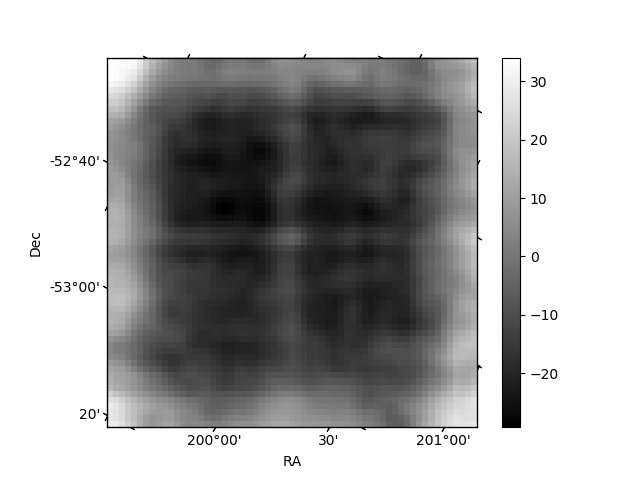
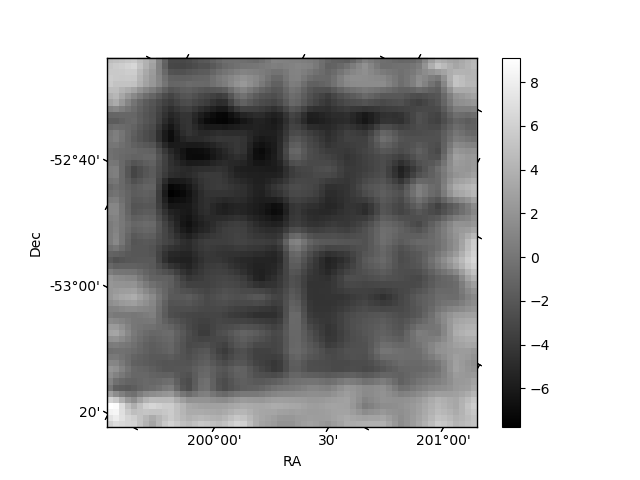
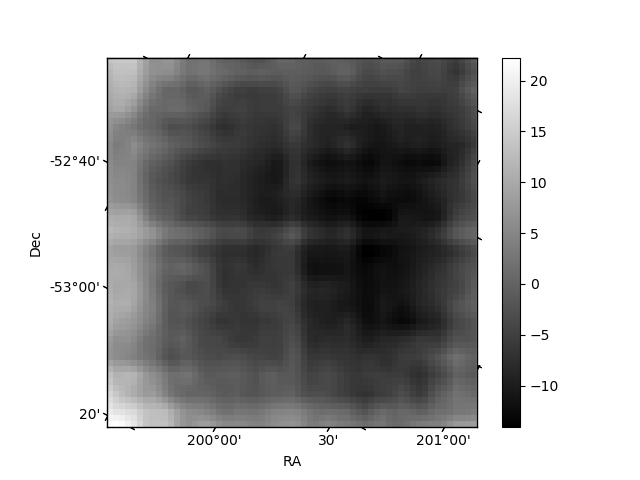
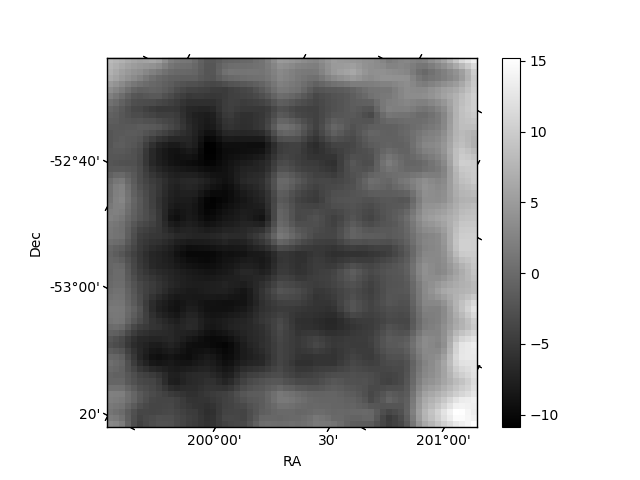
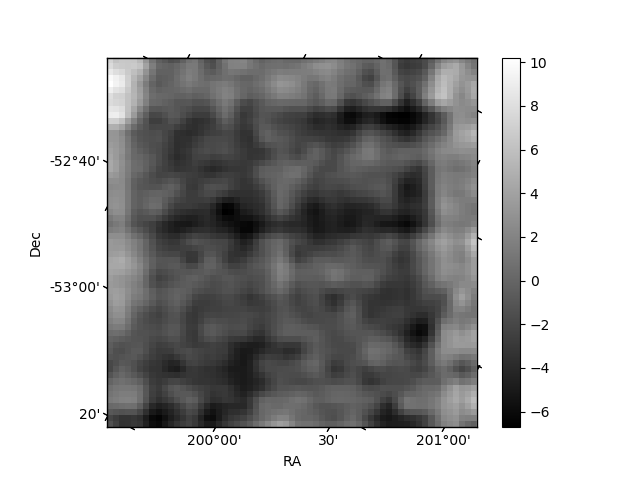
Histogram calculated using DETX and DETY for each event in the final _common_clean file
| Quadrant A | 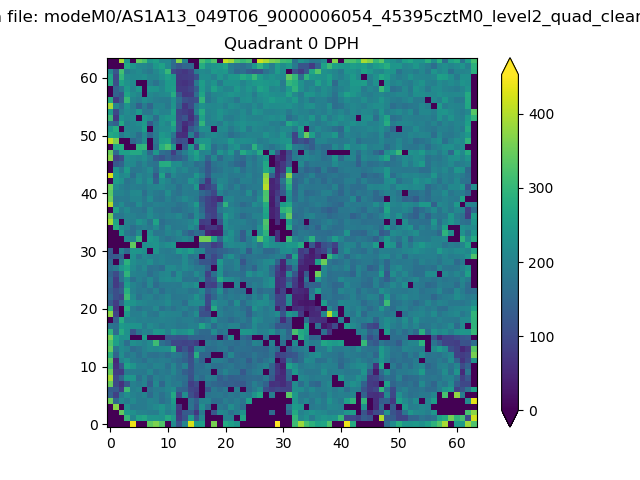 |
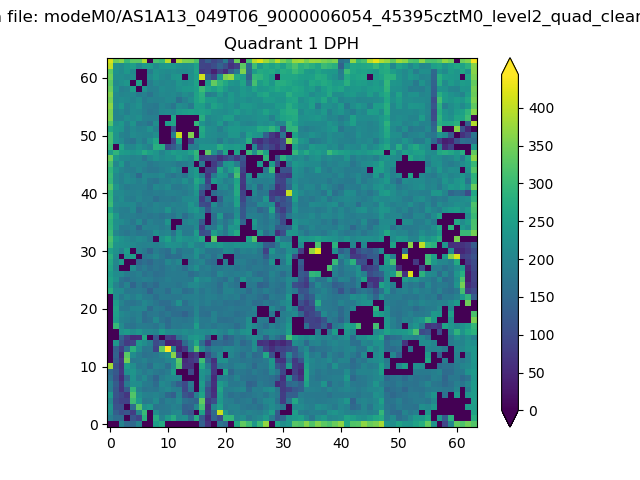 |
Quadrant B |
|---|---|---|---|
| Quadrant D | 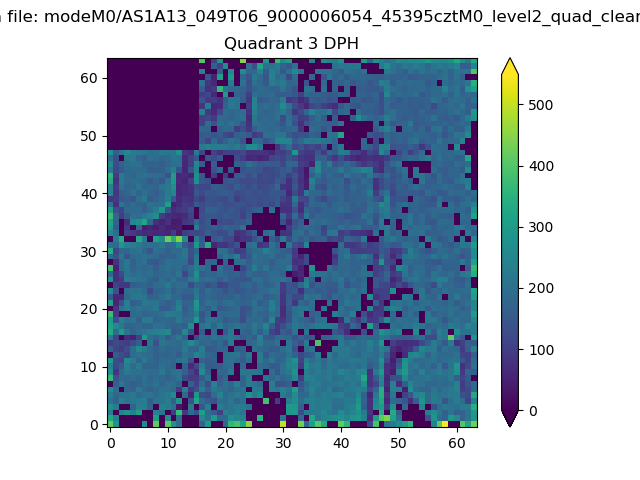 |
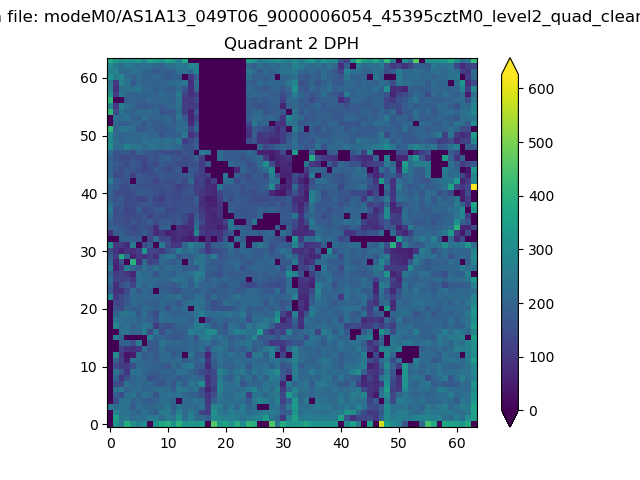 |
Quadrant C |
| Plot type | Count rate plots | Images |
|---|---|---|
| Comparison with Poisson distribution Blue bars denote a histogram of data divided into 1 sec bins. Red curve is a Poisson curve with rate = median count rate of data. |
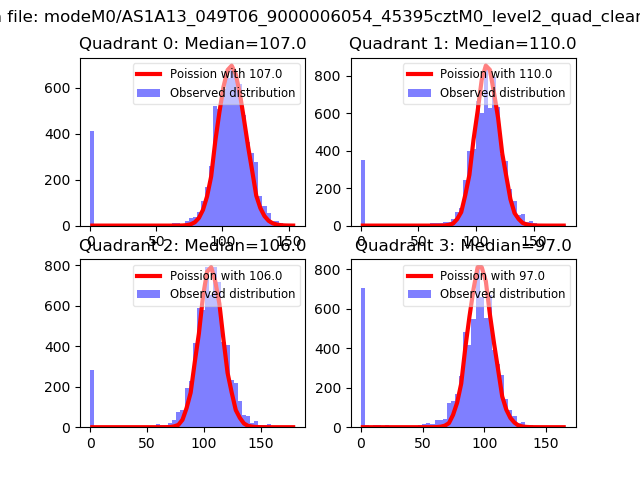 |
 |
| Quadrant-wise count rates Data is divided into 100 sec bins |
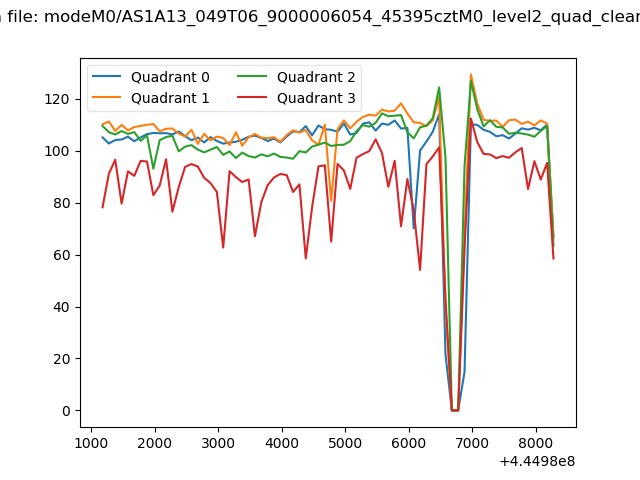 |
|
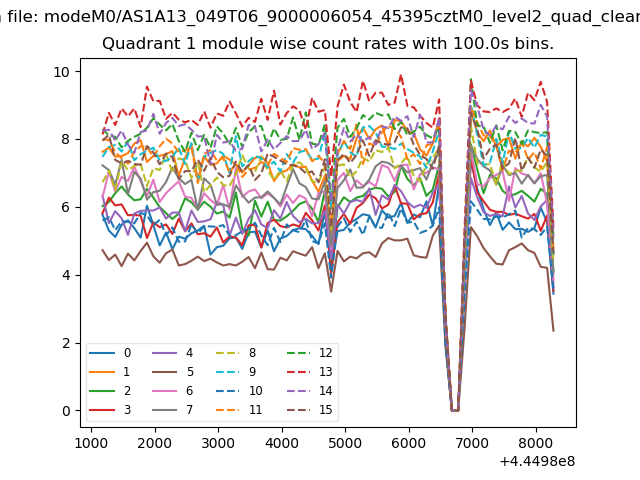
| Module-wise count rates for Quadrant A Data is divided into 100 sec bins |
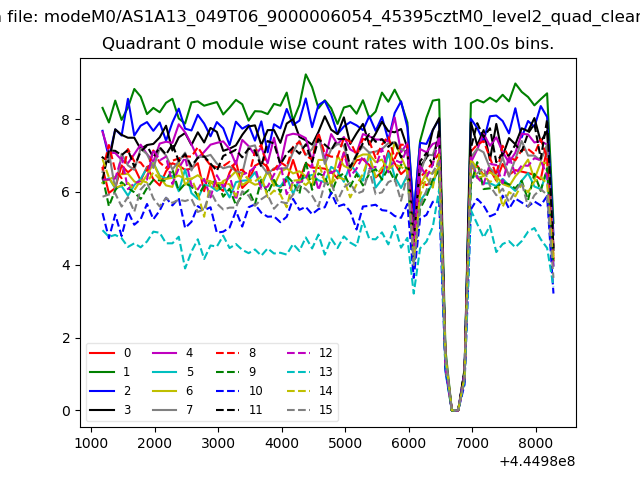 |
 |
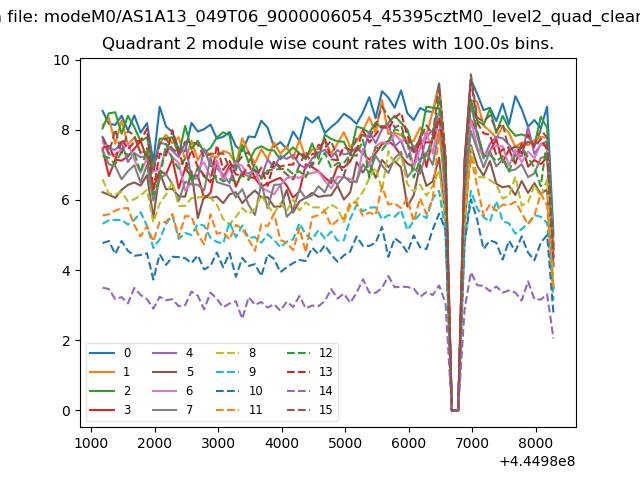
| Module-wise count rates for Quadrant B Data is divided into 100 sec bins |
 |
 |
| Module-wise count rates for Quadrant C Data is divided into 100 sec bins |
 |
 |
| Module-wise count rates for Quadrant D Data is divided into 100 sec bins |
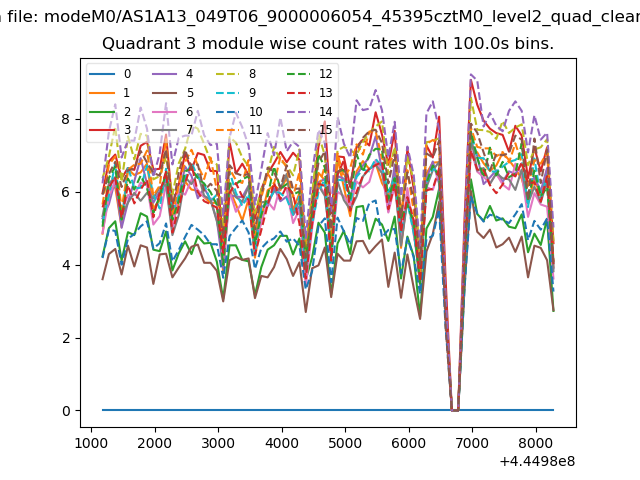 |
 |
| Parameter | Plot |
|---|---|
| CZT HV Monitor | 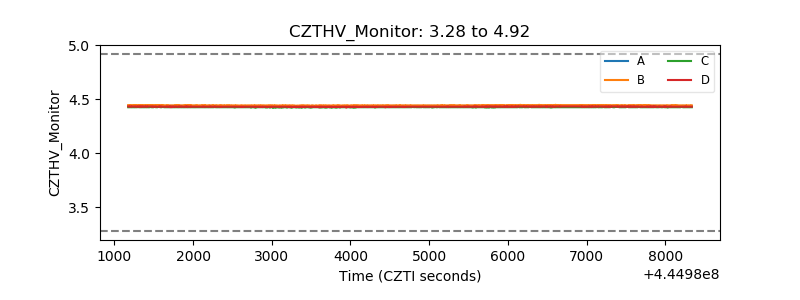 |
| D_VDD | 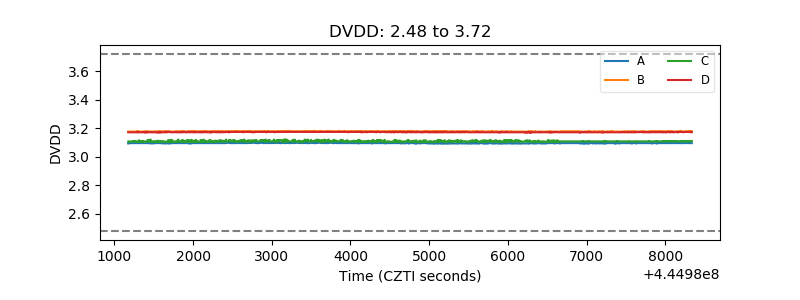 |
| Temperature 1 | 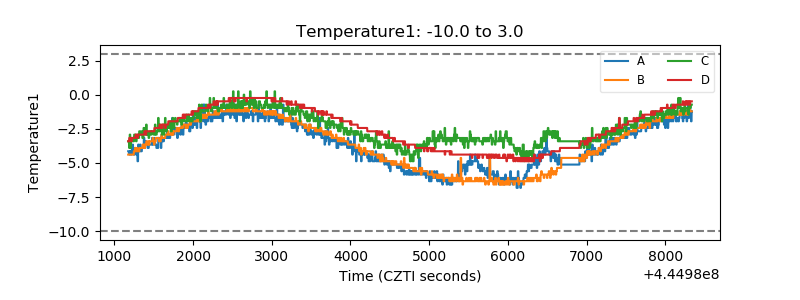 |
| Veto HV Monitor | 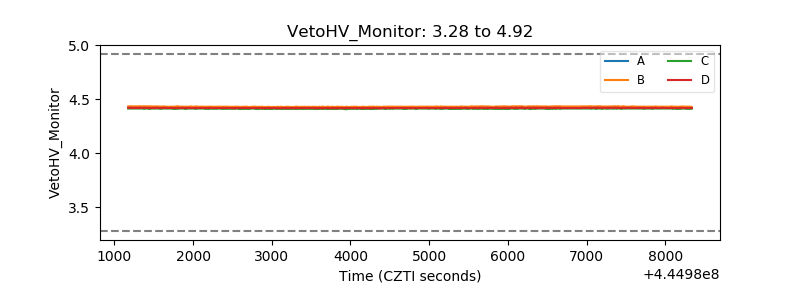 |
| Veto LLD | 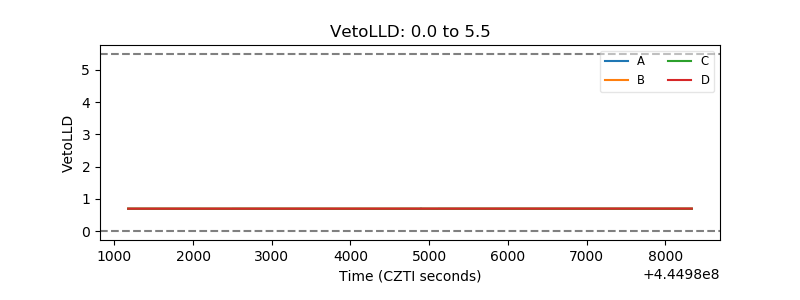 |
| Alpha Counter | 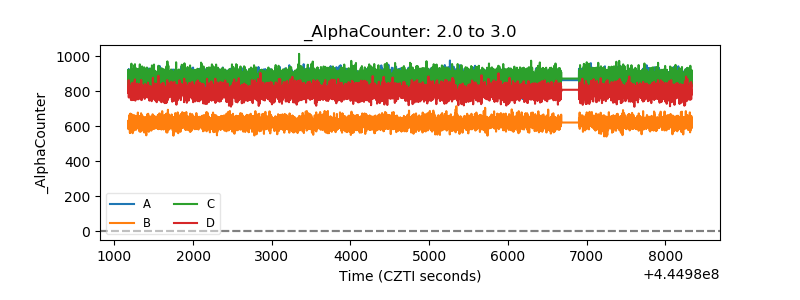 |
| _CPM_Rate | 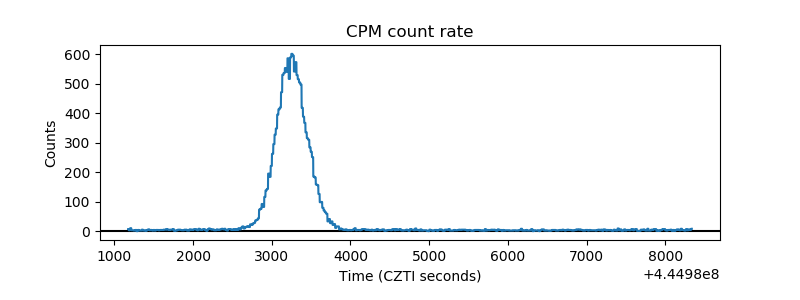 |
| CZT Counter | 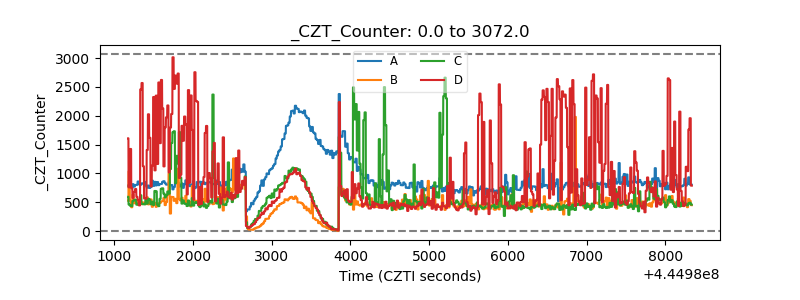 |
| +2.5 Volts monitor | 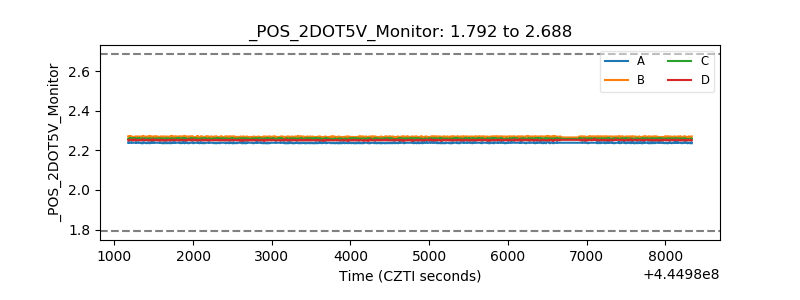 |
| +5 Volts monitor | 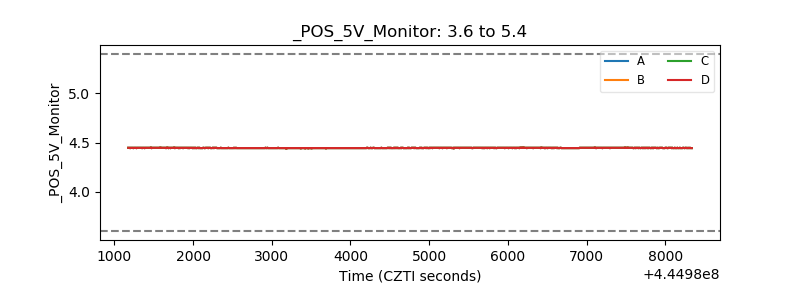 |
| _ROLL_ROT | 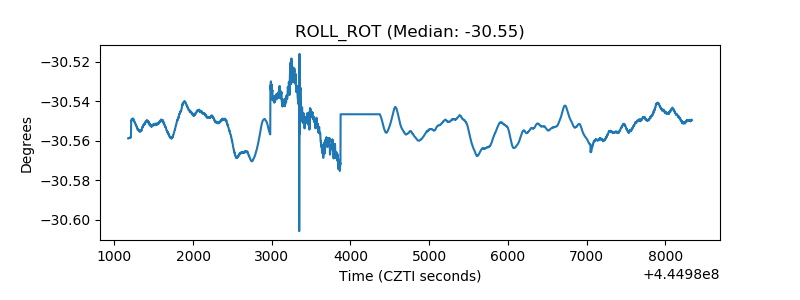 |
| _Roll_DEC | 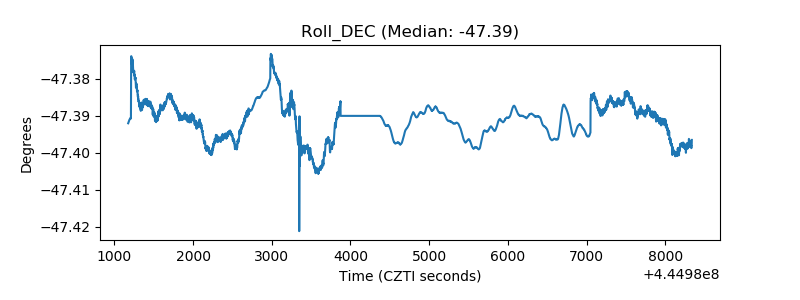 |
| _Roll_RA | 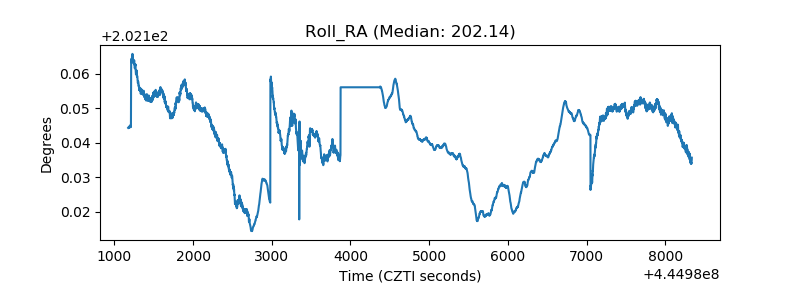 |
| Veto Counter | 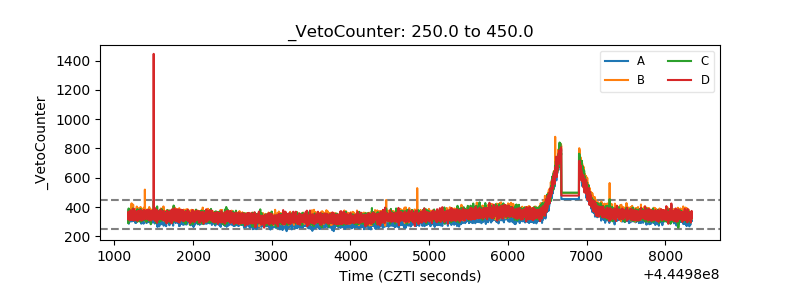 |