| Param | Original file | Final file |
|---|---|---|
| Filename | modeM0/AS1A13_049T06_9000006054_45396cztM0_level2.fits | modeM0/AS1A13_049T06_9000006054_45396cztM0_level2_quad_clean.evt |
| Size (bytes) | 467,242,560 | 80,199,360 |
| Size | 445.6 MB | 76.5 MB |
| Events in quadrant A | 4,406,082 | 548,881 |
| Events in quadrant B | 2,430,227 | 565,912 |
| Events in quadrant C | 3,096,971 | 523,896 |
| Events in quadrant D | 6,958,843 | 425,525 |
| Mode M0 | |||
|---|---|---|---|
| Quadrant | BADHDUFLAG | Total packets | Discarded packets |
| A | 0 | 16295 | 1 |
| B | 0 | 10885 | 1 |
| C | 0 | 12878 | 1 |
| D | 0 | 24312 | 1 |
| Mode M9 | |||
|---|---|---|---|
| Quadrant | BADHDUFLAG | Total packets | Discarded packets |
| A | 0 | 6 | 0 |
| B | 0 | 6 | 0 |
| C | 0 | 6 | 0 |
| D | 0 | 6 | 0 |
| Mode SS | |||
|---|---|---|---|
| Quadrant | BADHDUFLAG | Total packets | Discarded packets |
| A | 0 | 104 | 0 |
| B | 0 | 104 | 0 |
| C | 0 | 104 | 0 |
| D | 0 | 104 | 0 |
| Quadrant | Total seconds | Saturated seconds | Saturation percentage |
|---|---|---|---|
| A | 5200 | 120 | 2.307692% |
| B | 5200 | 71 | 1.365385% |
| C | 5201 | 236 | 4.537589% |
| D | 5201 | 1119 | 21.515093% |
Noise dominated data is calculated using 1-second bins in cleaned event files. If a bin has >2000 counts, and if more than 50% of those come from <1% of pixels, then it is considered to be noise-dominated and hence unusable.
| Quadrant | # 1 sec bins | Bins with >0 counts | Bins with >2000 counts | High rate bins dominated by noise | Noise dominated (total time) | Noise dominated (detector-on time) | Marked lightcurve |
|---|---|---|---|---|---|---|---|
| A | 5745 | 5200 | 2 | 2 | 0.03% | 0.04% | 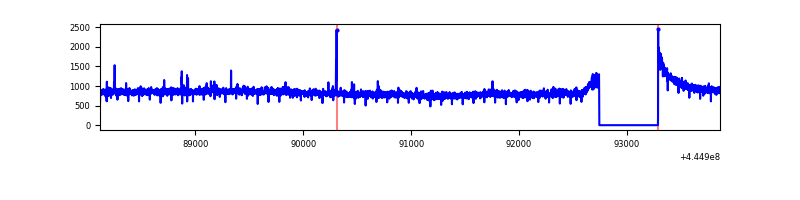 |
| B | 5745 | 5201 | 9 | 9 | 0.16% | 0.17% | 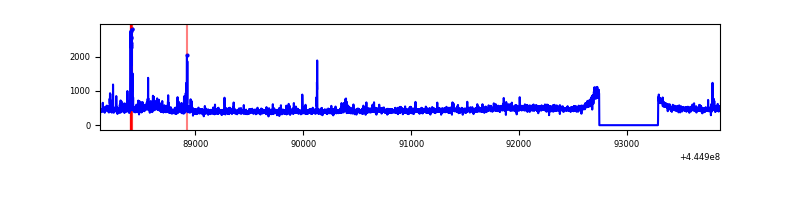 |
| C | 5746 | 5201 | 152 | 152 | 2.65% | 2.92% | 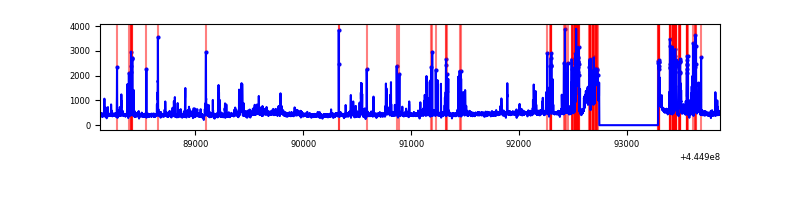 |
| D | 5746 | 5201 | 1071 | 1071 | 18.64% | 20.59% | 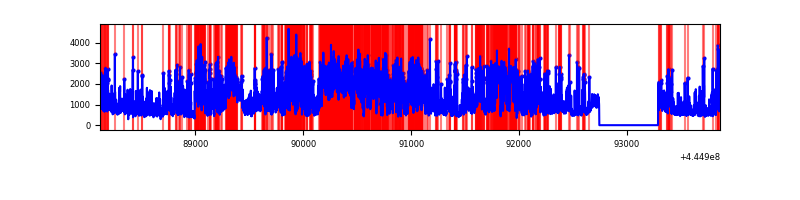 |
Top three noisy pixels from each quadrant. If the there are fewer than three noisy pixels in the level2.evt file, extra rows are filled as -1
| Pixel properties | Quadrant properties | ||||||
|---|---|---|---|---|---|---|---|
| Quadrant | DetID | PixID | Counts | Sigma | Mean | Median | Sigma |
| A | 10 | 83 | 2123844 | 17370.01 | 576 | 562 | 122.2 |
| A | 9 | 191 | 21961 | 175.06 | 576 | 562 | 122.2 |
| A | 10 | 248 | 11838 | 92.25 | 576 | 562 | 122.2 |
| B | 12 | 48 | 32050 | 274.08 | 576 | 558 | 114.9 |
| B | 15 | 201 | 29583 | 252.61 | 576 | 558 | 114.9 |
| B | 0 | 186 | 20136 | 170.39 | 576 | 558 | 114.9 |
| C | 14 | 254 | 665014 | 5018.64 | 554 | 558 | 132.4 |
| C | 0 | 239 | 94244 | 707.61 | 554 | 558 | 132.4 |
| C | 14 | 96 | 50961 | 380.69 | 554 | 558 | 132.4 |
| D | 1 | 52 | 2121198 | 15488.51 | 530 | 514 | 136.9 |
| D | 2 | 249 | 1186033 | 8658.49 | 530 | 514 | 136.9 |
| D | 13 | 249 | 766392 | 5593.62 | 530 | 514 | 136.9 |
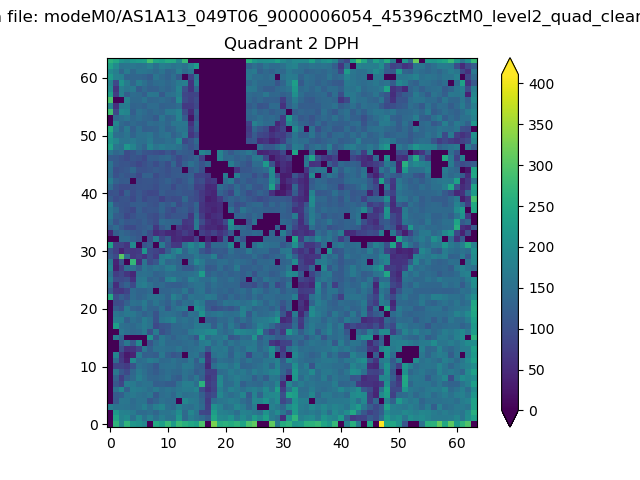
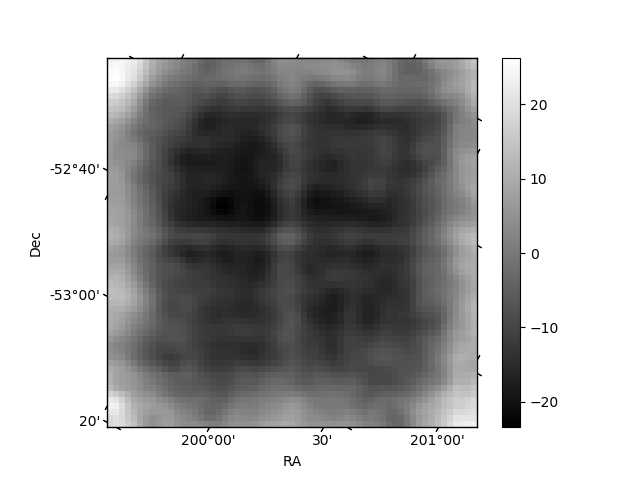
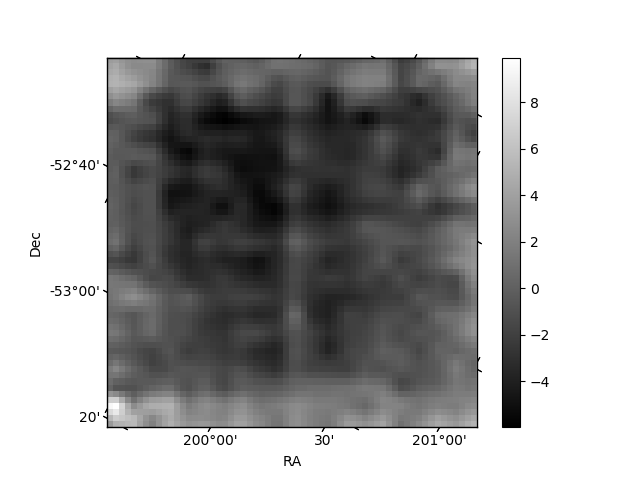
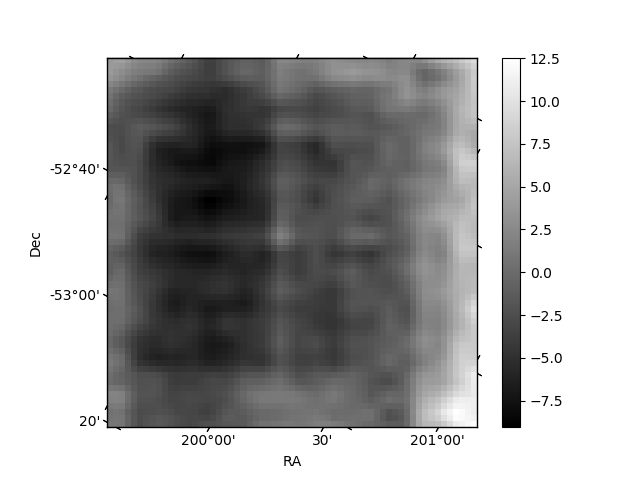
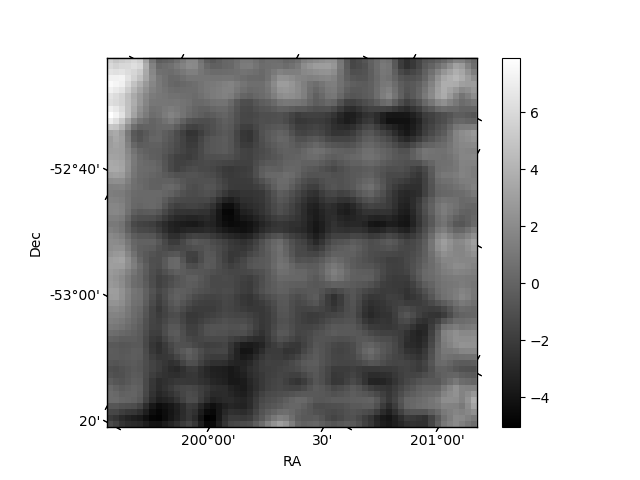
Histogram calculated using DETX and DETY for each event in the final _common_clean file
| Quadrant A | 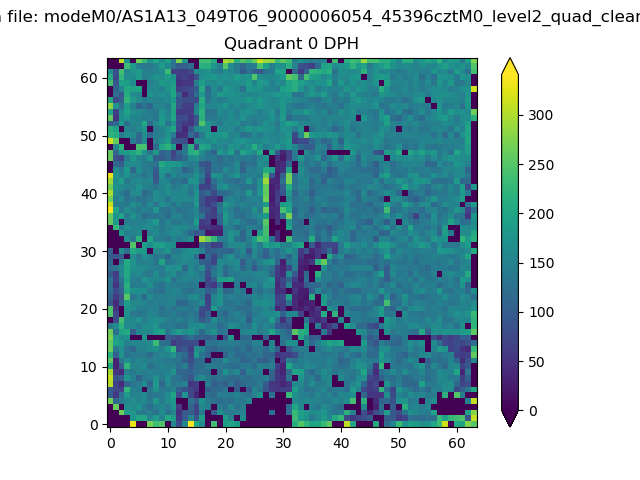 |
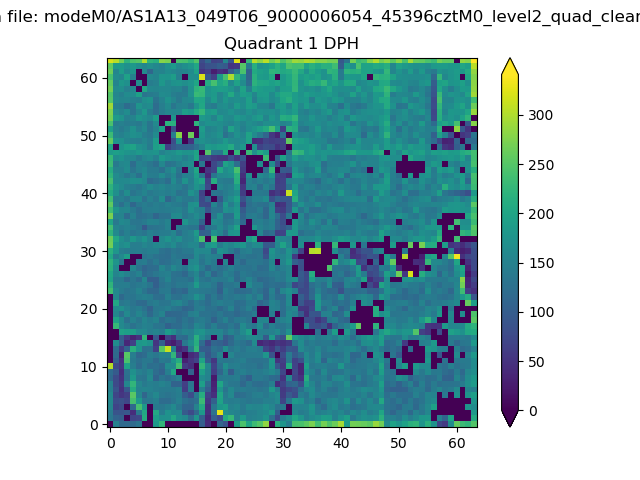 |
Quadrant B |
|---|---|---|---|
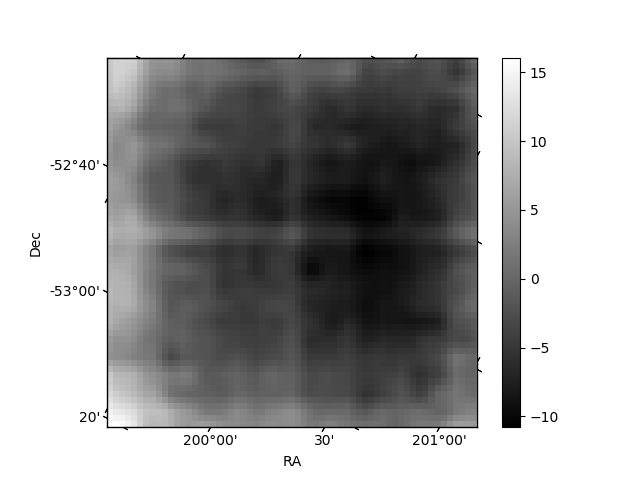
| Quadrant D | 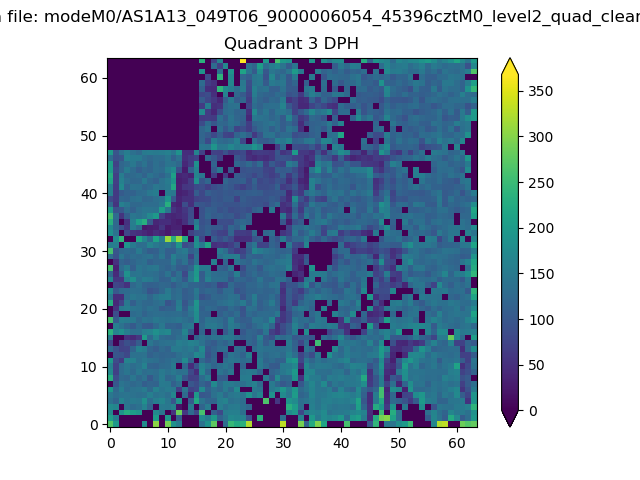 |
 |
Quadrant C |
| Plot type | Count rate plots | Images |
|---|---|---|
| Comparison with Poisson distribution Blue bars denote a histogram of data divided into 1 sec bins. Red curve is a Poisson curve with rate = median count rate of data. |
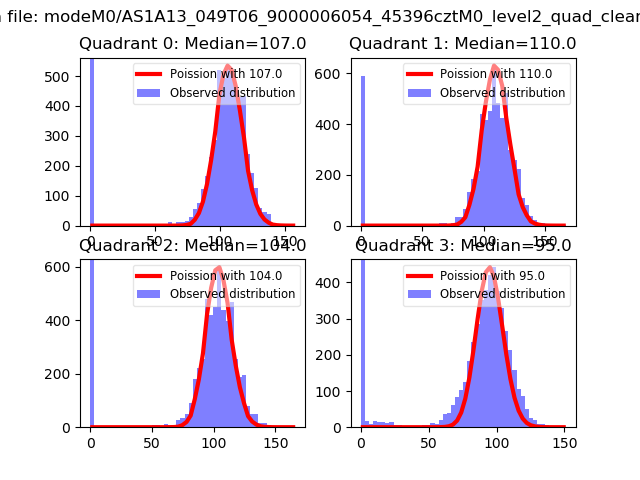 |
 |
| Quadrant-wise count rates Data is divided into 100 sec bins |
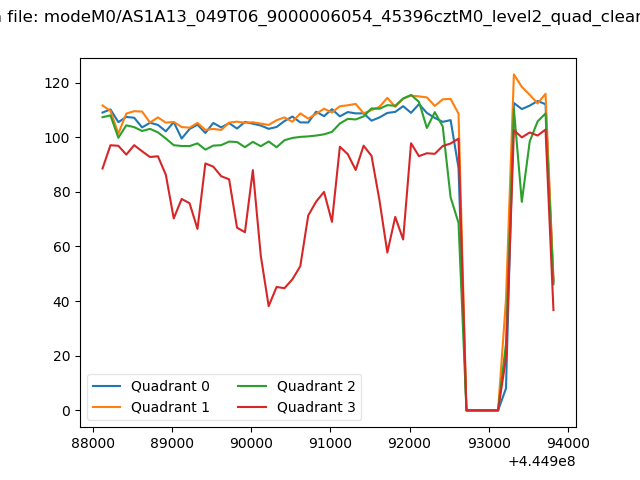 |
|
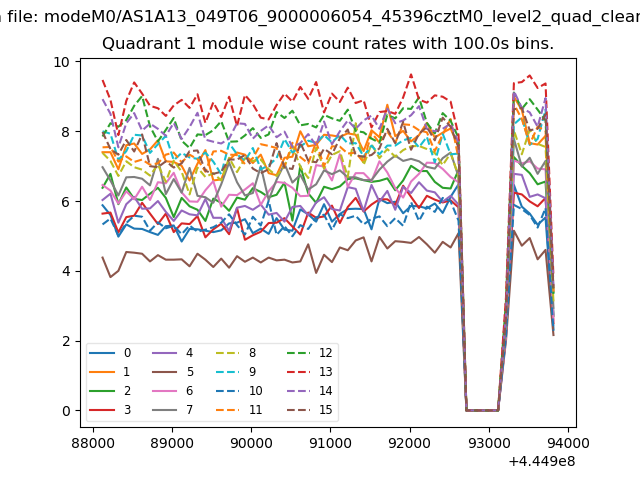
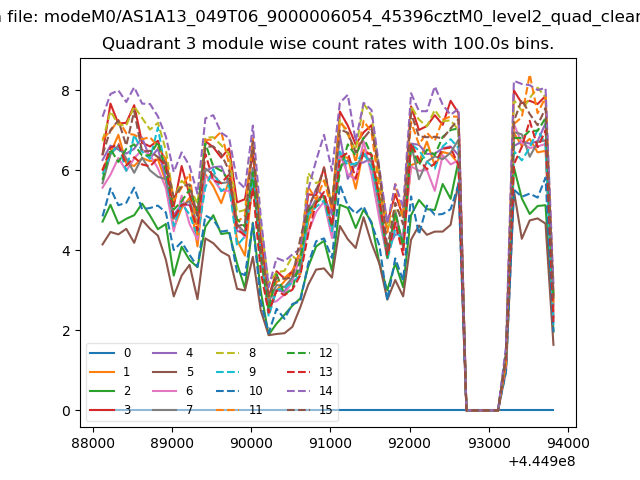
| Module-wise count rates for Quadrant A Data is divided into 100 sec bins |
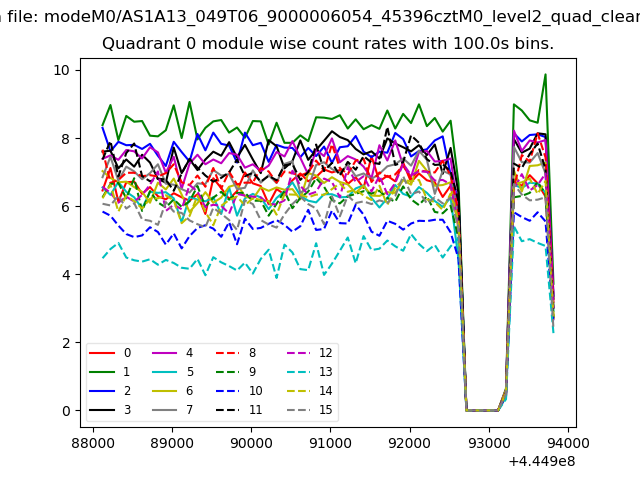 |
 |
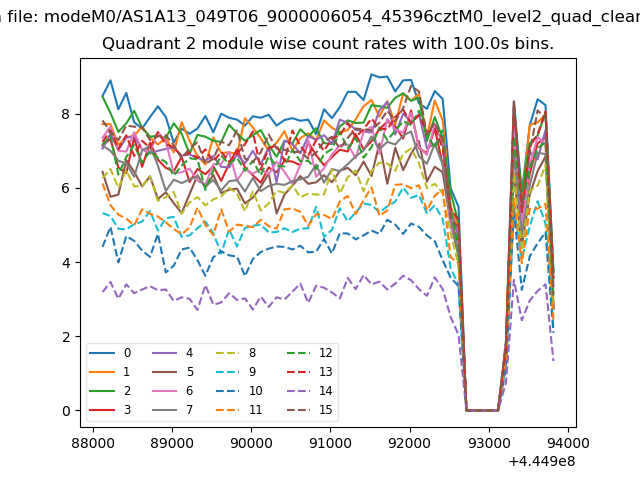
| Module-wise count rates for Quadrant B Data is divided into 100 sec bins |
 |
 |
| Module-wise count rates for Quadrant C Data is divided into 100 sec bins |
 |
 |
| Module-wise count rates for Quadrant D Data is divided into 100 sec bins |
 |
 |
| Parameter | Plot |
|---|---|
| CZT HV Monitor | 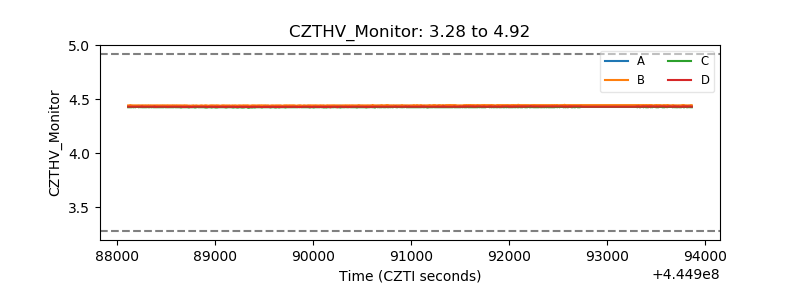 |
| D_VDD | 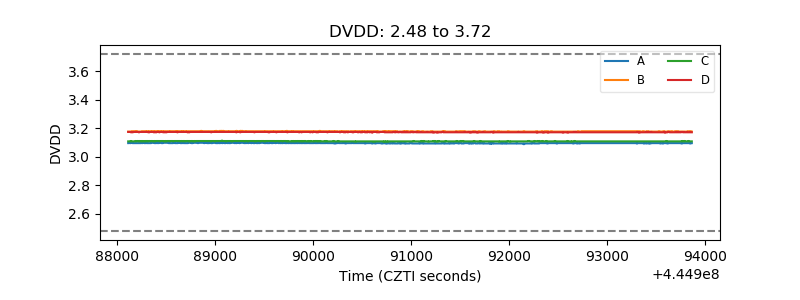 |
| Temperature 1 | 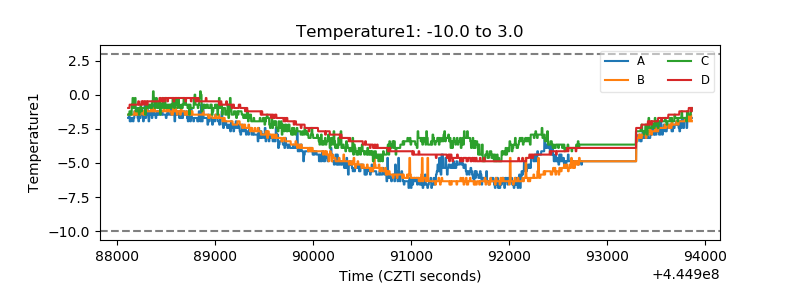 |
| Veto HV Monitor | 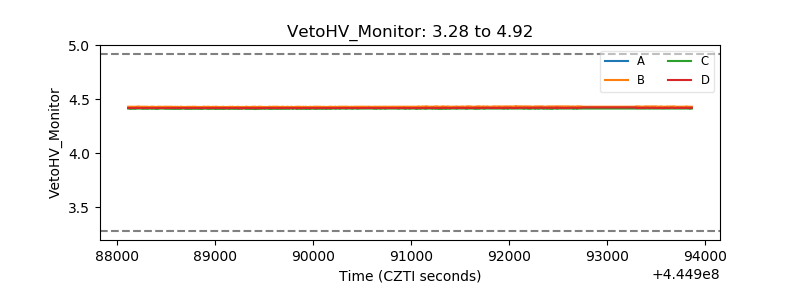 |
| Veto LLD | 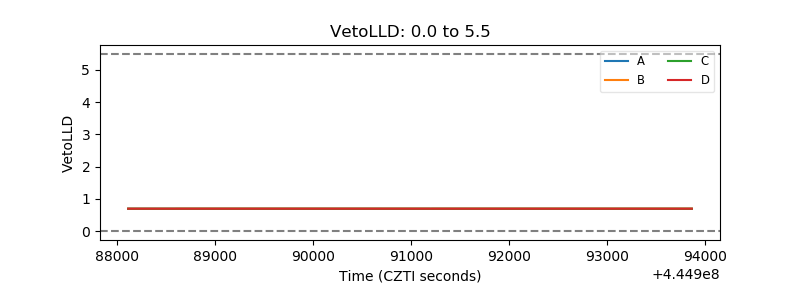 |
| Alpha Counter | 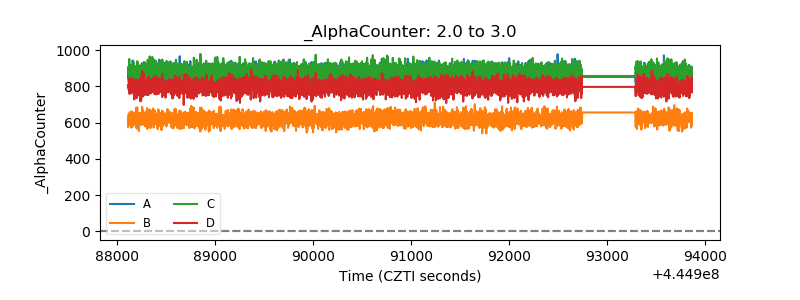 |
| _CPM_Rate | 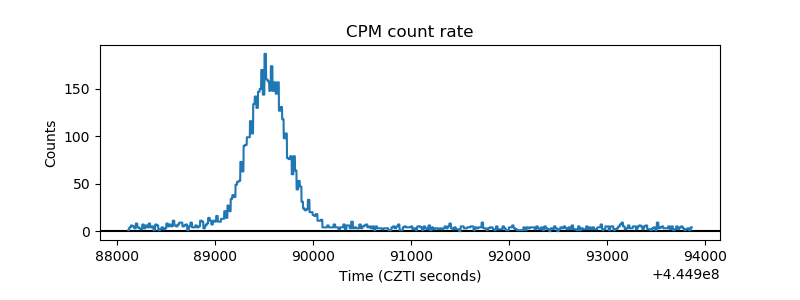 |
| CZT Counter | 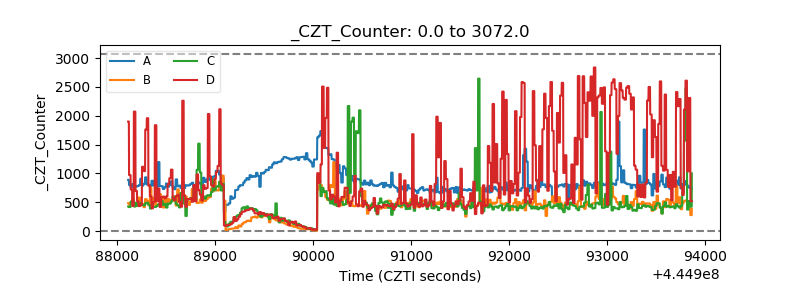 |
| +2.5 Volts monitor | 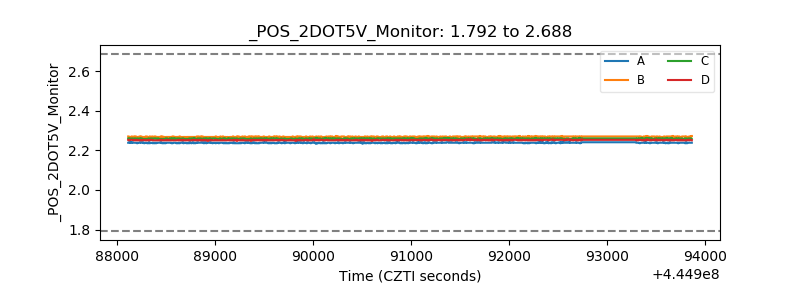 |
| +5 Volts monitor | 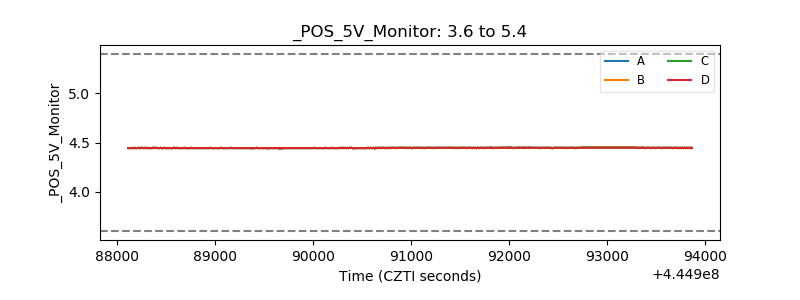 |
| _ROLL_ROT | 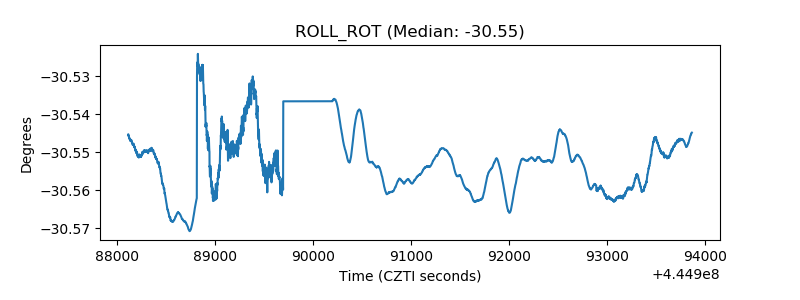 |
| _Roll_DEC | 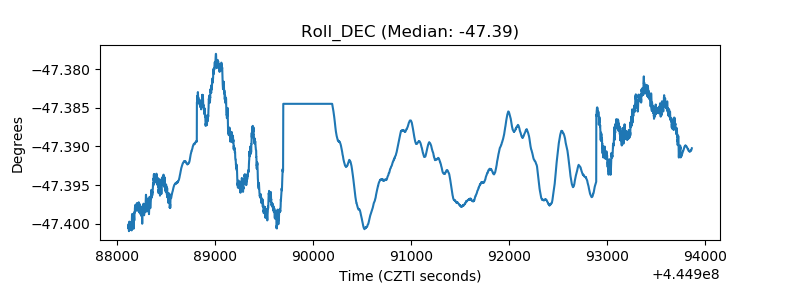 |
| _Roll_RA | 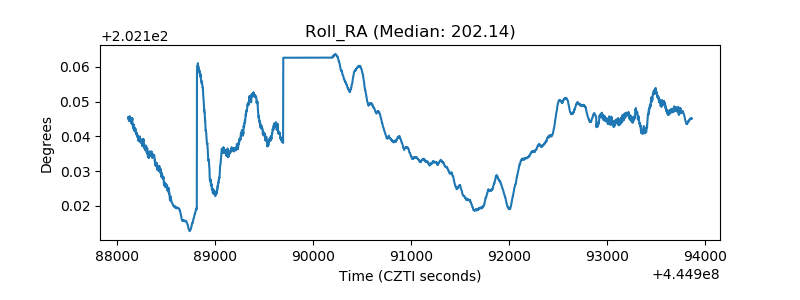 |
| Veto Counter | 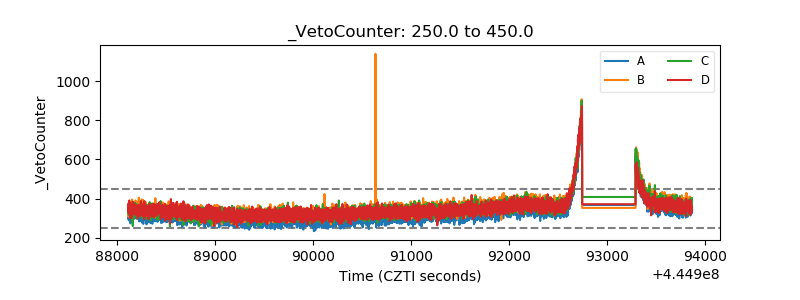 |