| Param | Original file | Final file |
|---|---|---|
| Filename | modeM0/AS1A13_049T07_9000006056_45216cztM0_level2.fits | modeM0/AS1A13_049T07_9000006056_45216cztM0_level2_quad_clean.evt |
| Size (bytes) | 228,709,440 | 48,349,440 |
| Size | 218.1 MB | 46.1 MB |
| Events in quadrant A | 2,424,983 | 315,249 |
| Events in quadrant B | 1,792,265 | 327,857 |
| Events in quadrant C | 1,807,433 | 323,146 |
| Events in quadrant D | 2,206,402 | 284,065 |
| Mode M0 | |||
|---|---|---|---|
| Quadrant | BADHDUFLAG | Total packets | Discarded packets |
| A | 0 | 9468 | 1 |
| B | 0 | 7267 | 1 |
| C | 0 | 7455 | 1 |
| D | 0 | 8562 | 1 |
| Mode M9 | |||
|---|---|---|---|
| Quadrant | BADHDUFLAG | Total packets | Discarded packets |
| A | 0 | 6 | 0 |
| B | 0 | 6 | 0 |
| C | 0 | 6 | 0 |
| D | 0 | 6 | 0 |
| Mode SS | |||
|---|---|---|---|
| Quadrant | BADHDUFLAG | Total packets | Discarded packets |
| A | 0 | 62 | 0 |
| B | 0 | 62 | 0 |
| C | 0 | 62 | 0 |
| D | 0 | 62 | 0 |
| Quadrant | Total seconds | Saturated seconds | Saturation percentage |
|---|---|---|---|
| A | 2999 | 188 | 6.268756% |
| B | 2999 | 197 | 6.568856% |
| C | 2999 | 99 | 3.301100% |
| D | 2998 | 250 | 8.338893% |
Noise dominated data is calculated using 1-second bins in cleaned event files. If a bin has >2000 counts, and if more than 50% of those come from <1% of pixels, then it is considered to be noise-dominated and hence unusable.
| Quadrant | # 1 sec bins | Bins with >0 counts | Bins with >2000 counts | High rate bins dominated by noise | Noise dominated (total time) | Noise dominated (detector-on time) | Marked lightcurve |
|---|---|---|---|---|---|---|---|
| A | 3619 | 2999 | 2 | 2 | 0.06% | 0.07% | 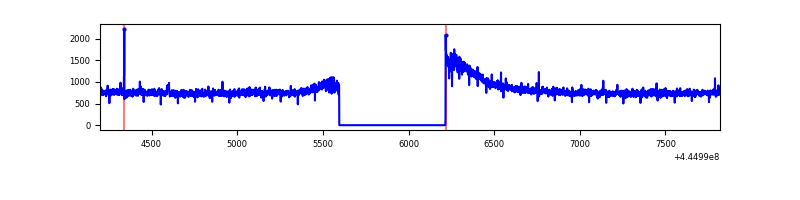 |
| B | 3619 | 2999 | 65 | 65 | 1.80% | 2.17% | 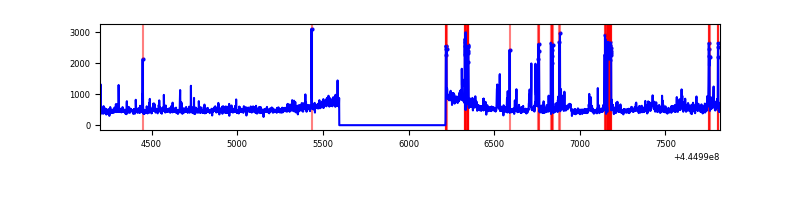 |
| C | 3619 | 3000 | 22 | 22 | 0.61% | 0.73% | 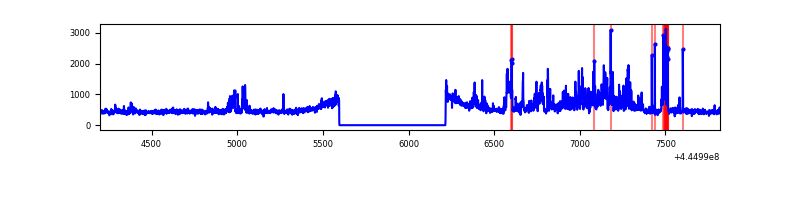 |
| D | 3618 | 2999 | 157 | 157 | 4.34% | 5.24% | 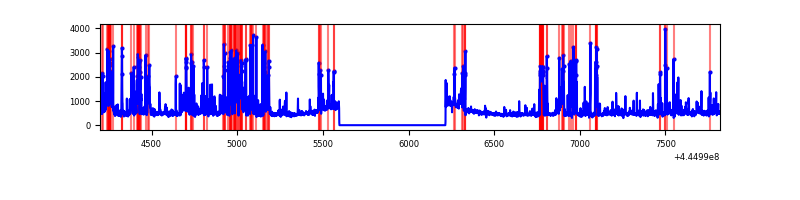 |
Top three noisy pixels from each quadrant. If the there are fewer than three noisy pixels in the level2.evt file, extra rows are filled as -1
| Pixel properties | Quadrant properties | ||||||
|---|---|---|---|---|---|---|---|
| Quadrant | DetID | PixID | Counts | Sigma | Mean | Median | Sigma |
| A | 10 | 83 | 1051339 | 13871.1 | 352 | 343 | 75.8 |
| A | 0 | 243 | 6851 | 85.89 | 352 | 343 | 75.8 |
| A | 3 | 137 | 4105 | 49.65 | 352 | 343 | 75.8 |
| B | 5 | 32 | 126240 | 1761.75 | 351 | 339 | 71.5 |
| B | 4 | 171 | 126161 | 1760.65 | 351 | 339 | 71.5 |
| B | 3 | 112 | 114512 | 1597.64 | 351 | 339 | 71.5 |
| C | 12 | 2 | 331204 | 3896.37 | 355 | 355 | 84.9 |
| C | 1 | 3 | 77317 | 906.37 | 355 | 355 | 84.9 |
| C | 3 | 233 | 7251 | 81.21 | 355 | 355 | 84.9 |
| D | 13 | 249 | 596615 | 6709.36 | 347 | 335 | 88.9 |
| D | 2 | 249 | 58138 | 650.4 | 347 | 335 | 88.9 |
| D | 1 | 52 | 55181 | 617.13 | 347 | 335 | 88.9 |
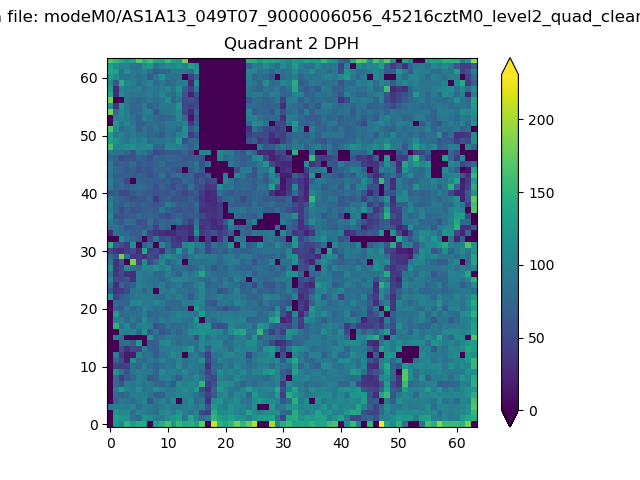
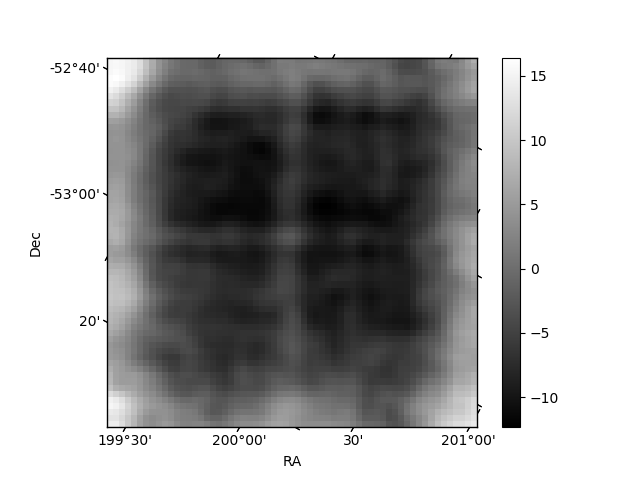
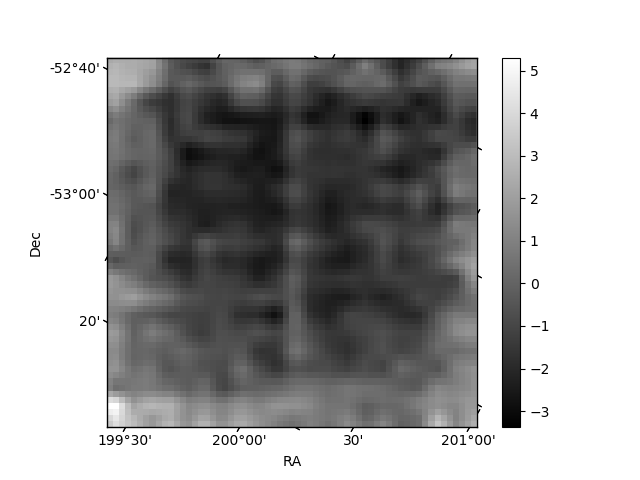
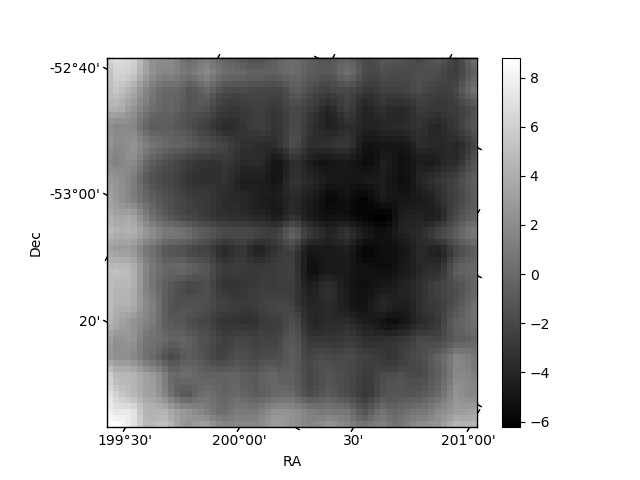
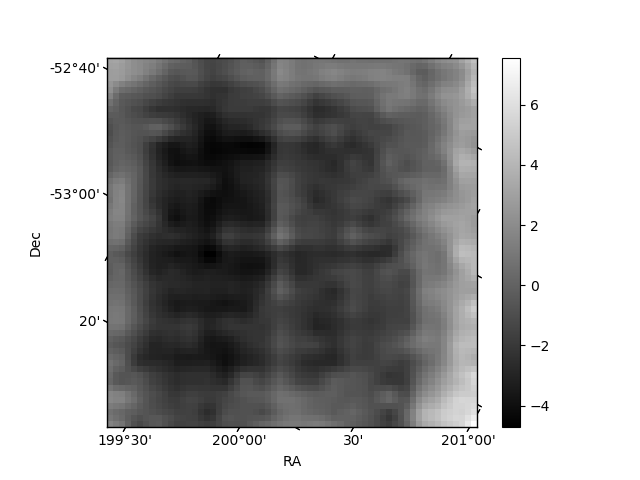
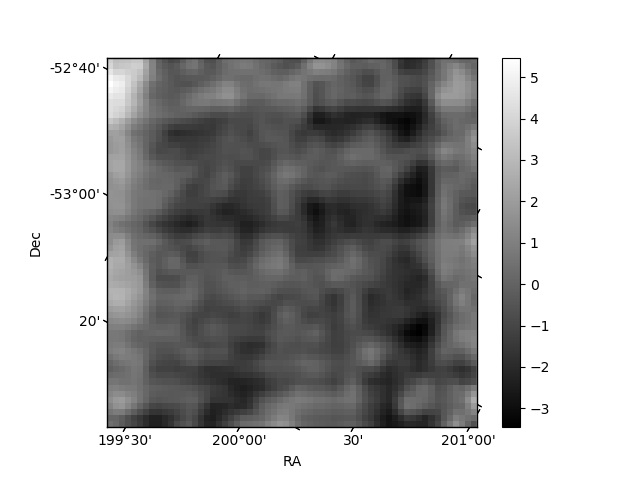
Histogram calculated using DETX and DETY for each event in the final _common_clean file
| Quadrant A | 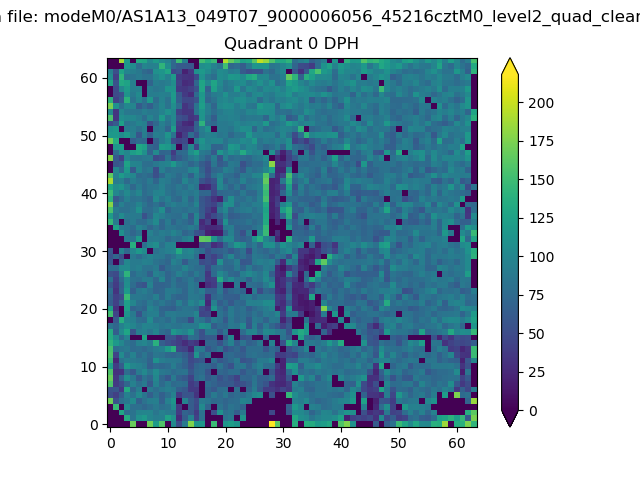 |
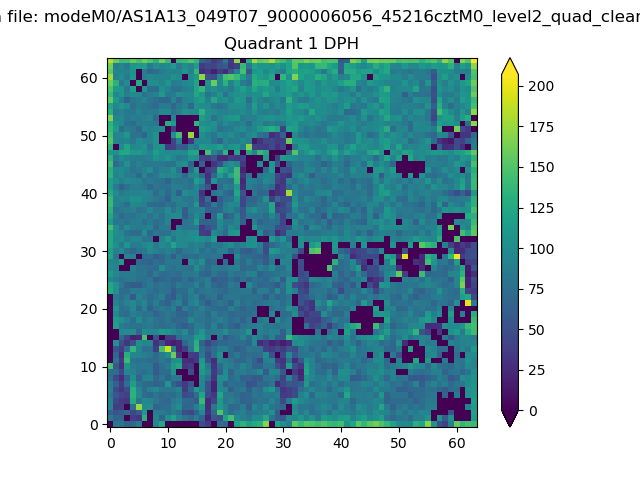 |
Quadrant B |
|---|---|---|---|
| Quadrant D | 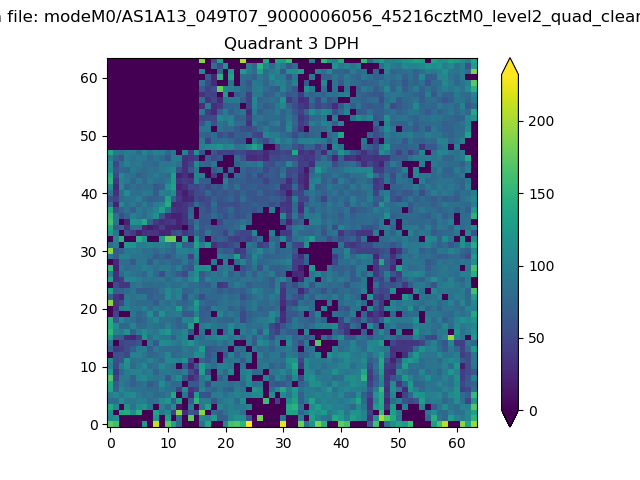 |
 |
Quadrant C |
| Plot type | Count rate plots | Images |
|---|---|---|
| Comparison with Poisson distribution Blue bars denote a histogram of data divided into 1 sec bins. Red curve is a Poisson curve with rate = median count rate of data. |
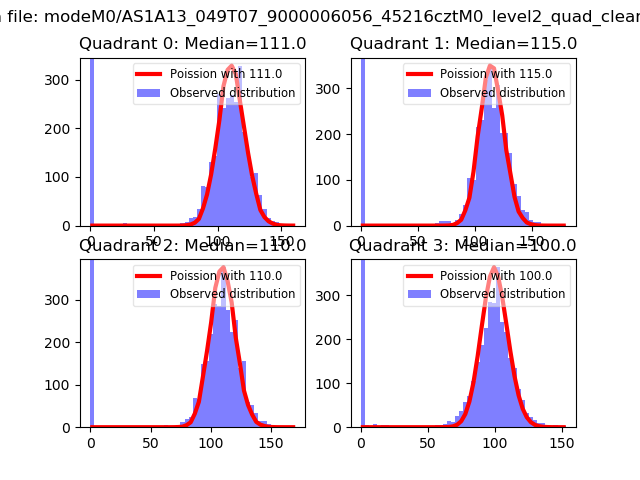 |
 |
| Quadrant-wise count rates Data is divided into 100 sec bins |
 |
|
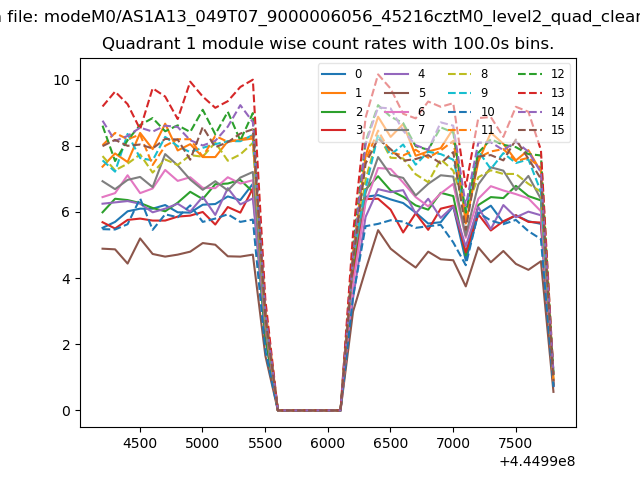
| Module-wise count rates for Quadrant A Data is divided into 100 sec bins |
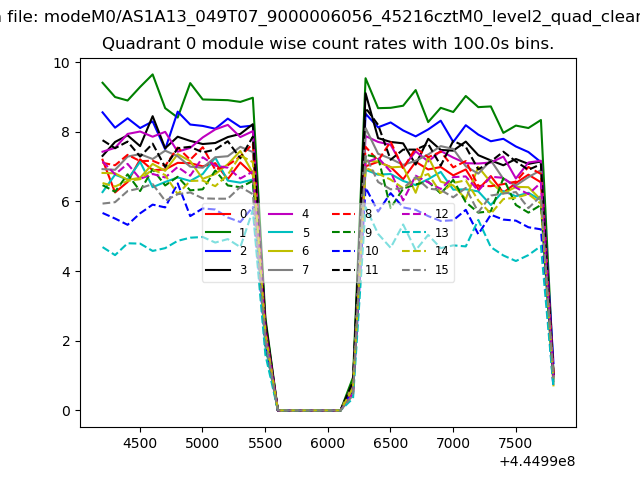 |
 |
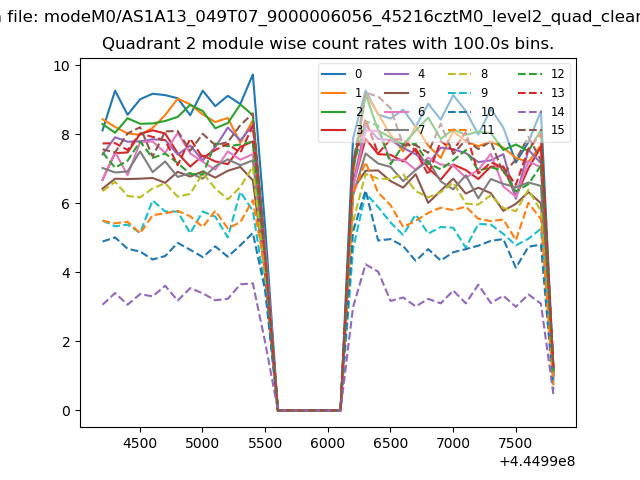
| Module-wise count rates for Quadrant B Data is divided into 100 sec bins |
 |
 |
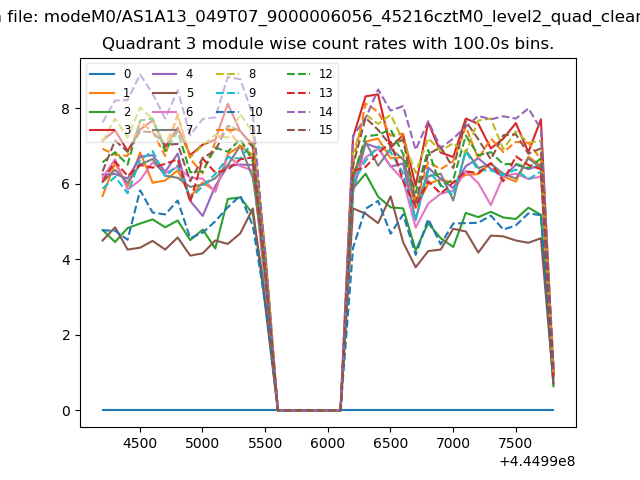
| Module-wise count rates for Quadrant C Data is divided into 100 sec bins |
 |
 |
| Module-wise count rates for Quadrant D Data is divided into 100 sec bins |
 |
 |
| Parameter | Plot |
|---|---|
| CZT HV Monitor | 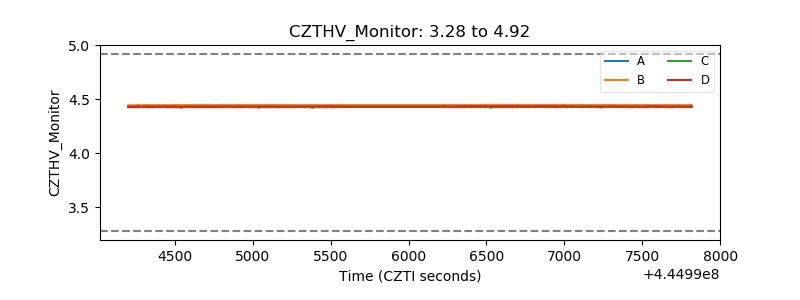 |
| D_VDD | 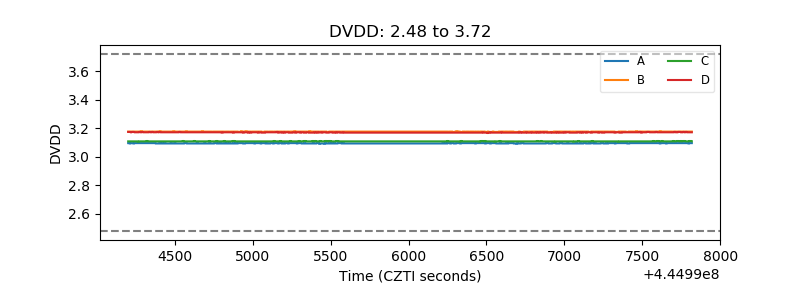 |
| Temperature 1 | 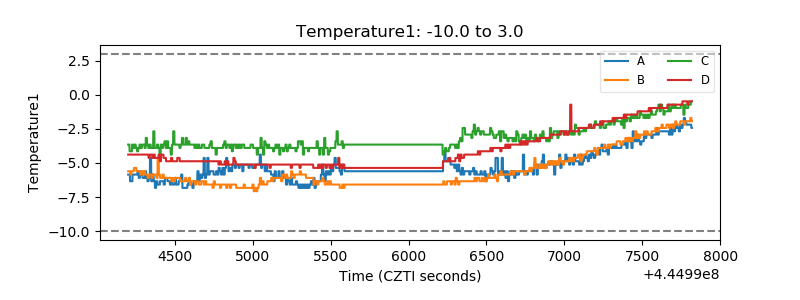 |
| Veto HV Monitor | 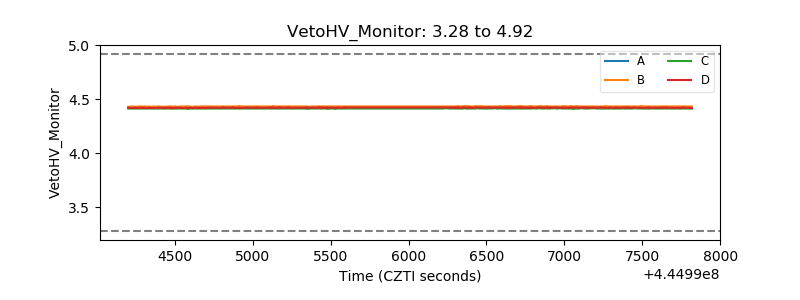 |
| Veto LLD | 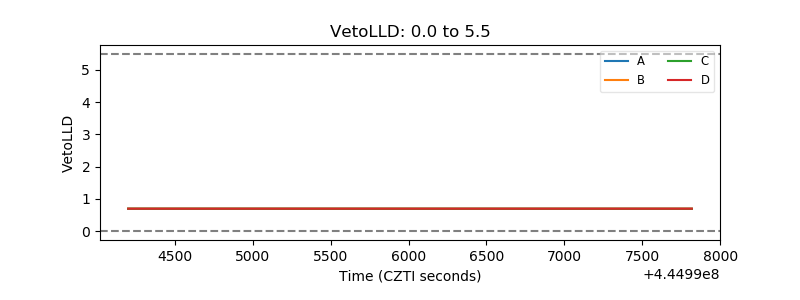 |
| Alpha Counter | 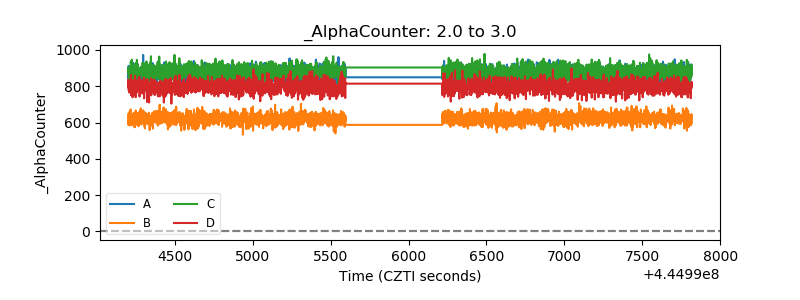 |
| _CPM_Rate | 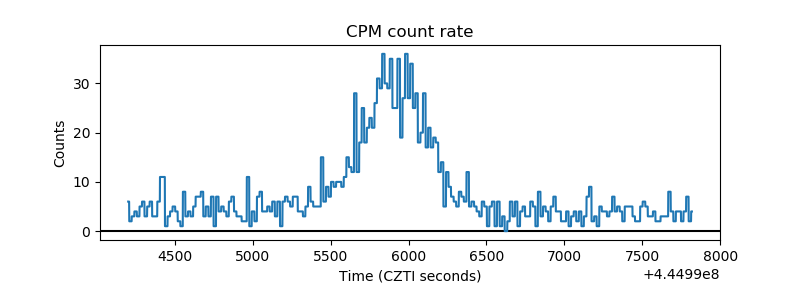 |
| CZT Counter | 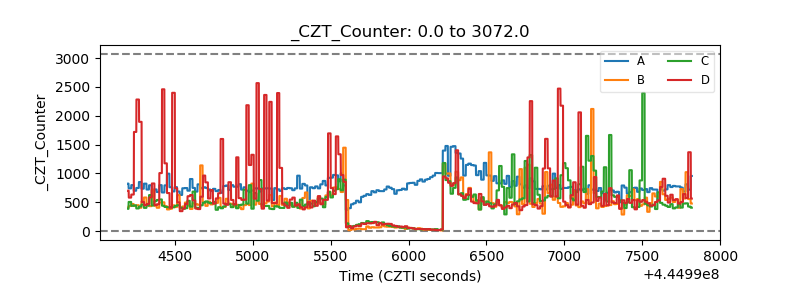 |
| +2.5 Volts monitor | 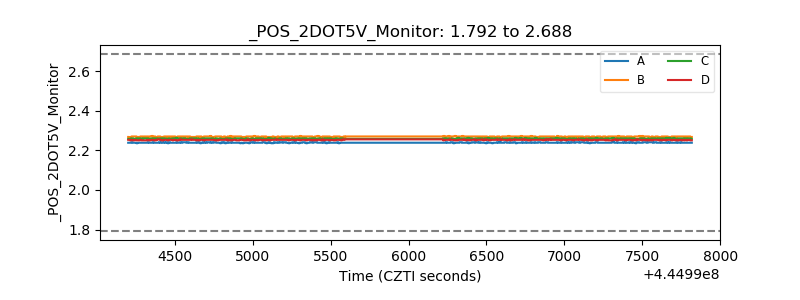 |
| +5 Volts monitor |  |
| _ROLL_ROT | 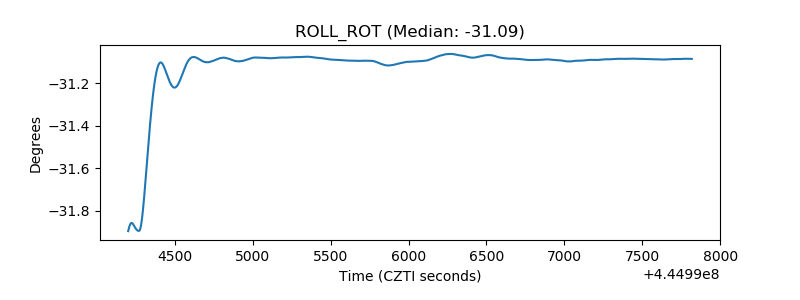 |
| _Roll_DEC | 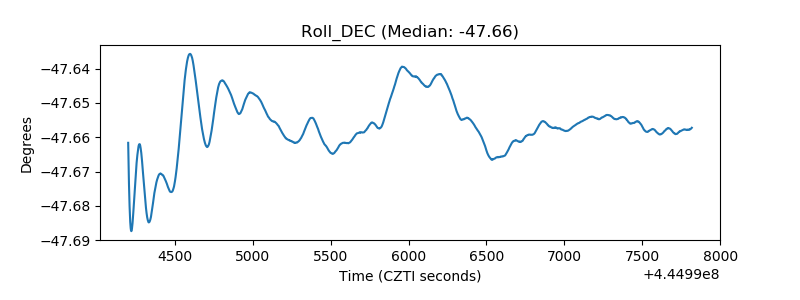 |
| _Roll_RA | 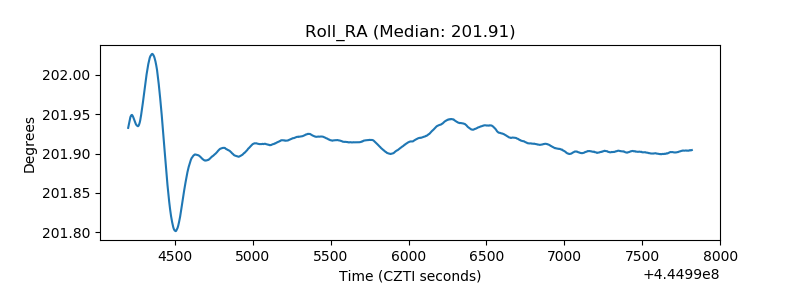 |
| Veto Counter | 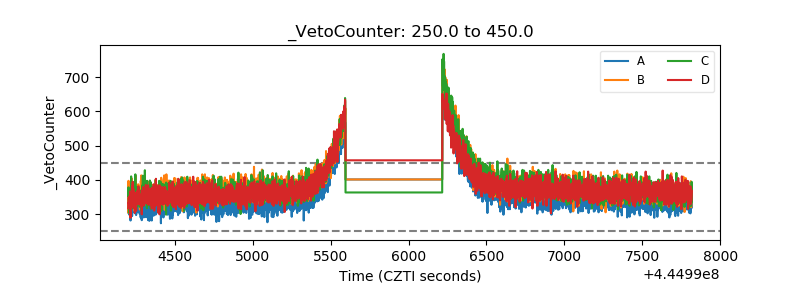 |