| Param | Original file | Final file |
|---|---|---|
| Filename | modeM0/AS1A13_049T07_9000006056_45217cztM0_level2.fits | modeM0/AS1A13_049T07_9000006056_45217cztM0_level2_quad_clean.evt |
| Size (bytes) | 579,648,960 | 117,253,440 |
| Size | 552.8 MB | 111.8 MB |
| Events in quadrant A | 6,181,463 | 763,381 |
| Events in quadrant B | 4,293,597 | 800,085 |
| Events in quadrant C | 4,122,788 | 786,215 |
| Events in quadrant D | 6,278,279 | 679,954 |
| Mode M0 | |||
|---|---|---|---|
| Quadrant | BADHDUFLAG | Total packets | Discarded packets |
| A | 0 | 23788 | 0 |
| B | 0 | 17636 | 0 |
| C | 0 | 17761 | 0 |
| D | 0 | 23738 | 0 |
| Mode SS | |||
|---|---|---|---|
| Quadrant | BADHDUFLAG | Total packets | Discarded packets |
| A | 0 | 148 | 0 |
| B | 0 | 148 | 0 |
| C | 0 | 148 | 0 |
| D | 0 | 148 | 0 |
| Quadrant | Total seconds | Saturated seconds | Saturation percentage |
|---|---|---|---|
| A | 7484 | 428 | 5.718867% |
| B | 7484 | 328 | 4.382683% |
| C | 7485 | 252 | 3.366733% |
| D | 7485 | 719 | 9.605878% |
Noise dominated data is calculated using 1-second bins in cleaned event files. If a bin has >2000 counts, and if more than 50% of those come from <1% of pixels, then it is considered to be noise-dominated and hence unusable.
| Quadrant | # 1 sec bins | Bins with >0 counts | Bins with >2000 counts | High rate bins dominated by noise | Noise dominated (total time) | Noise dominated (detector-on time) | Marked lightcurve |
|---|---|---|---|---|---|---|---|
| A | 7484 | 7484 | 99 | 99 | 1.32% | 1.32% | 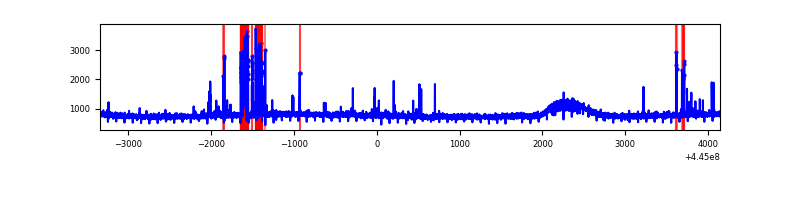 |
| B | 7484 | 7484 | 69 | 69 | 0.92% | 0.92% | 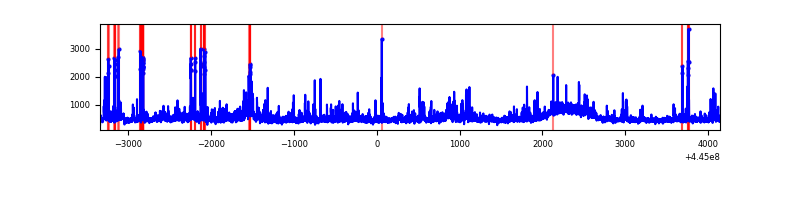 |
| C | 7485 | 7485 | 103 | 103 | 1.38% | 1.38% | 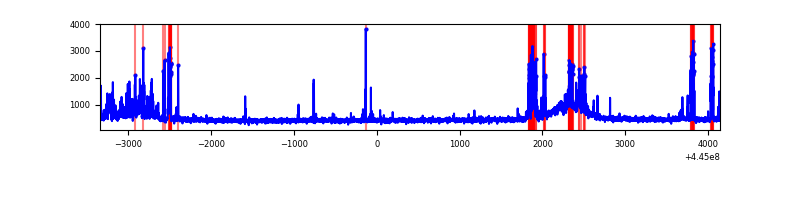 |
| D | 7485 | 7485 | 614 | 614 | 8.20% | 8.20% | 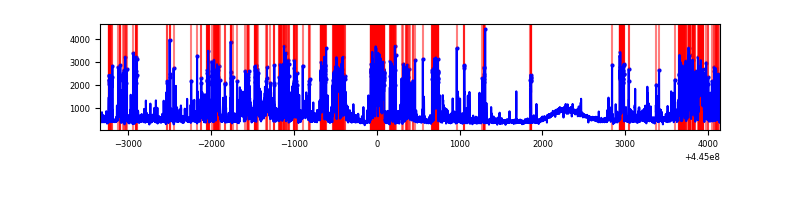 |
Top three noisy pixels from each quadrant. If the there are fewer than three noisy pixels in the level2.evt file, extra rows are filled as -1
| Pixel properties | Quadrant properties | ||||||
|---|---|---|---|---|---|---|---|
| Quadrant | DetID | PixID | Counts | Sigma | Mean | Median | Sigma |
| A | 10 | 83 | 2475754 | 13704.1 | 857 | 835 | 180.6 |
| A | 13 | 248 | 291385 | 1608.83 | 857 | 835 | 180.6 |
| A | 15 | 174 | 49189 | 267.75 | 857 | 835 | 180.6 |
| B | 3 | 112 | 498177 | 2895.07 | 859 | 830 | 171.8 |
| B | 4 | 171 | 147312 | 852.67 | 859 | 830 | 171.8 |
| B | 5 | 32 | 115591 | 668.03 | 859 | 830 | 171.8 |
| C | 12 | 2 | 510916 | 2548.89 | 849 | 850 | 200.1 |
| C | 1 | 3 | 269797 | 1343.97 | 849 | 850 | 200.1 |
| C | 2 | 14 | 12479 | 58.11 | 849 | 850 | 200.1 |
| D | 13 | 249 | 1538275 | 7242.36 | 836 | 807 | 212.3 |
| D | 5 | 235 | 360968 | 1696.57 | 836 | 807 | 212.3 |
| D | 2 | 249 | 318153 | 1494.88 | 836 | 807 | 212.3 |
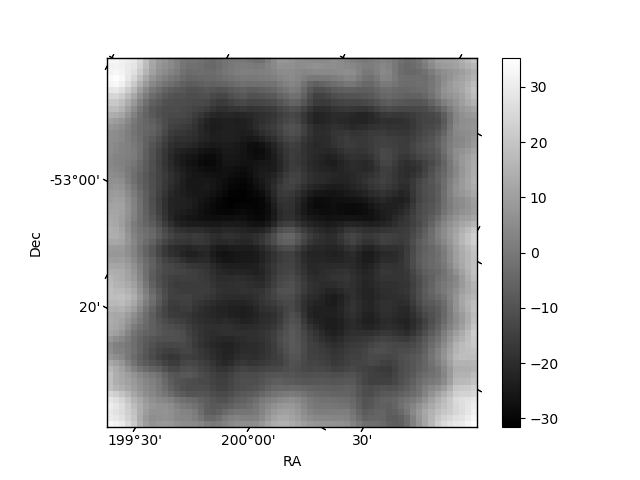
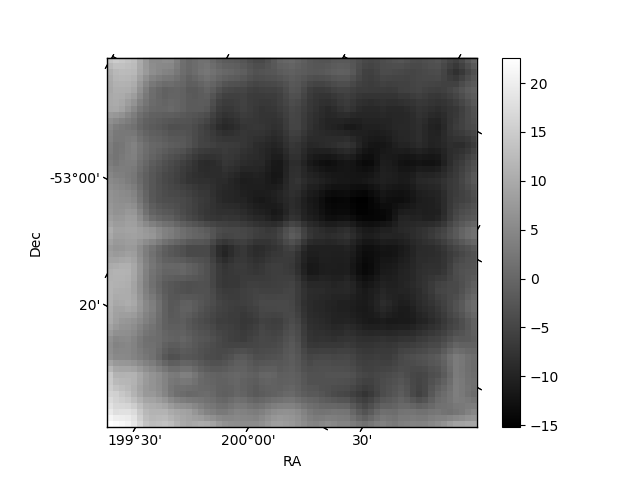
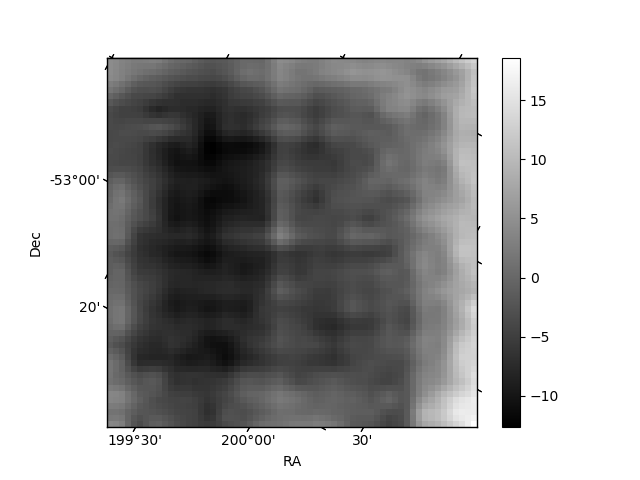
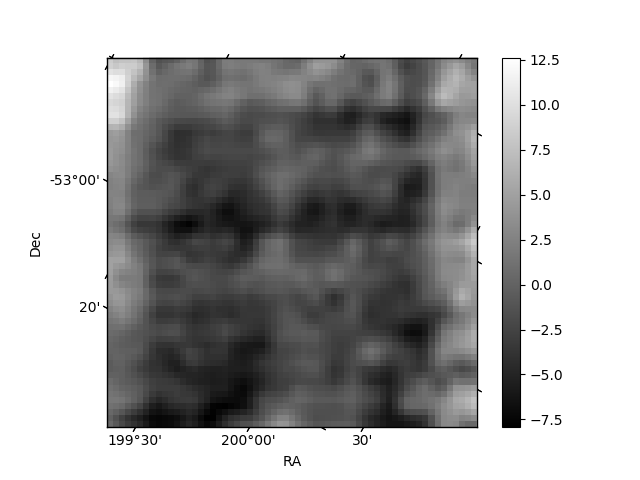
Histogram calculated using DETX and DETY for each event in the final _common_clean file
| Quadrant A | 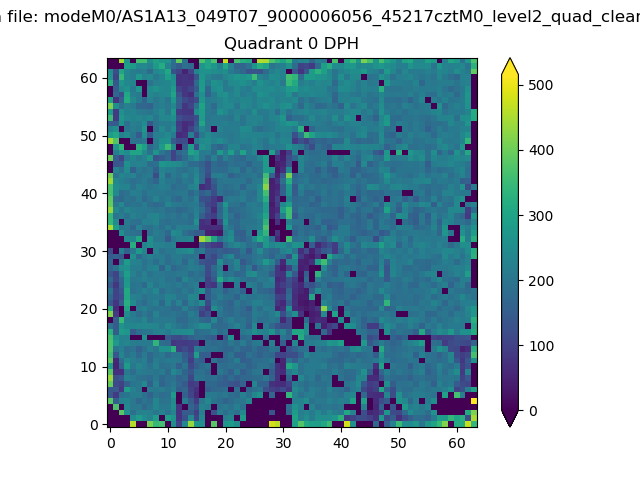 |
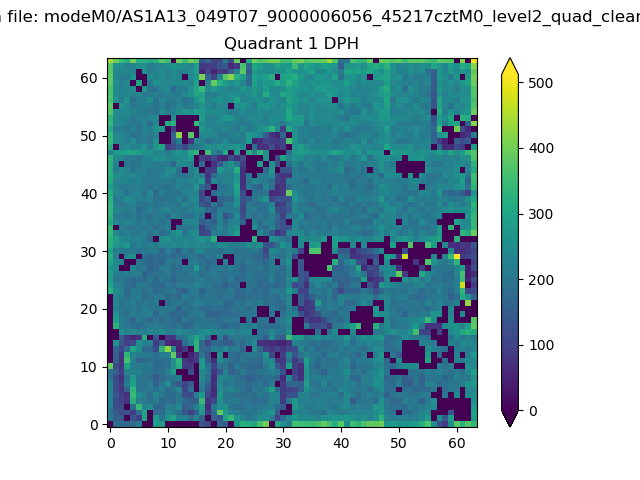 |
Quadrant B |
|---|---|---|---|
| Quadrant D | 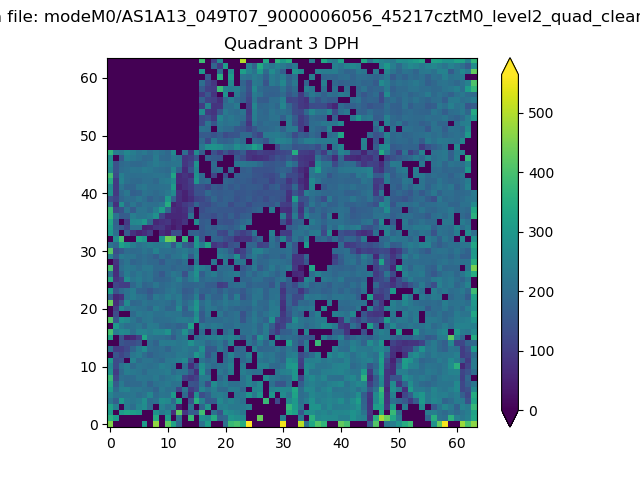 |
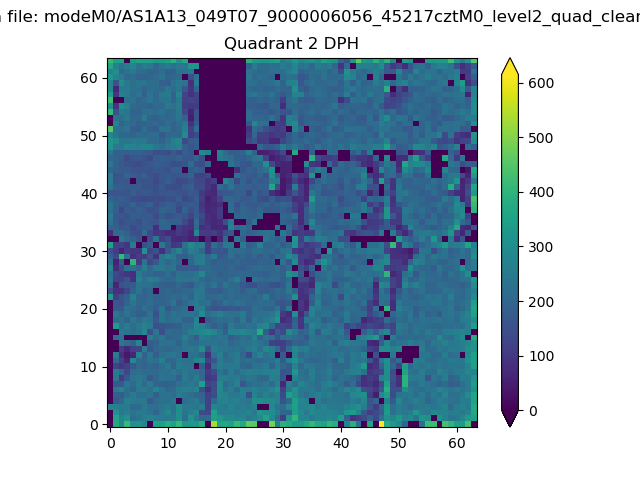 |
Quadrant C |
| Plot type | Count rate plots | Images |
|---|---|---|
| Comparison with Poisson distribution Blue bars denote a histogram of data divided into 1 sec bins. Red curve is a Poisson curve with rate = median count rate of data. |
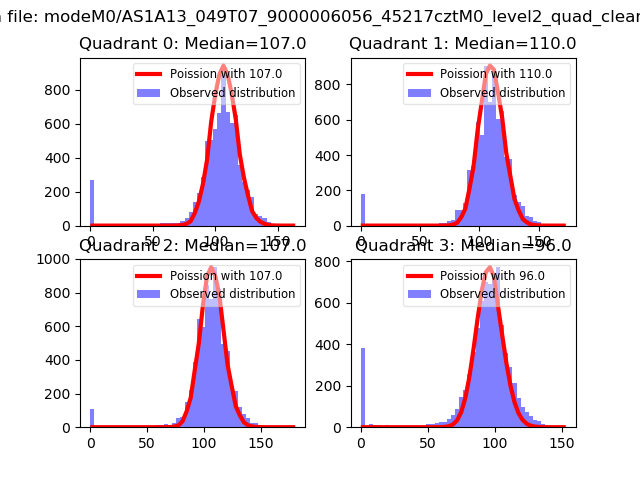 |
 |
| Quadrant-wise count rates Data is divided into 100 sec bins |
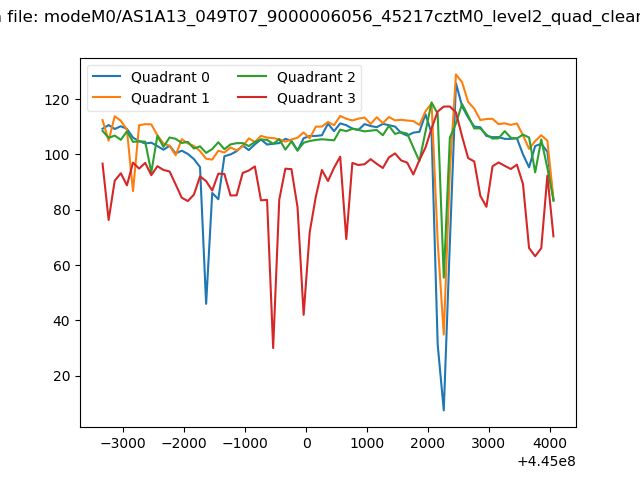 |
|
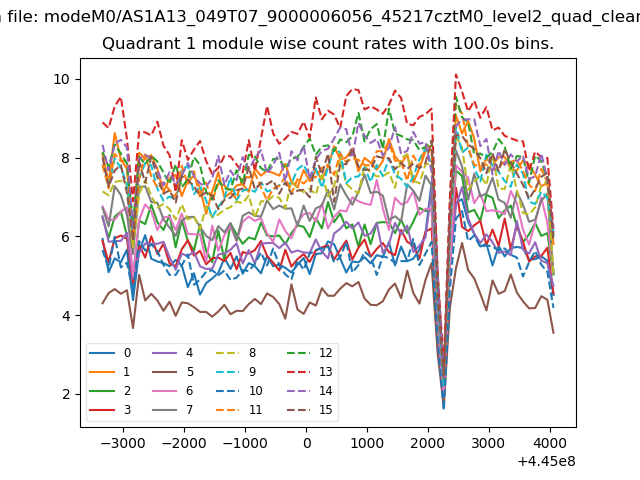
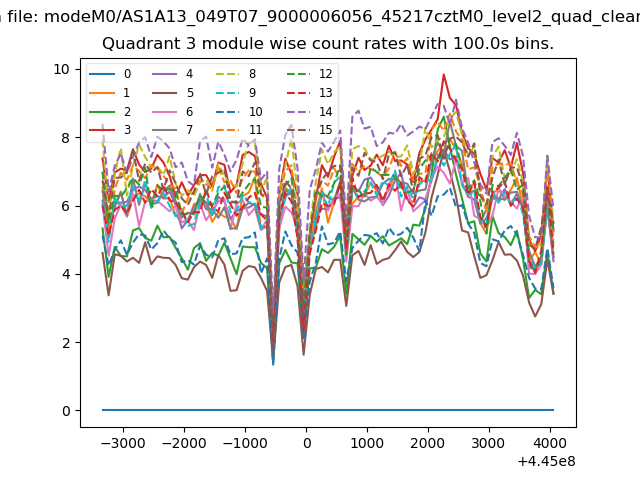
| Module-wise count rates for Quadrant A Data is divided into 100 sec bins |
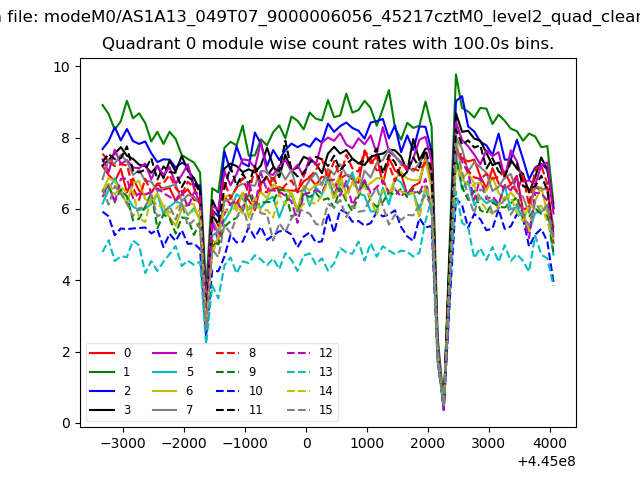 |
 |
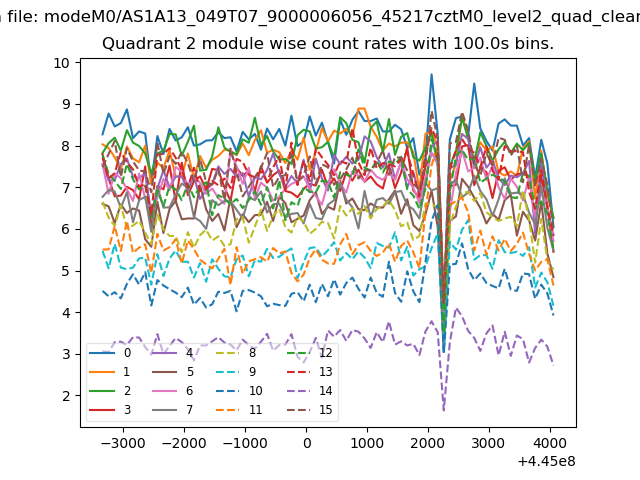
| Module-wise count rates for Quadrant B Data is divided into 100 sec bins |
 |
 |
| Module-wise count rates for Quadrant C Data is divided into 100 sec bins |
 |
 |
| Module-wise count rates for Quadrant D Data is divided into 100 sec bins |
 |
 |
| Parameter | Plot |
|---|---|
| CZT HV Monitor | 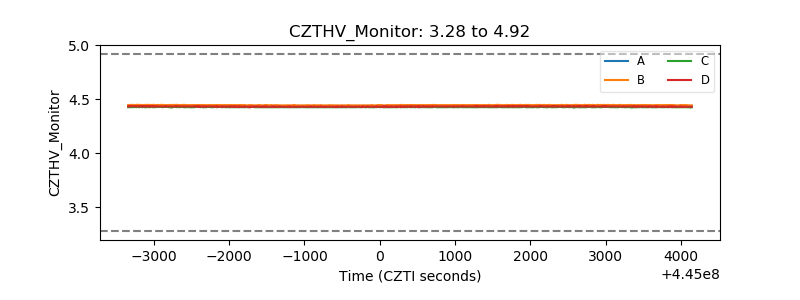 |
| D_VDD | 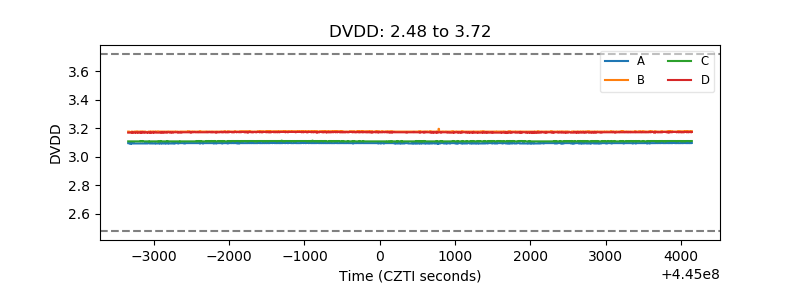 |
| Temperature 1 | 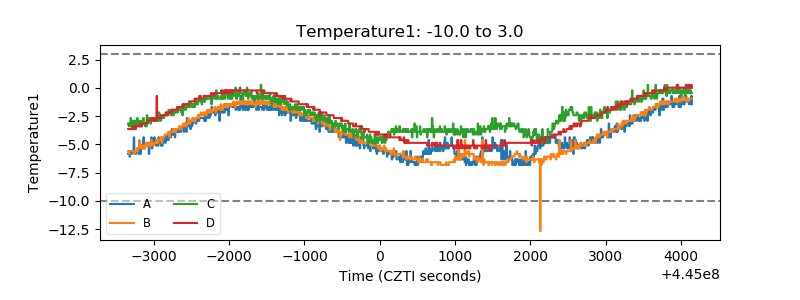 |
| Veto HV Monitor | 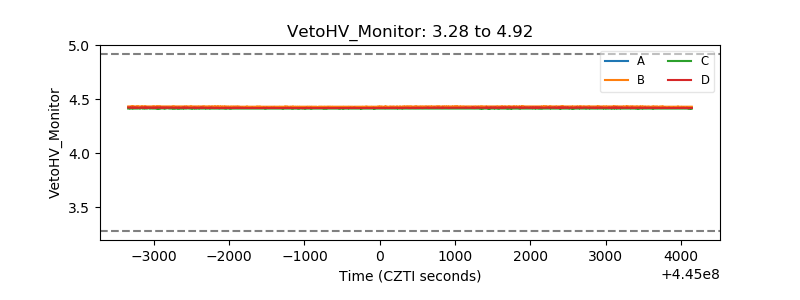 |
| Veto LLD | 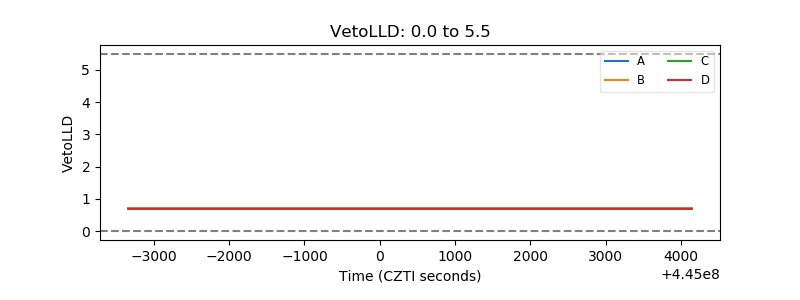 |
| Alpha Counter | 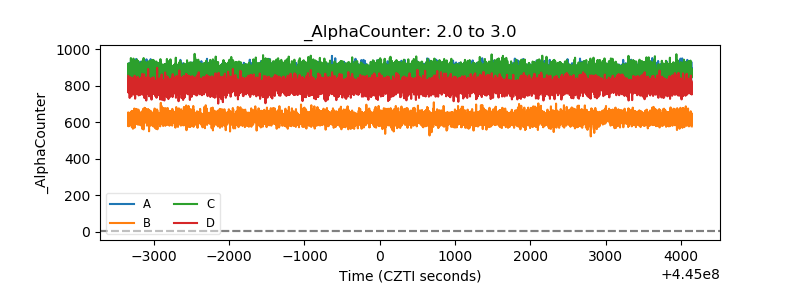 |
| _CPM_Rate | 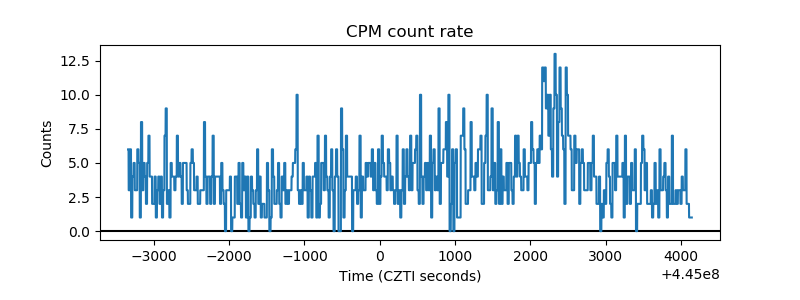 |
| CZT Counter | 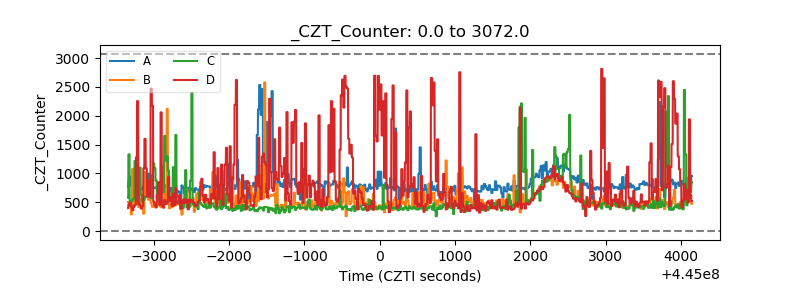 |
| +2.5 Volts monitor | 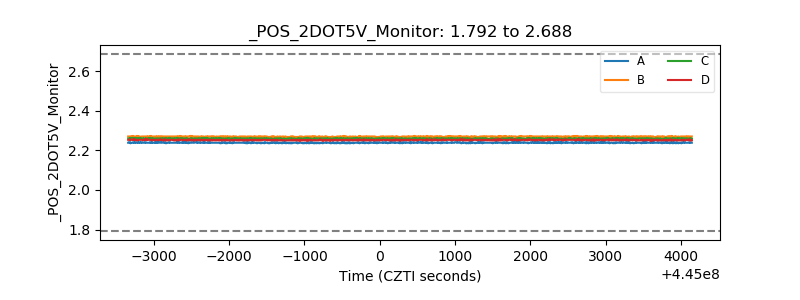 |
| +5 Volts monitor |  |
| _ROLL_ROT | 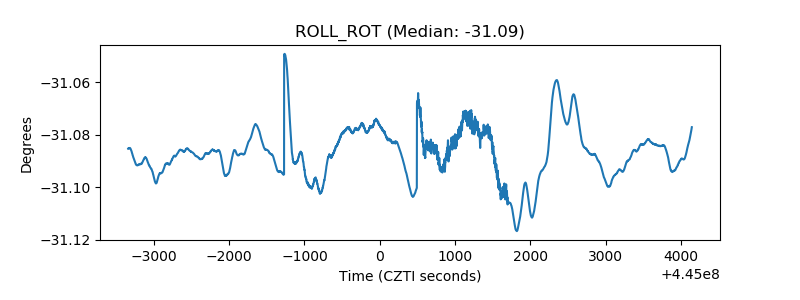 |
| _Roll_DEC | 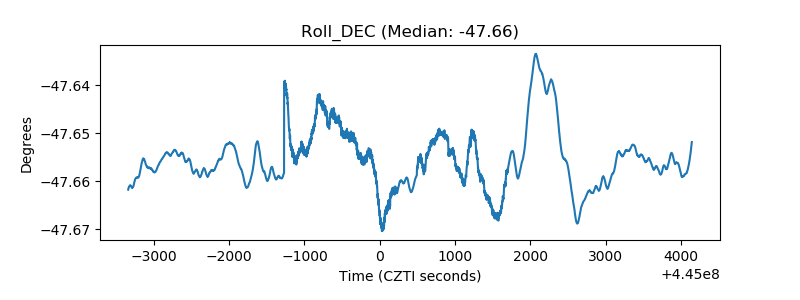 |
| _Roll_RA | 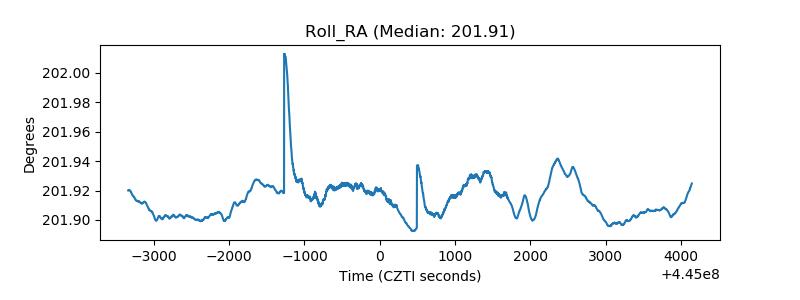 |
| Veto Counter | 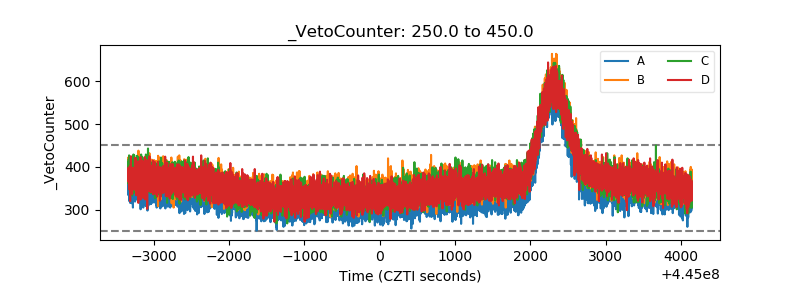 |