| Param | Original file | Final file |
|---|---|---|
| Filename | modeM0/AS1A13_049T07_9000006056_45218cztM0_level2.fits | modeM0/AS1A13_049T07_9000006056_45218cztM0_level2_quad_clean.evt |
| Size (bytes) | 685,085,760 | 129,795,840 |
| Size | 653.3 MB | 123.8 MB |
| Events in quadrant A | 6,882,373 | 876,414 |
| Events in quadrant B | 4,372,328 | 906,581 |
| Events in quadrant C | 4,289,438 | 885,153 |
| Events in quadrant D | 9,164,523 | 678,036 |
| Mode M0 | |||
|---|---|---|---|
| Quadrant | BADHDUFLAG | Total packets | Discarded packets |
| A | 0 | 26260 | 0 |
| B | 0 | 18690 | 0 |
| C | 0 | 18842 | 0 |
| D | 0 | 32947 | 0 |
| Mode SS | |||
|---|---|---|---|
| Quadrant | BADHDUFLAG | Total packets | Discarded packets |
| A | 0 | 168 | 0 |
| B | 0 | 168 | 0 |
| C | 0 | 168 | 0 |
| D | 0 | 168 | 0 |
| Quadrant | Total seconds | Saturated seconds | Saturation percentage |
|---|---|---|---|
| A | 8399 | 286 | 3.405167% |
| B | 8399 | 248 | 2.952732% |
| C | 8400 | 188 | 2.238095% |
| D | 8400 | 1613 | 19.202381% |
Noise dominated data is calculated using 1-second bins in cleaned event files. If a bin has >2000 counts, and if more than 50% of those come from <1% of pixels, then it is considered to be noise-dominated and hence unusable.
| Quadrant | # 1 sec bins | Bins with >0 counts | Bins with >2000 counts | High rate bins dominated by noise | Noise dominated (total time) | Noise dominated (detector-on time) | Marked lightcurve |
|---|---|---|---|---|---|---|---|
| A | 8399 | 8399 | 28 | 28 | 0.33% | 0.33% |  |
| B | 8399 | 8399 | 45 | 45 | 0.54% | 0.54% |  |
| C | 8400 | 8400 | 67 | 67 | 0.80% | 0.80% |  |
| D | 8400 | 8400 | 1408 | 1408 | 16.76% | 16.76% | 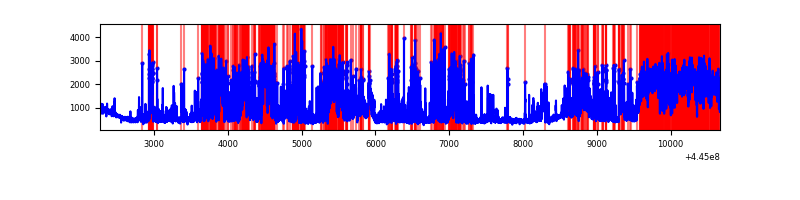 |
Top three noisy pixels from each quadrant. If the there are fewer than three noisy pixels in the level2.evt file, extra rows are filled as -1
| Pixel properties | Quadrant properties | ||||||
|---|---|---|---|---|---|---|---|
| Quadrant | DetID | PixID | Counts | Sigma | Mean | Median | Sigma |
| A | 10 | 83 | 2904234 | 14136.87 | 975 | 950 | 205.4 |
| A | 13 | 248 | 121317 | 586.1 | 975 | 950 | 205.4 |
| A | 15 | 174 | 37534 | 178.14 | 975 | 950 | 205.4 |
| B | 3 | 112 | 205715 | 1060.78 | 972 | 943 | 193.0 |
| B | 5 | 172 | 82510 | 422.54 | 972 | 943 | 193.0 |
| B | 4 | 171 | 69238 | 353.79 | 972 | 943 | 193.0 |
| C | 1 | 3 | 244482 | 1082.88 | 957 | 960 | 224.9 |
| C | 12 | 2 | 104216 | 459.16 | 957 | 960 | 224.9 |
| C | 15 | 208 | 81048 | 356.13 | 957 | 960 | 224.9 |
| D | 13 | 249 | 2189540 | 9486.09 | 904 | 876 | 230.7 |
| D | 4 | 232 | 1673449 | 7249.25 | 904 | 876 | 230.7 |
| D | 2 | 249 | 511092 | 2211.37 | 904 | 876 | 230.7 |
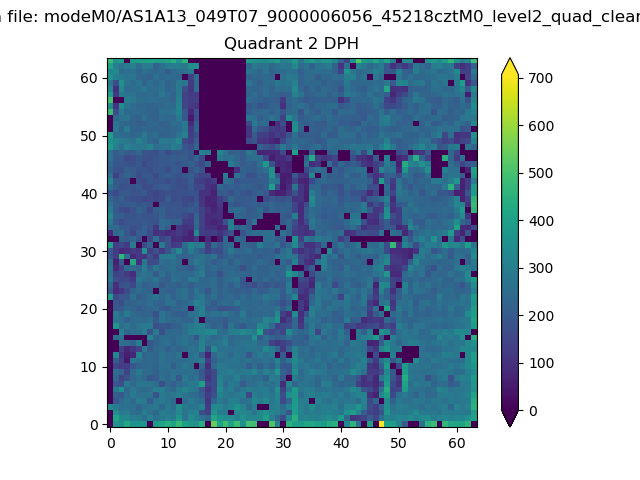
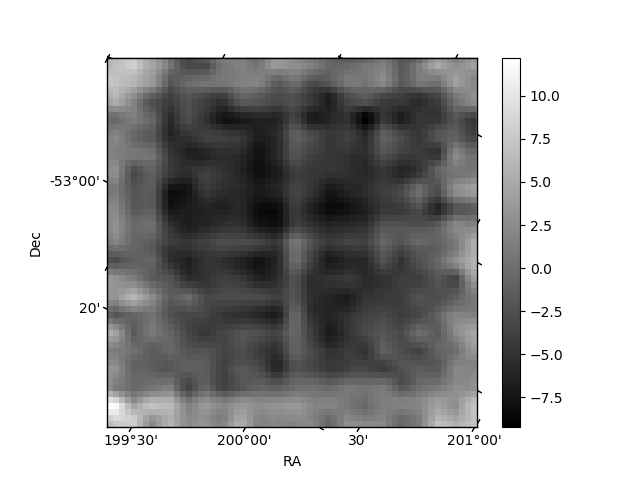
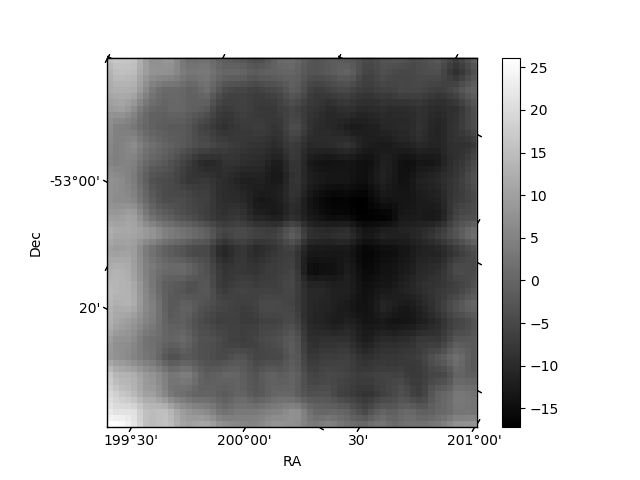
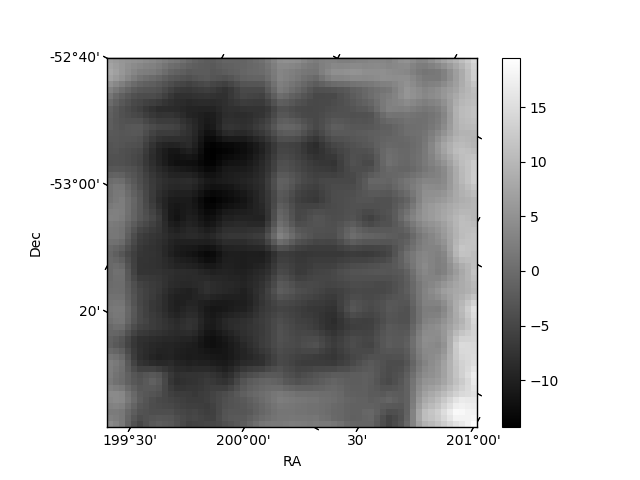
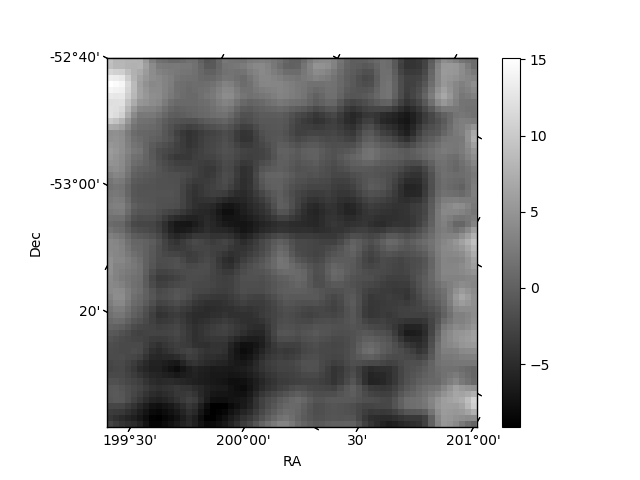
Histogram calculated using DETX and DETY for each event in the final _common_clean file
| Quadrant A | 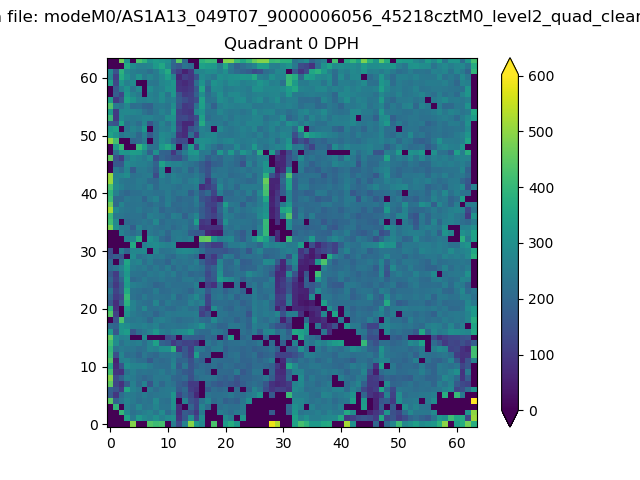 |
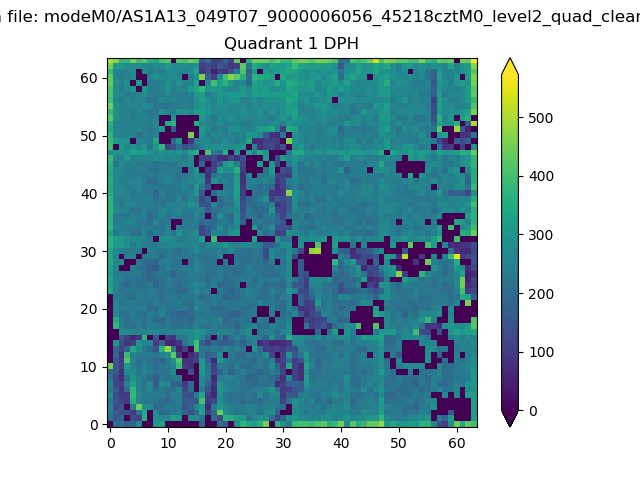 |
Quadrant B |
|---|---|---|---|
| Quadrant D | 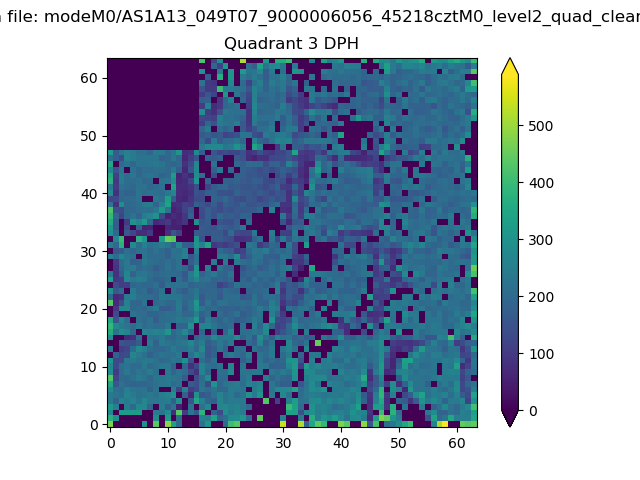 |
 |
Quadrant C |
| Plot type | Count rate plots | Images |
|---|---|---|
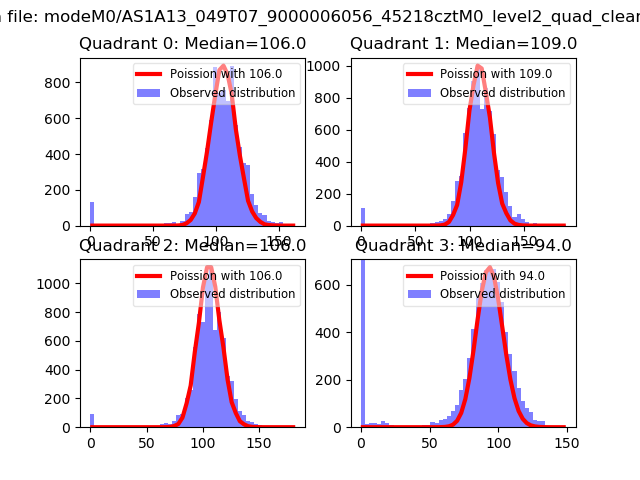
| Comparison with Poisson distribution Blue bars denote a histogram of data divided into 1 sec bins. Red curve is a Poisson curve with rate = median count rate of data. |
 |
 |
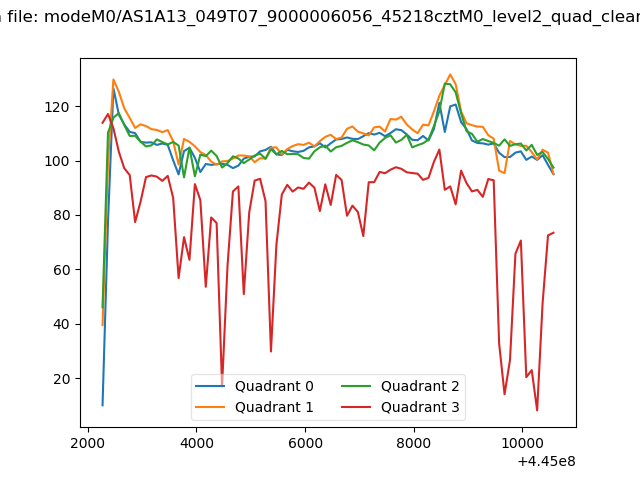
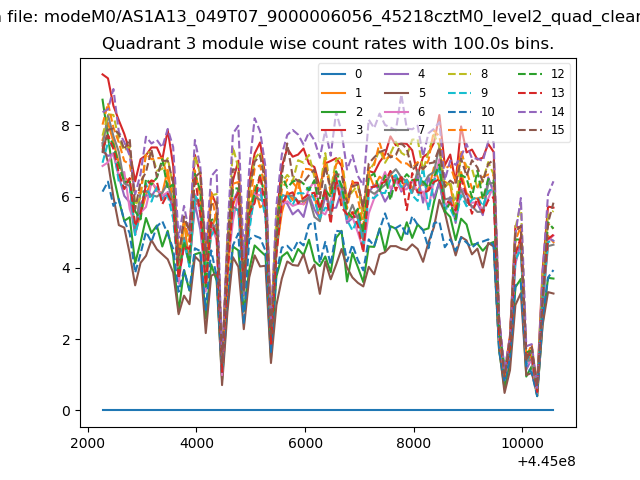
| Quadrant-wise count rates Data is divided into 100 sec bins |
 |
|
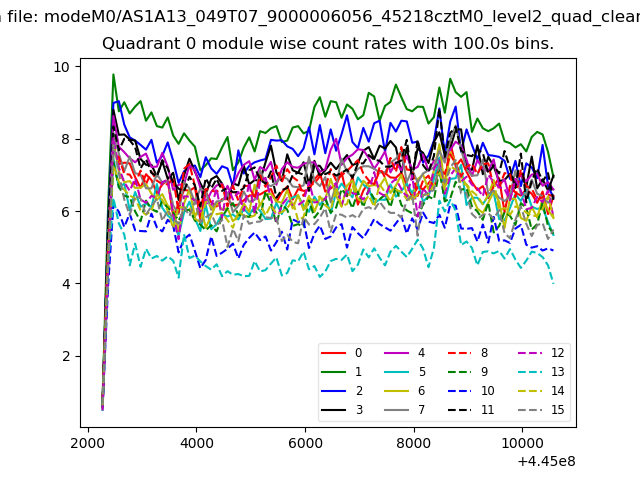
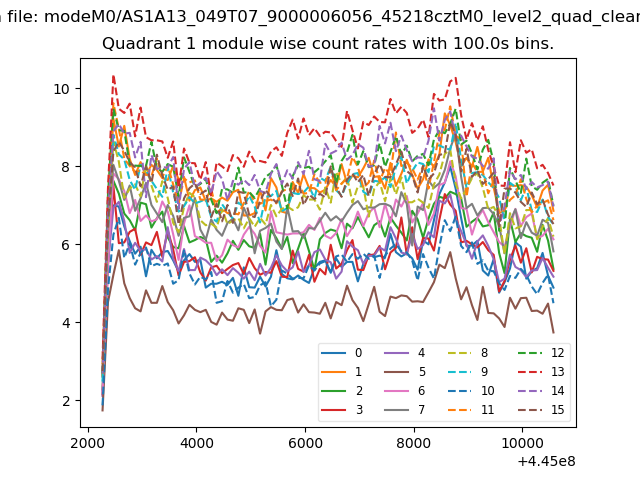
| Module-wise count rates for Quadrant A Data is divided into 100 sec bins |
 |
 |
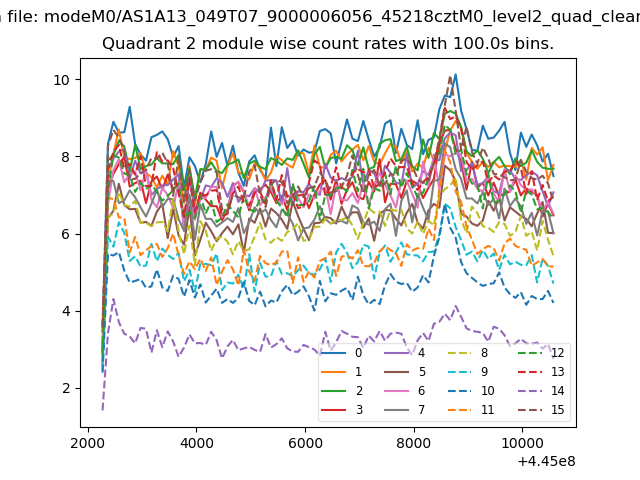
| Module-wise count rates for Quadrant B Data is divided into 100 sec bins |
 |
 |
| Module-wise count rates for Quadrant C Data is divided into 100 sec bins |
 |
 |
| Module-wise count rates for Quadrant D Data is divided into 100 sec bins |
 |
 |
| Parameter | Plot |
|---|---|
| CZT HV Monitor | 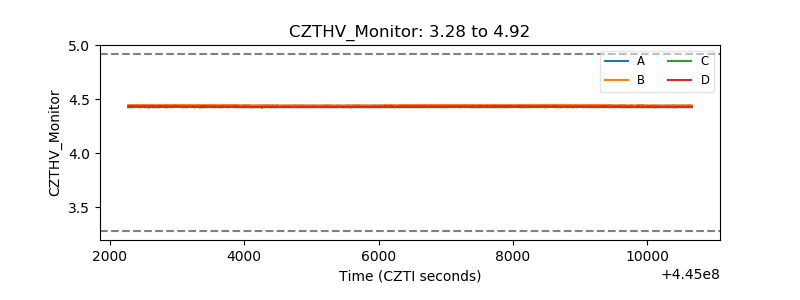 |
| D_VDD | 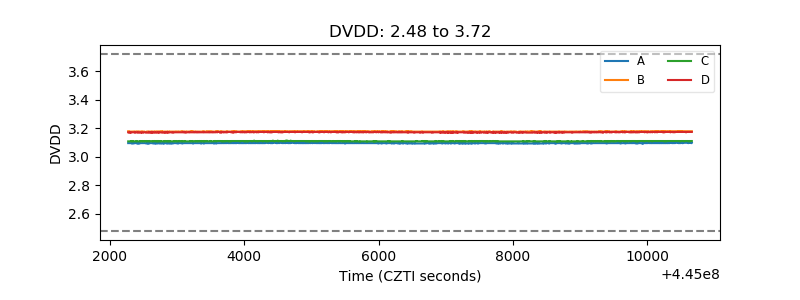 |
| Temperature 1 | 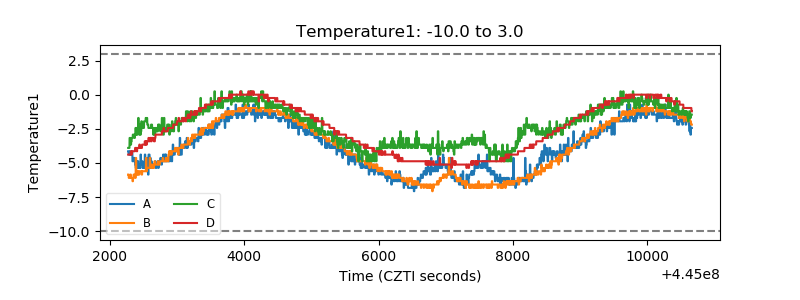 |
| Veto HV Monitor | 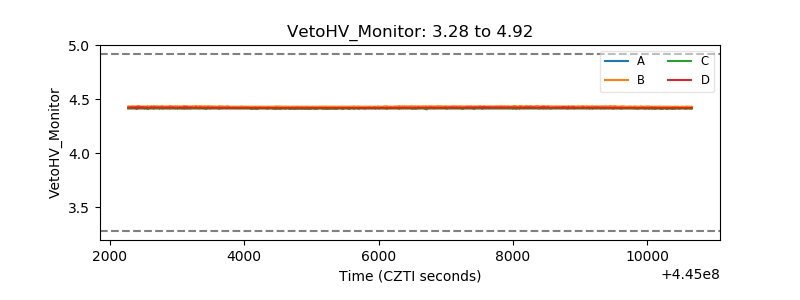 |
| Veto LLD | 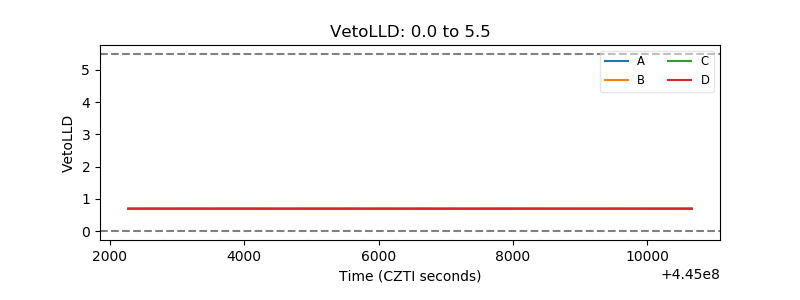 |
| Alpha Counter | 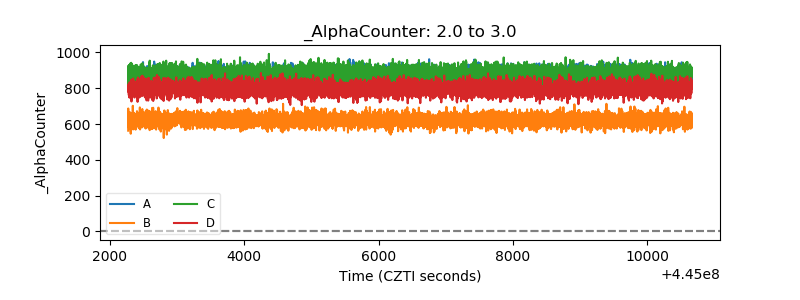 |
| _CPM_Rate | 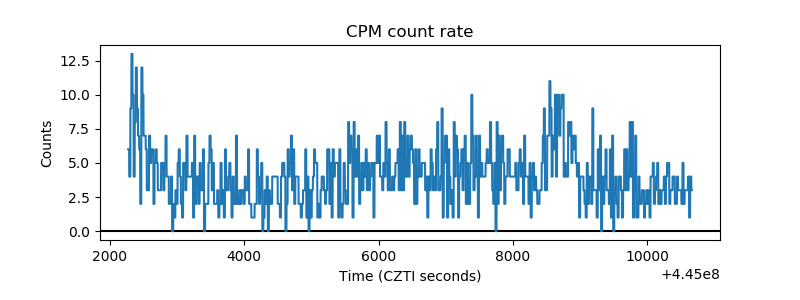 |
| CZT Counter | 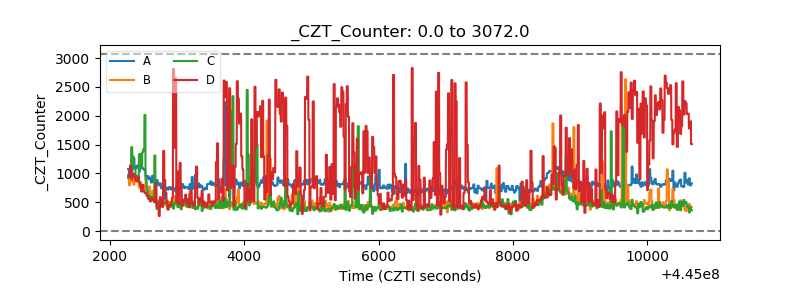 |
| +2.5 Volts monitor | 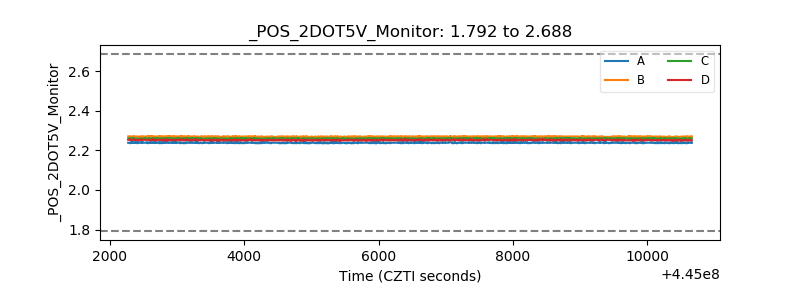 |
| +5 Volts monitor |  |
| _ROLL_ROT | 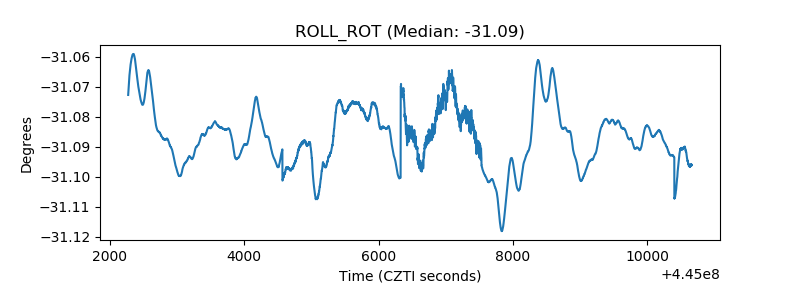 |
| _Roll_DEC | 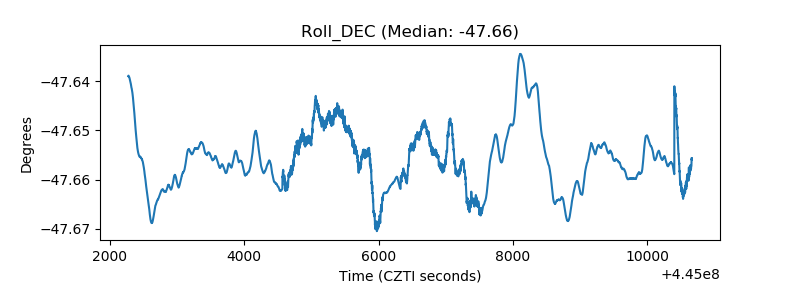 |
| _Roll_RA | 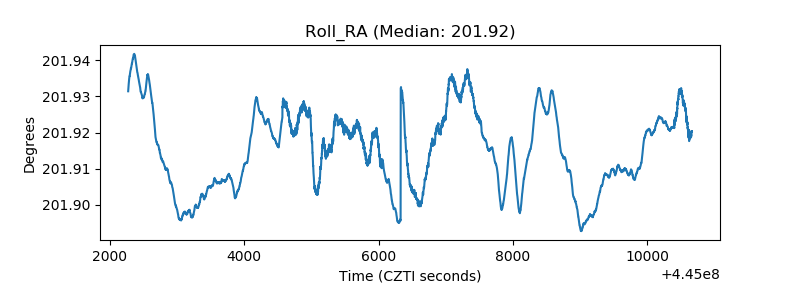 |
| Veto Counter | 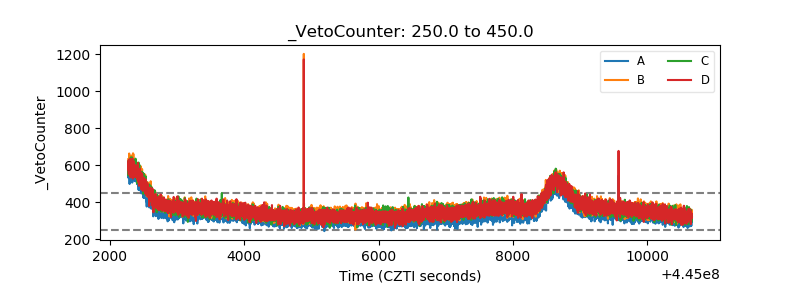 |