| Param | Original file | Final file |
|---|---|---|
| Filename | modeM0/AS1A13_049T07_9000006056_45223cztM0_level2.fits | modeM0/AS1A13_049T07_9000006056_45223cztM0_level2_quad_clean.evt |
| Size (bytes) | 1,783,457,280 | 343,100,160 |
| Size | 1.7 GB | 327.2 MB |
| Events in quadrant A | 18,522,606 | 2,333,953 |
| Events in quadrant B | 12,716,533 | 2,398,452 |
| Events in quadrant C | 10,560,843 | 2,379,579 |
| Events in quadrant D | 22,471,176 | 1,718,644 |
| Mode M0 | |||
|---|---|---|---|
| Quadrant | BADHDUFLAG | Total packets | Discarded packets |
| A | 0 | 71782 | 2 |
| B | 0 | 53127 | 2 |
| C | 0 | 48063 | 2 |
| D | 0 | 82395 | 2 |
| Mode M9 | |||
|---|---|---|---|
| Quadrant | BADHDUFLAG | Total packets | Discarded packets |
| A | 0 | 10 | 0 |
| B | 0 | 10 | 0 |
| C | 0 | 10 | 0 |
| D | 0 | 10 | 0 |
| Mode SS | |||
|---|---|---|---|
| Quadrant | BADHDUFLAG | Total packets | Discarded packets |
| A | 0 | 456 | 0 |
| B | 0 | 456 | 0 |
| C | 0 | 456 | 0 |
| D | 0 | 456 | 0 |
| Quadrant | Total seconds | Saturated seconds | Saturation percentage |
|---|---|---|---|
| A | 22614 | 821 | 3.630494% |
| B | 22614 | 918 | 4.059432% |
| C | 22614 | 190 | 0.840187% |
| D | 22615 | 3753 | 16.595180% |
Noise dominated data is calculated using 1-second bins in cleaned event files. If a bin has >2000 counts, and if more than 50% of those come from <1% of pixels, then it is considered to be noise-dominated and hence unusable.
| Quadrant | # 1 sec bins | Bins with >0 counts | Bins with >2000 counts | High rate bins dominated by noise | Noise dominated (total time) | Noise dominated (detector-on time) | Marked lightcurve |
|---|---|---|---|---|---|---|---|
| A | 23599 | 22614 | 166 | 166 | 0.70% | 0.73% | 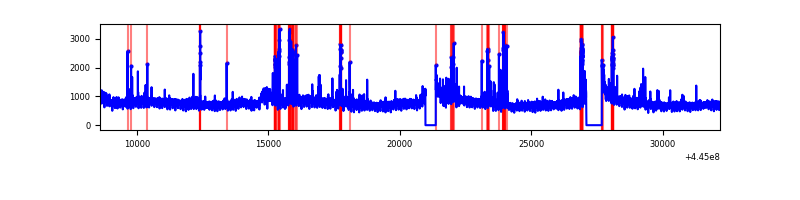 |
| B | 23599 | 22614 | 342 | 342 | 1.45% | 1.51% | 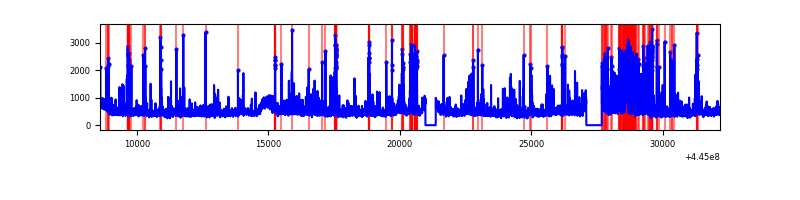 |
| C | 23599 | 22616 | 94 | 94 | 0.40% | 0.42% | 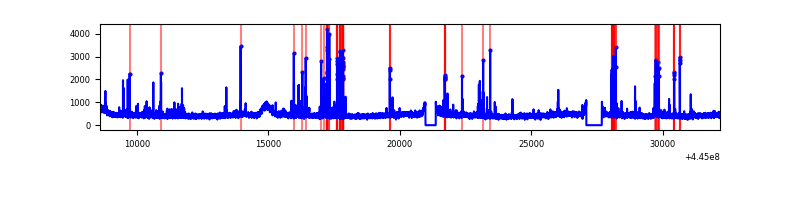 |
| D | 23600 | 22616 | 3164 | 3164 | 13.41% | 13.99% | 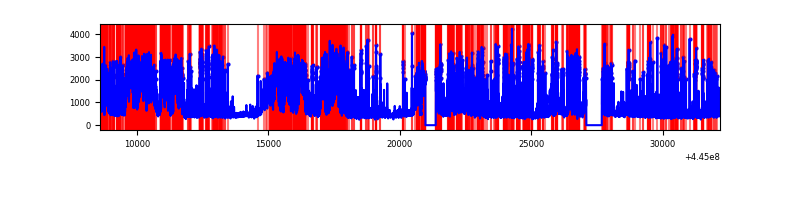 |
Top three noisy pixels from each quadrant. If the there are fewer than three noisy pixels in the level2.evt file, extra rows are filled as -1
| Pixel properties | Quadrant properties | ||||||
|---|---|---|---|---|---|---|---|
| Quadrant | DetID | PixID | Counts | Sigma | Mean | Median | Sigma |
| A | 10 | 83 | 7993175 | 15325.81 | 2511 | 2453 | 521.4 |
| A | 13 | 248 | 521955 | 996.38 | 2511 | 2453 | 521.4 |
| A | 12 | 227 | 152831 | 288.42 | 2511 | 2453 | 521.4 |
| B | 4 | 171 | 950848 | 1931.14 | 2507 | 2424 | 491.1 |
| B | 3 | 112 | 918145 | 1864.55 | 2507 | 2424 | 491.1 |
| B | 5 | 172 | 345642 | 698.85 | 2507 | 2424 | 491.1 |
| C | 14 | 254 | 379355 | 646.91 | 2495 | 2505 | 582.5 |
| C | 1 | 3 | 123761 | 208.15 | 2495 | 2505 | 582.5 |
| C | 12 | 2 | 104542 | 175.16 | 2495 | 2505 | 582.5 |
| D | 4 | 232 | 4020428 | 6817.27 | 2335 | 2263 | 589.4 |
| D | 13 | 249 | 3199402 | 5424.31 | 2335 | 2263 | 589.4 |
| D | 12 | 17 | 1675172 | 2838.28 | 2335 | 2263 | 589.4 |
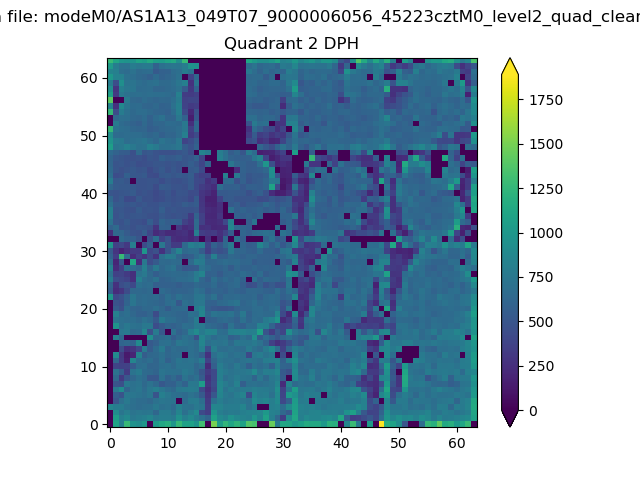
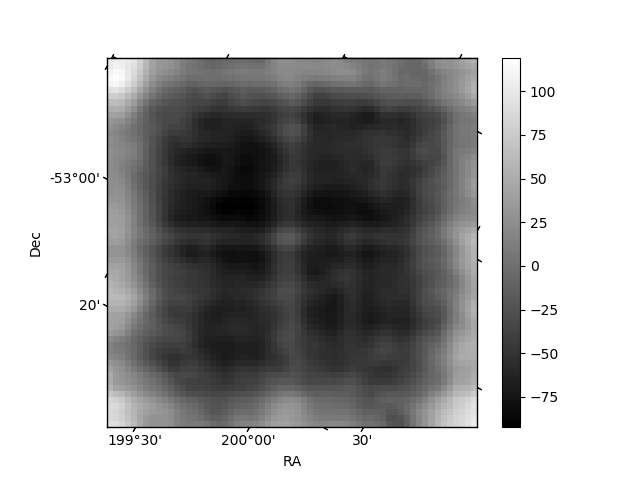
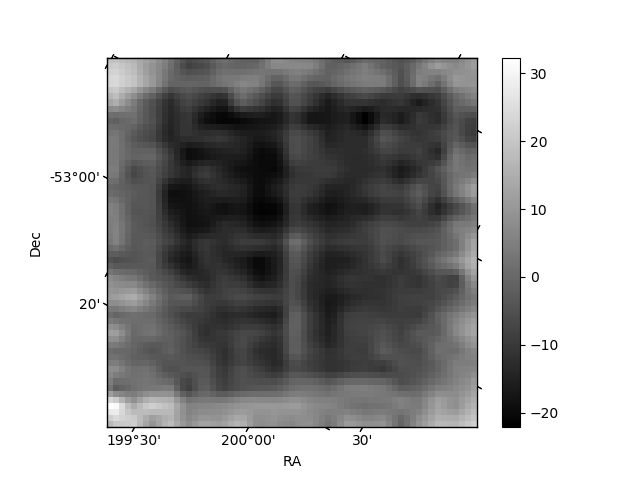
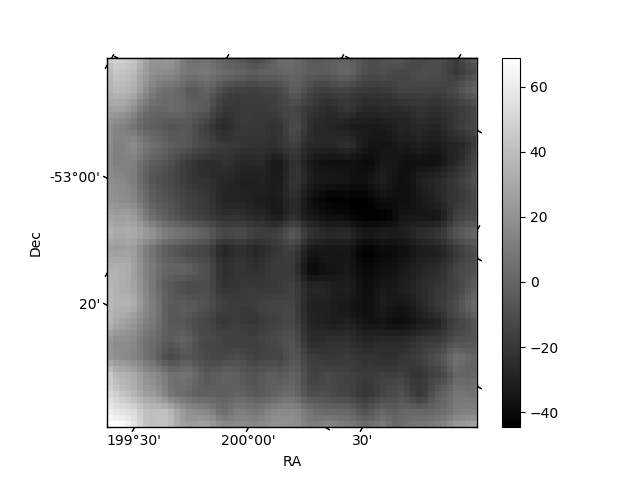
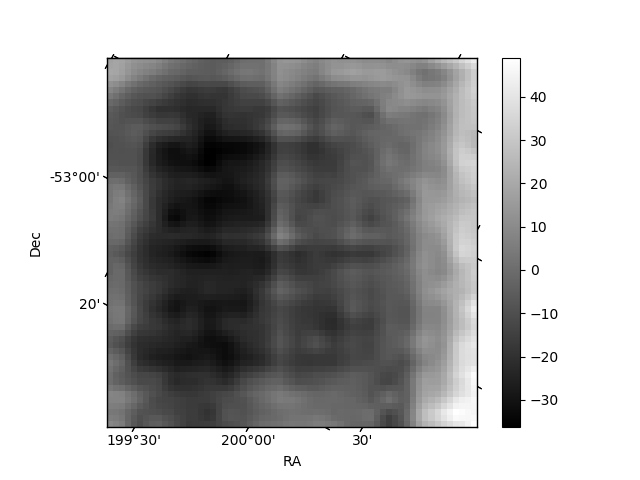
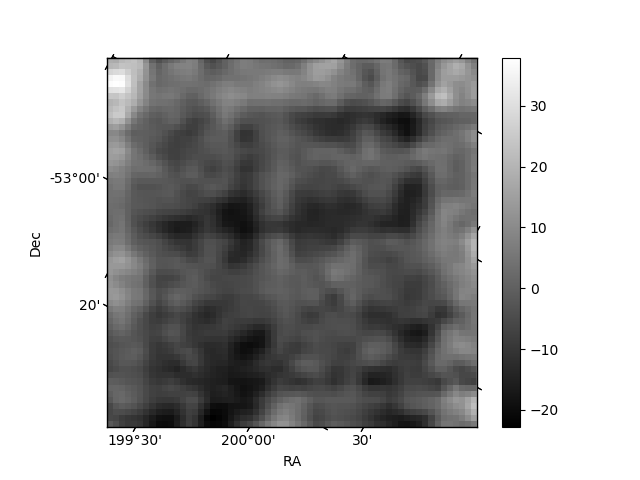
Histogram calculated using DETX and DETY for each event in the final _common_clean file
| Quadrant A | 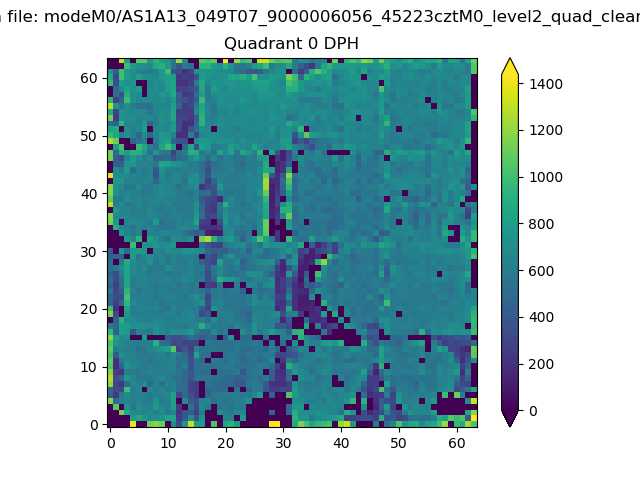 |
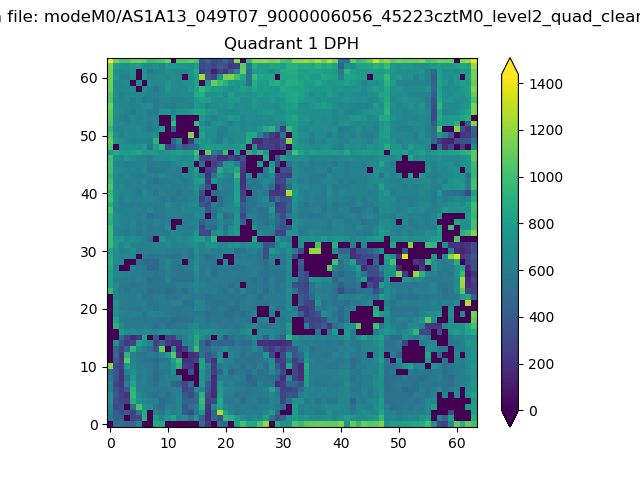 |
Quadrant B |
|---|---|---|---|
| Quadrant D | 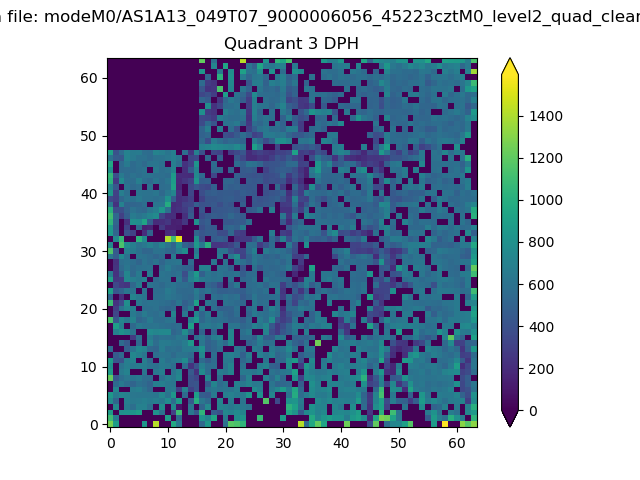 |
 |
Quadrant C |
| Plot type | Count rate plots | Images |
|---|---|---|
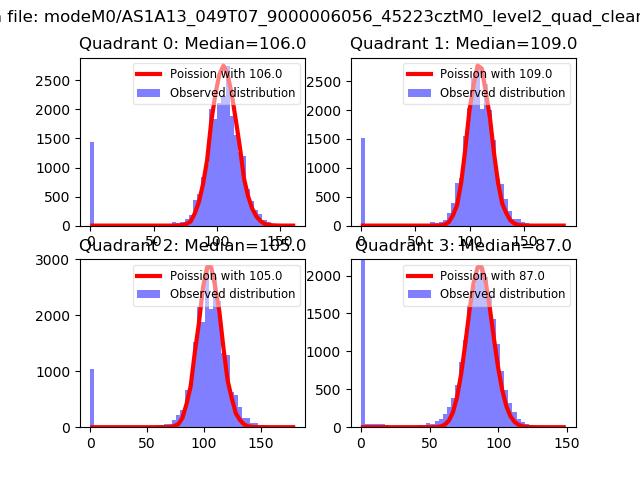
| Comparison with Poisson distribution Blue bars denote a histogram of data divided into 1 sec bins. Red curve is a Poisson curve with rate = median count rate of data. |
 |
 |
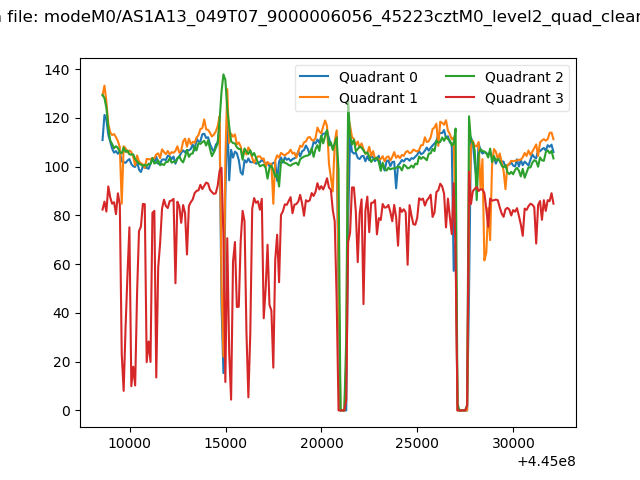
| Quadrant-wise count rates Data is divided into 100 sec bins |
 |
|
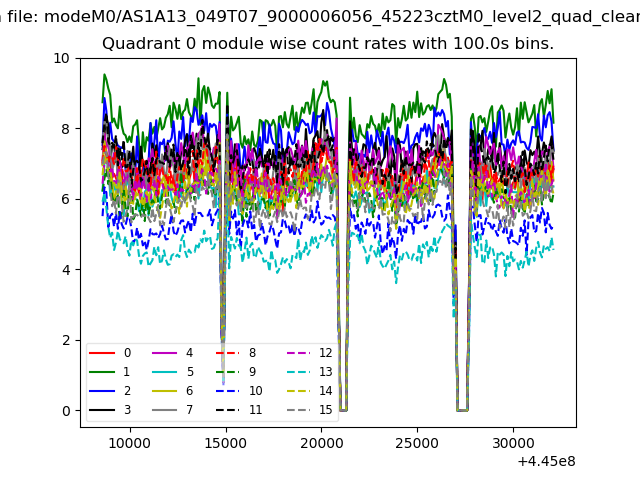
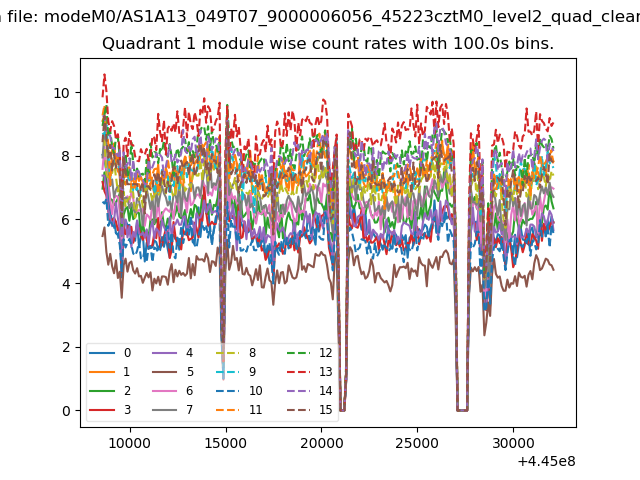
| Module-wise count rates for Quadrant A Data is divided into 100 sec bins |
 |
 |
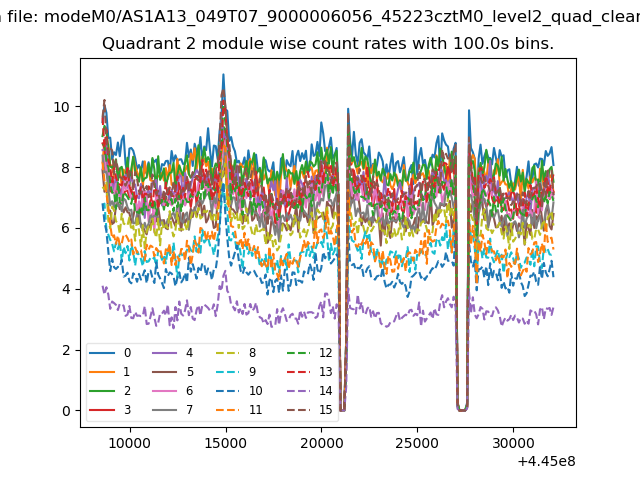
| Module-wise count rates for Quadrant B Data is divided into 100 sec bins |
 |
 |
| Module-wise count rates for Quadrant C Data is divided into 100 sec bins |
 |
 |
| Module-wise count rates for Quadrant D Data is divided into 100 sec bins |
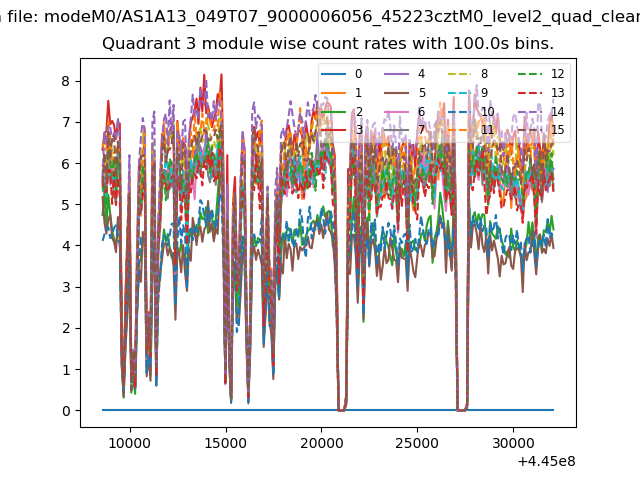 |
 |
| Parameter | Plot |
|---|---|
| CZT HV Monitor | 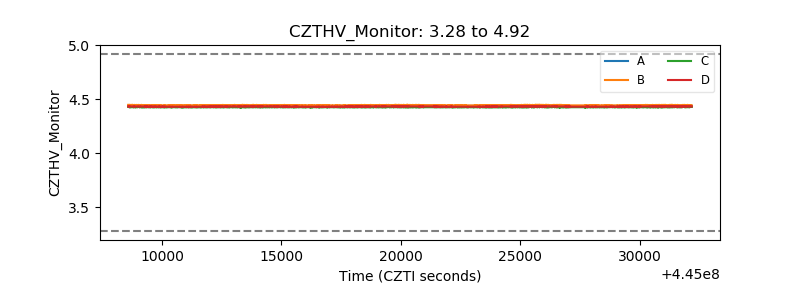 |
| D_VDD | 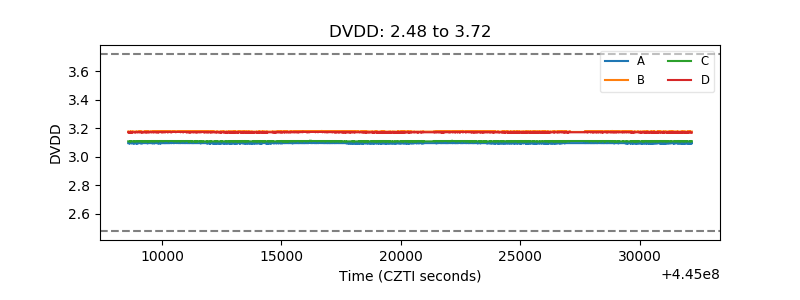 |
| Temperature 1 | 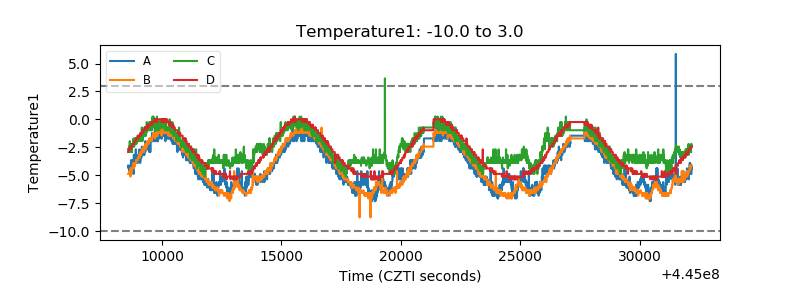 |
| Veto HV Monitor | 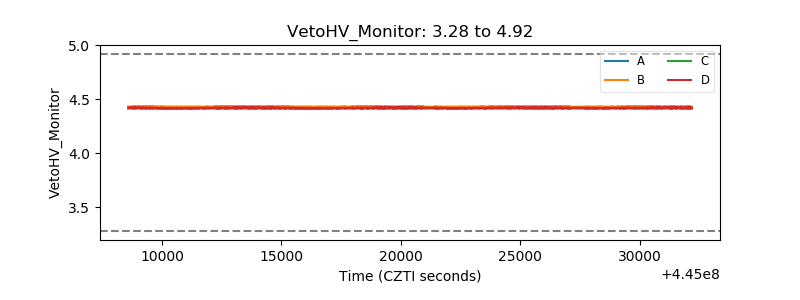 |
| Veto LLD | 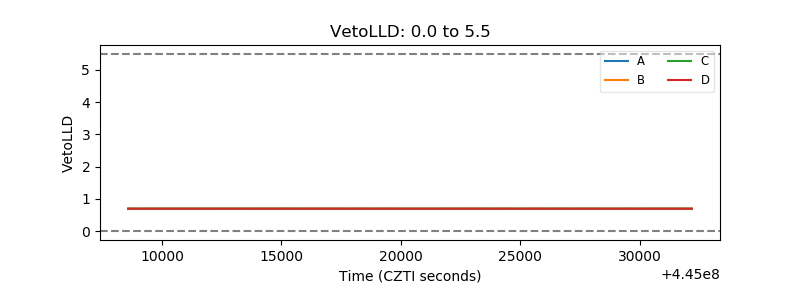 |
| Alpha Counter | 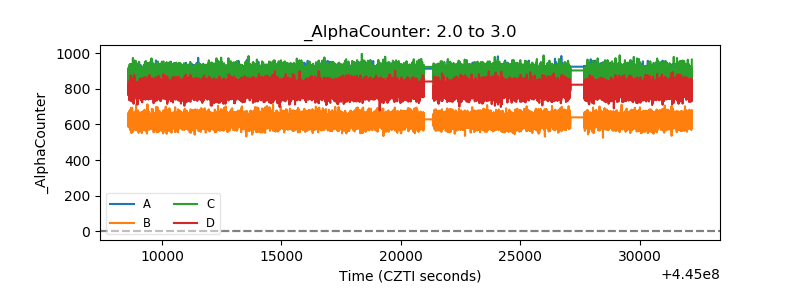 |
| _CPM_Rate | 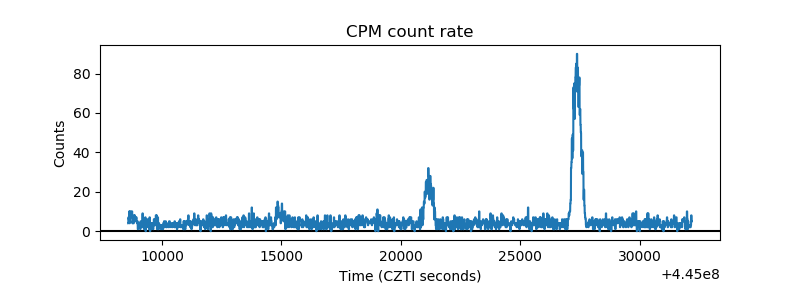 |
| CZT Counter | 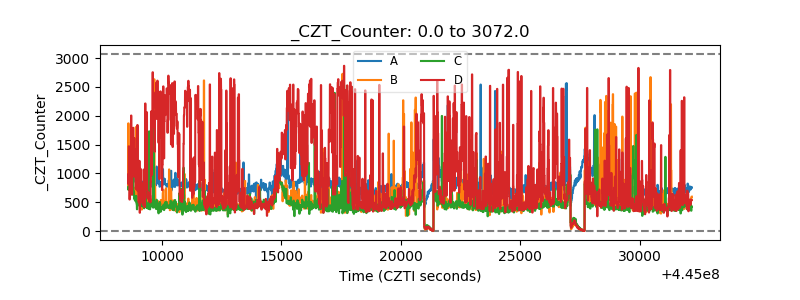 |
| +2.5 Volts monitor | 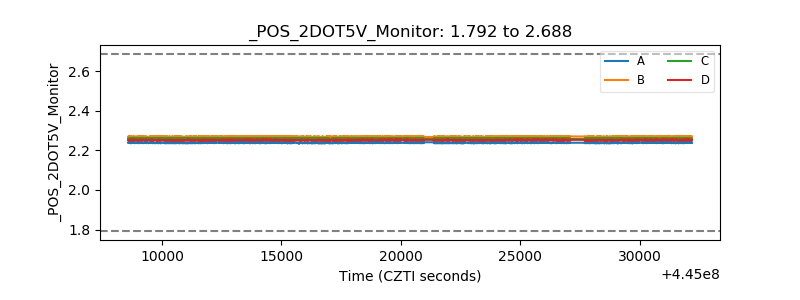 |
| +5 Volts monitor |  |
| _ROLL_ROT | 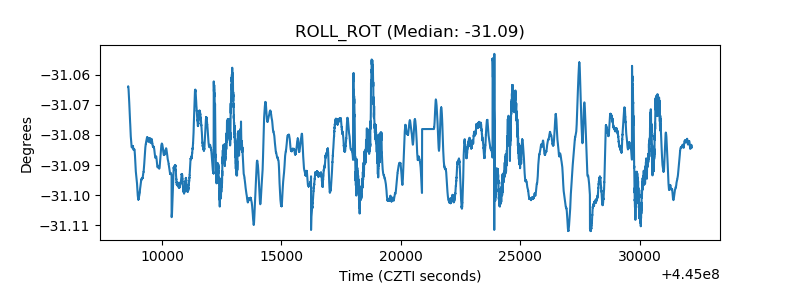 |
| _Roll_DEC | 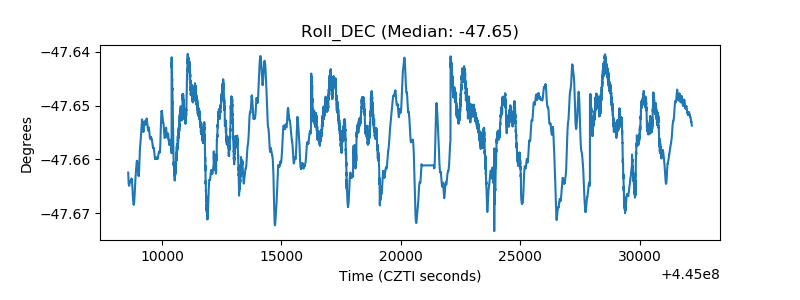 |
| _Roll_RA | 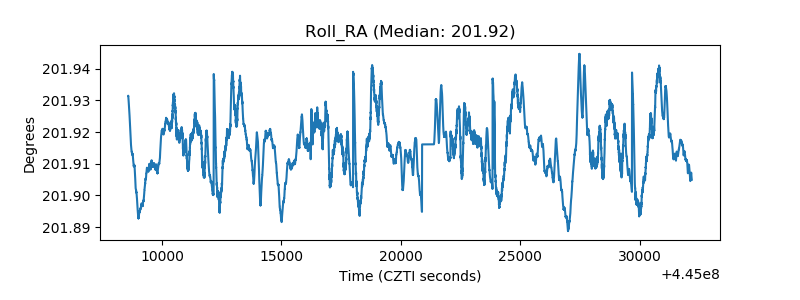 |
| Veto Counter | 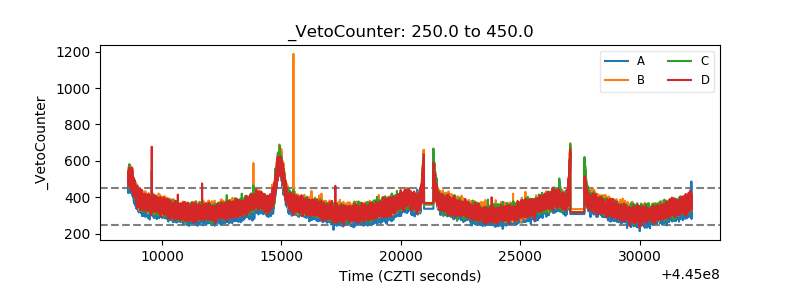 |