| Param | Original file | Final file |
|---|---|---|
| Filename | modeM0/AS1A13_049T07_9000006056_45225cztM0_level2.fits | modeM0/AS1A13_049T07_9000006056_45225cztM0_level2_quad_clean.evt |
| Size (bytes) | 1,030,685,760 | 215,075,520 |
| Size | 982.9 MB | 205.1 MB |
| Events in quadrant A | 11,019,892 | 1,445,225 |
| Events in quadrant B | 7,557,774 | 1,487,634 |
| Events in quadrant C | 6,262,349 | 1,456,328 |
| Events in quadrant D | 12,270,618 | 1,191,522 |
| Mode M0 | |||
|---|---|---|---|
| Quadrant | BADHDUFLAG | Total packets | Discarded packets |
| A | 0 | 43339 | 3 |
| B | 0 | 31523 | 3 |
| C | 0 | 28137 | 3 |
| D | 0 | 45851 | 3 |
| Mode M9 | |||
|---|---|---|---|
| Quadrant | BADHDUFLAG | Total packets | Discarded packets |
| A | 0 | 29 | 0 |
| B | 0 | 29 | 0 |
| C | 0 | 29 | 0 |
| D | 0 | 29 | 0 |
| Mode SS | |||
|---|---|---|---|
| Quadrant | BADHDUFLAG | Total packets | Discarded packets |
| A | 0 | 276 | 0 |
| B | 0 | 276 | 0 |
| C | 0 | 276 | 0 |
| D | 0 | 276 | 0 |
| Quadrant | Total seconds | Saturated seconds | Saturation percentage |
|---|---|---|---|
| A | 13476 | 392 | 2.908875% |
| B | 13476 | 414 | 3.072128% |
| C | 13476 | 35 | 0.259721% |
| D | 13477 | 1465 | 10.870372% |
Noise dominated data is calculated using 1-second bins in cleaned event files. If a bin has >2000 counts, and if more than 50% of those come from <1% of pixels, then it is considered to be noise-dominated and hence unusable.
| Quadrant | # 1 sec bins | Bins with >0 counts | Bins with >2000 counts | High rate bins dominated by noise | Noise dominated (total time) | Noise dominated (detector-on time) | Marked lightcurve |
|---|---|---|---|---|---|---|---|
| A | 16376 | 13478 | 76 | 76 | 0.46% | 0.56% | 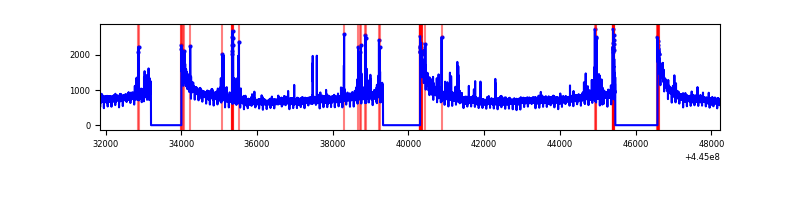 |
| B | 16376 | 13478 | 266 | 266 | 1.62% | 1.97% | 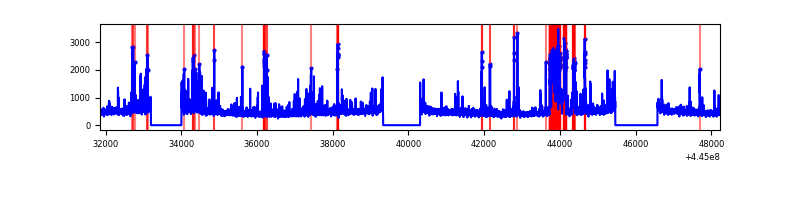 |
| C | 16376 | 13478 | 16 | 16 | 0.10% | 0.12% | 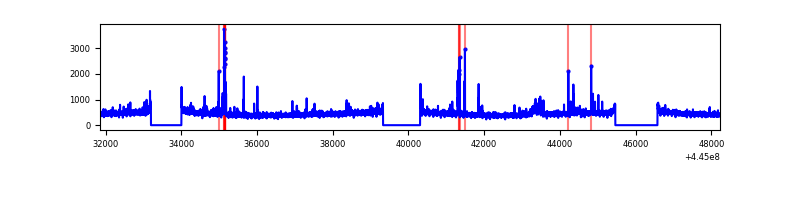 |
| D | 16377 | 13479 | 1336 | 1336 | 8.16% | 9.91% | 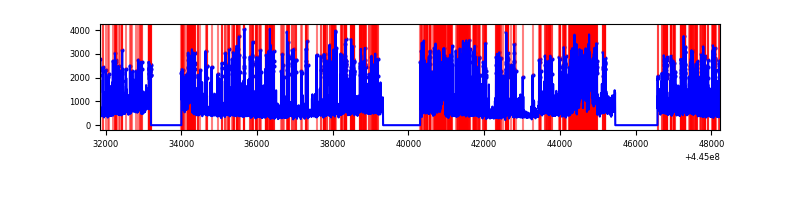 |
Top three noisy pixels from each quadrant. If the there are fewer than three noisy pixels in the level2.evt file, extra rows are filled as -1
| Pixel properties | Quadrant properties | ||||||
|---|---|---|---|---|---|---|---|
| Quadrant | DetID | PixID | Counts | Sigma | Mean | Median | Sigma |
| A | 10 | 83 | 4926060 | 15799.37 | 1502 | 1469 | 311.7 |
| A | 13 | 248 | 154467 | 490.86 | 1502 | 1469 | 311.7 |
| A | 2 | 79 | 68959 | 216.53 | 1502 | 1469 | 311.7 |
| B | 5 | 32 | 674354 | 2295.47 | 1508 | 1460 | 293.1 |
| B | 3 | 112 | 450679 | 1532.44 | 1508 | 1460 | 293.1 |
| B | 5 | 172 | 249333 | 845.58 | 1508 | 1460 | 293.1 |
| C | 12 | 2 | 231972 | 660.73 | 1497 | 1506 | 348.8 |
| C | 14 | 254 | 81234 | 228.57 | 1497 | 1506 | 348.8 |
| C | 3 | 233 | 72605 | 203.84 | 1497 | 1506 | 348.8 |
| D | 13 | 249 | 2458434 | 7009.37 | 1414 | 1374 | 350.5 |
| D | 5 | 235 | 1211433 | 3451.99 | 1414 | 1374 | 350.5 |
| D | 11 | 241 | 798023 | 2272.64 | 1414 | 1374 | 350.5 |
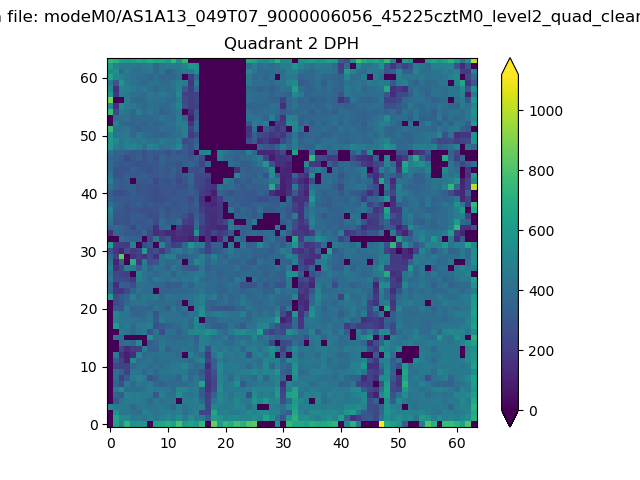
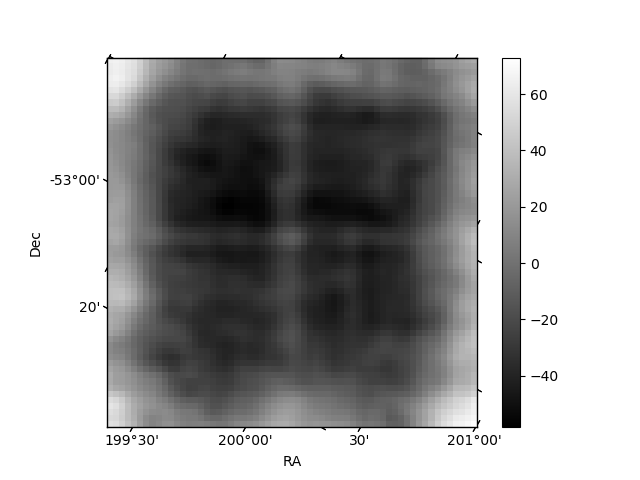
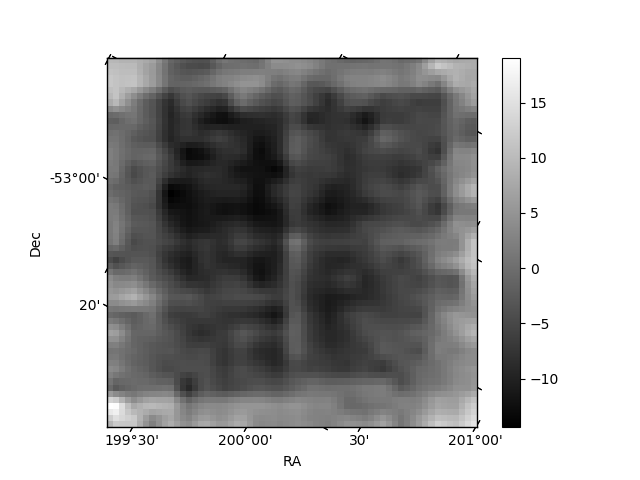
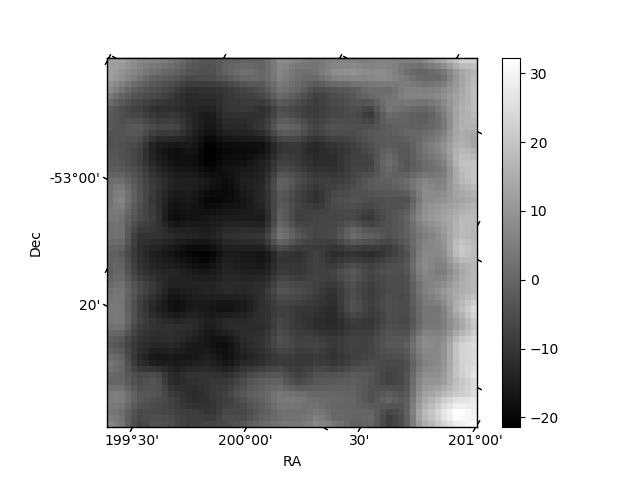
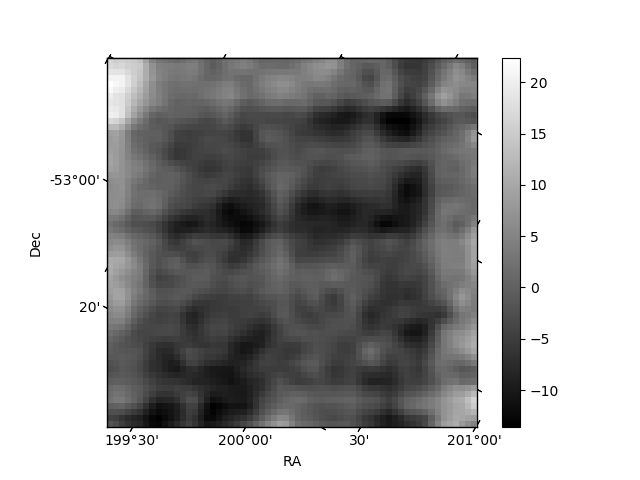
Histogram calculated using DETX and DETY for each event in the final _common_clean file
| Quadrant A | 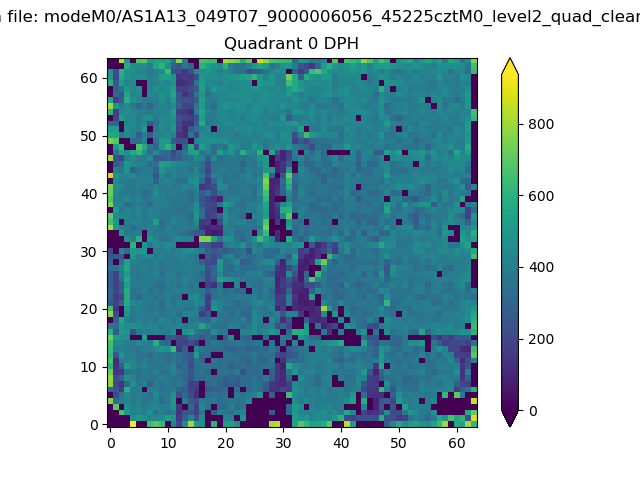 |
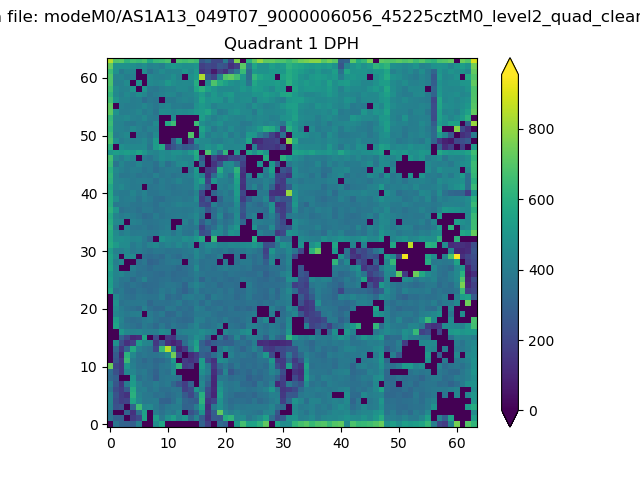 |
Quadrant B |
|---|---|---|---|
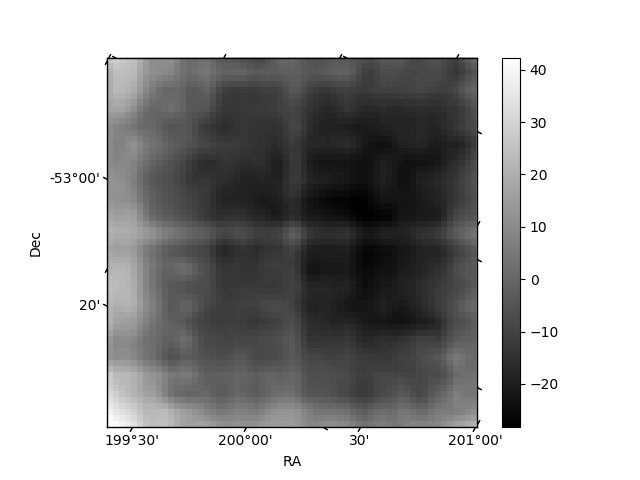
| Quadrant D | 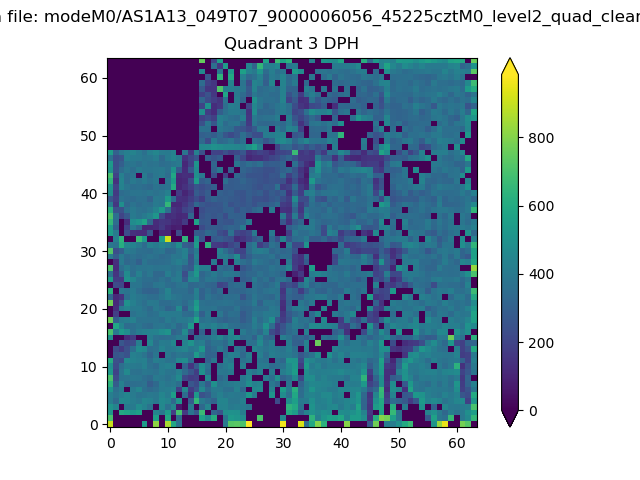 |
 |
Quadrant C |
| Plot type | Count rate plots | Images |
|---|---|---|
| Comparison with Poisson distribution Blue bars denote a histogram of data divided into 1 sec bins. Red curve is a Poisson curve with rate = median count rate of data. |
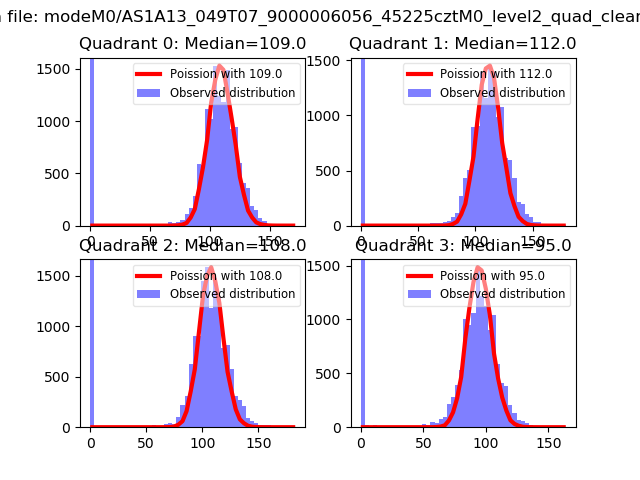 |
 |
| Quadrant-wise count rates Data is divided into 100 sec bins |
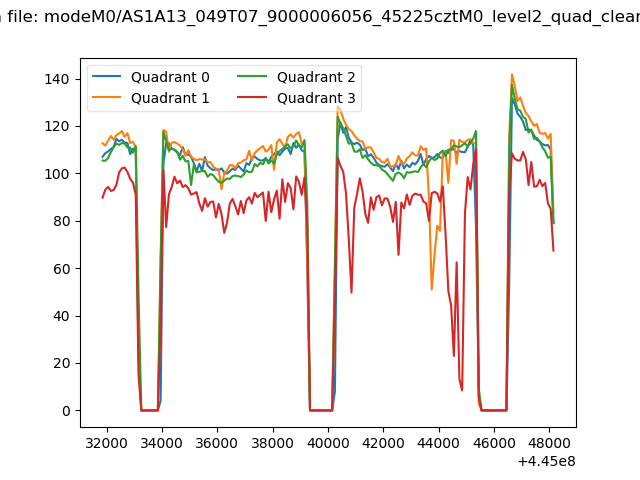 |
|
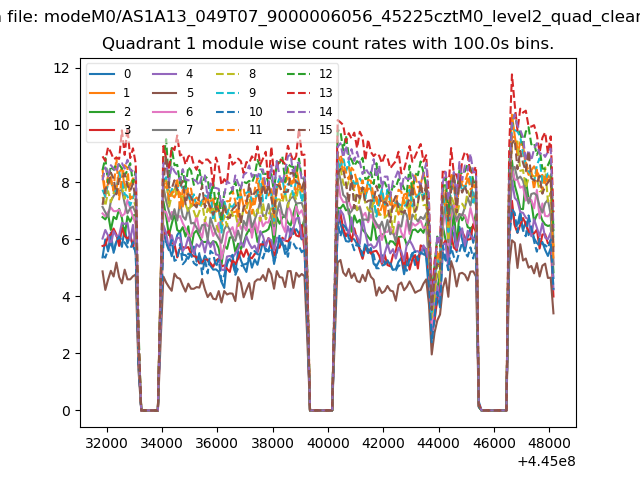
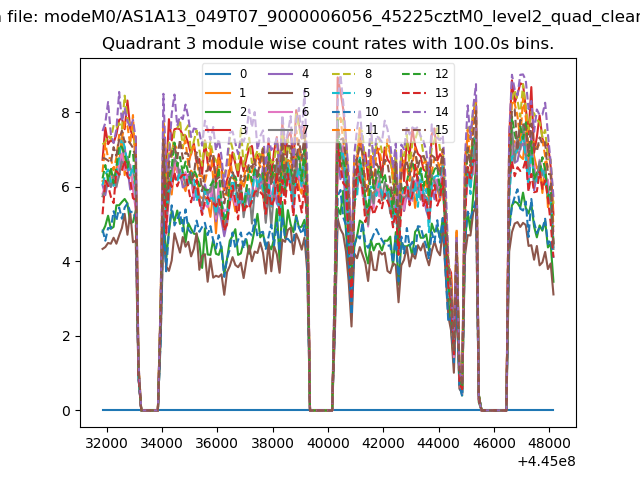
| Module-wise count rates for Quadrant A Data is divided into 100 sec bins |
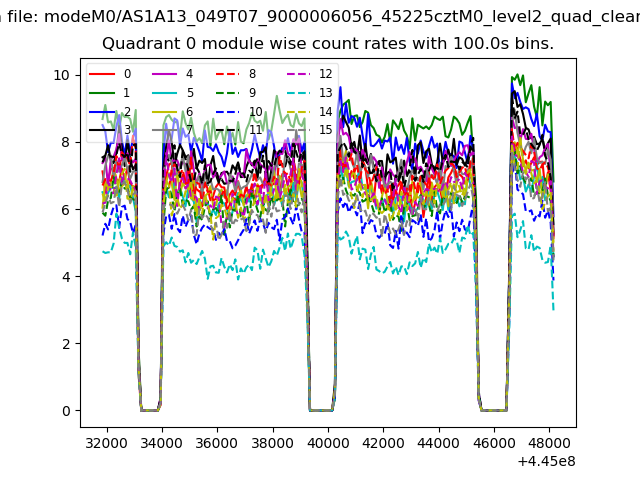 |
 |
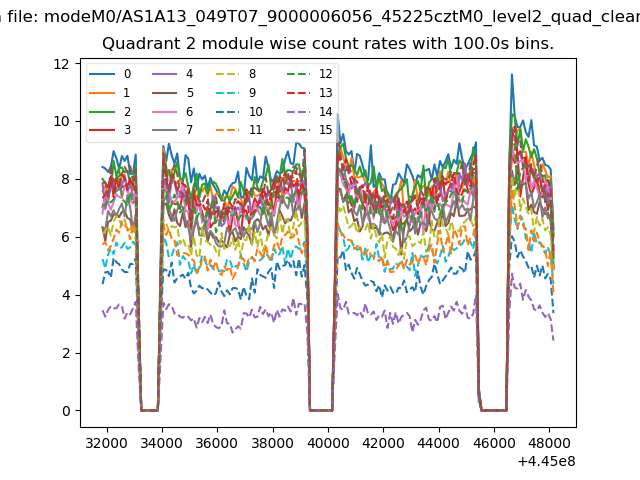
| Module-wise count rates for Quadrant B Data is divided into 100 sec bins |
 |
 |
| Module-wise count rates for Quadrant C Data is divided into 100 sec bins |
 |
 |
| Module-wise count rates for Quadrant D Data is divided into 100 sec bins |
 |
 |
| Parameter | Plot |
|---|---|
| CZT HV Monitor | 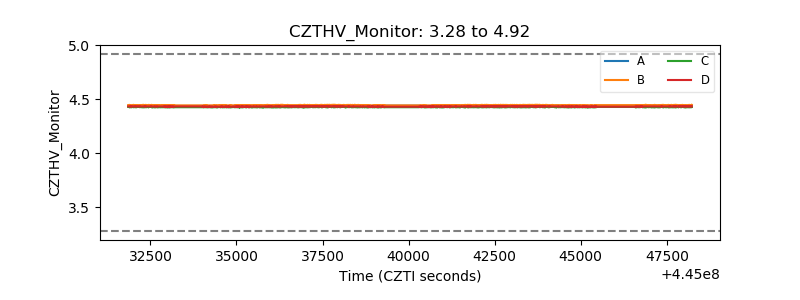 |
| D_VDD | 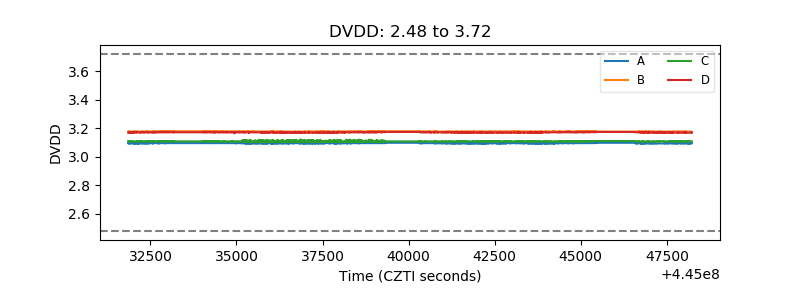 |
| Temperature 1 | 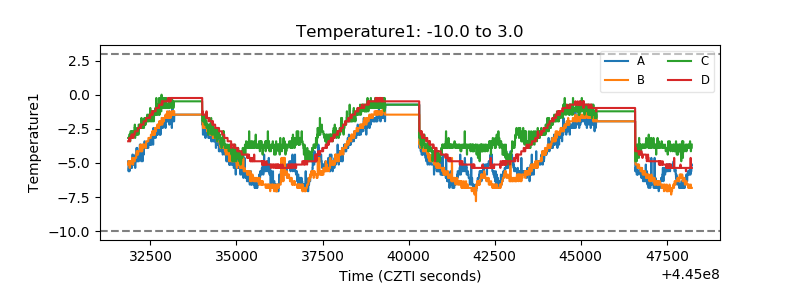 |
| Veto HV Monitor | 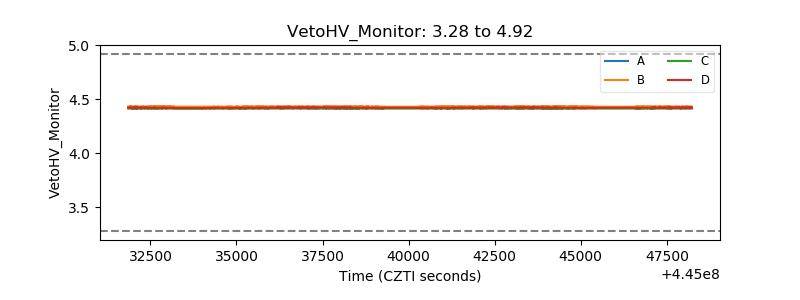 |
| Veto LLD | 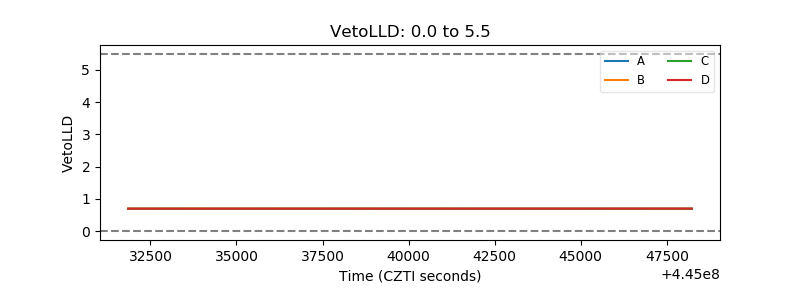 |
| Alpha Counter | 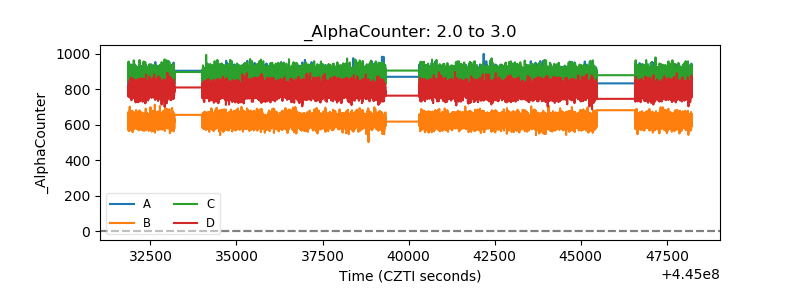 |
| _CPM_Rate | 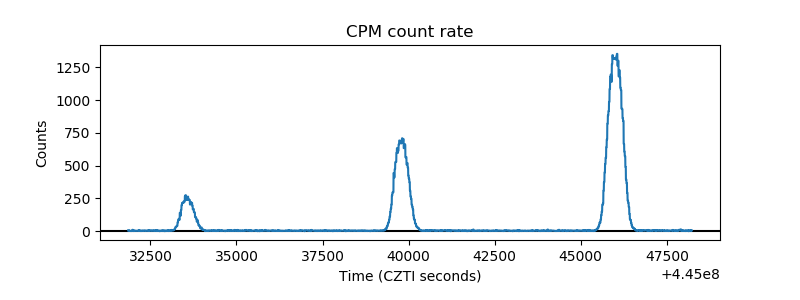 |
| CZT Counter | 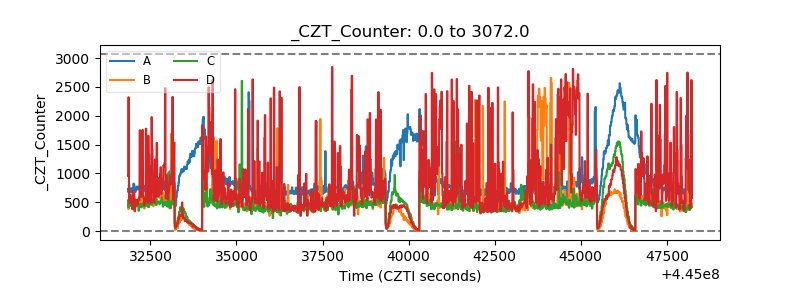 |
| +2.5 Volts monitor |  |
| +5 Volts monitor | 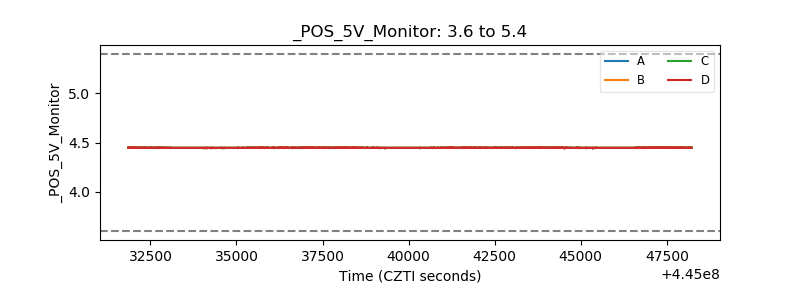 |
| _ROLL_ROT | 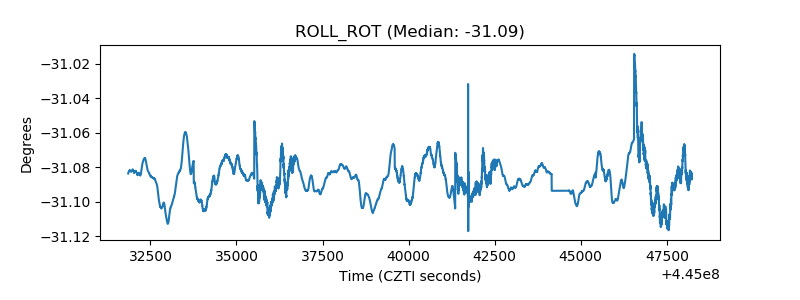 |
| _Roll_DEC | 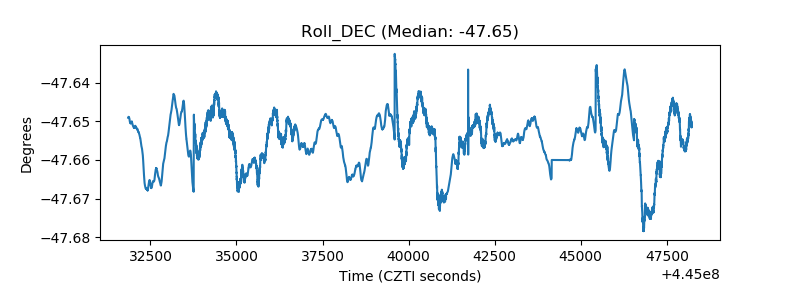 |
| _Roll_RA | 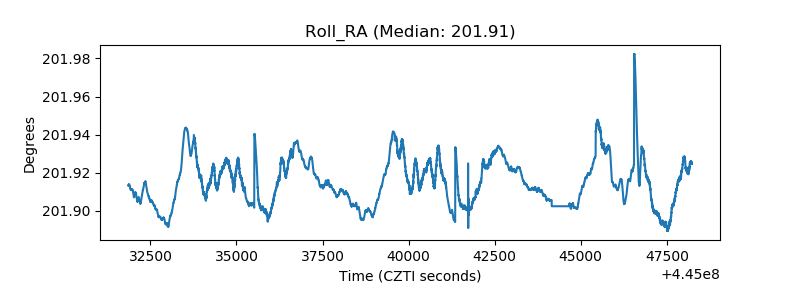 |
| Veto Counter | 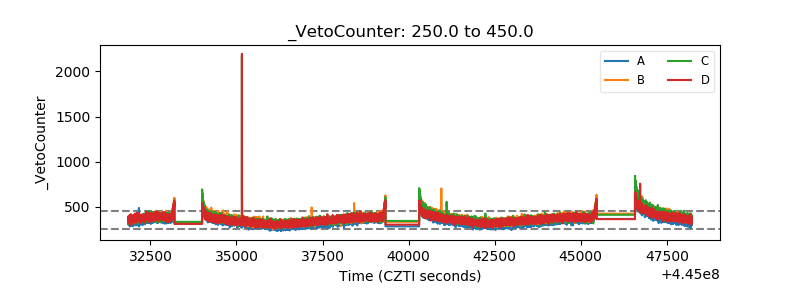 |