| Param | Original file | Final file |
|---|---|---|
| Filename | modeM0/AS1A13_049T07_9000006056_45226cztM0_level2.fits | modeM0/AS1A13_049T07_9000006056_45226cztM0_level2_quad_clean.evt |
| Size (bytes) | 472,446,720 | 113,624,640 |
| Size | 450.6 MB | 108.4 MB |
| Events in quadrant A | 5,454,996 | 752,090 |
| Events in quadrant B | 3,455,137 | 798,576 |
| Events in quadrant C | 3,081,044 | 767,340 |
| Events in quadrant D | 4,986,403 | 663,961 |
| Mode M0 | |||
|---|---|---|---|
| Quadrant | BADHDUFLAG | Total packets | Discarded packets |
| A | 0 | 21327 | 2 |
| B | 0 | 14579 | 2 |
| C | 0 | 13682 | 2 |
| D | 0 | 19322 | 2 |
| Mode M9 | |||
|---|---|---|---|
| Quadrant | BADHDUFLAG | Total packets | Discarded packets |
| A | 0 | 17 | 0 |
| B | 0 | 17 | 0 |
| C | 0 | 18 | 0 |
| D | 0 | 18 | 0 |
| Mode SS | |||
|---|---|---|---|
| Quadrant | BADHDUFLAG | Total packets | Discarded packets |
| A | 0 | 132 | 0 |
| B | 0 | 132 | 0 |
| C | 0 | 132 | 0 |
| D | 0 | 132 | 0 |
| Quadrant | Total seconds | Saturated seconds | Saturation percentage |
|---|---|---|---|
| A | 6583 | 164 | 2.491265% |
| B | 6583 | 99 | 1.503874% |
| C | 6583 | 33 | 0.501291% |
| D | 6583 | 401 | 6.091448% |
Noise dominated data is calculated using 1-second bins in cleaned event files. If a bin has >2000 counts, and if more than 50% of those come from <1% of pixels, then it is considered to be noise-dominated and hence unusable.
| Quadrant | # 1 sec bins | Bins with >0 counts | Bins with >2000 counts | High rate bins dominated by noise | Noise dominated (total time) | Noise dominated (detector-on time) | Marked lightcurve |
|---|---|---|---|---|---|---|---|
| A | 7753 | 6583 | 29 | 29 | 0.37% | 0.44% | 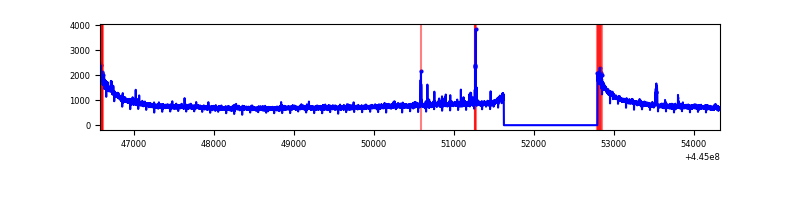 |
| B | 7753 | 6584 | 59 | 59 | 0.76% | 0.90% | 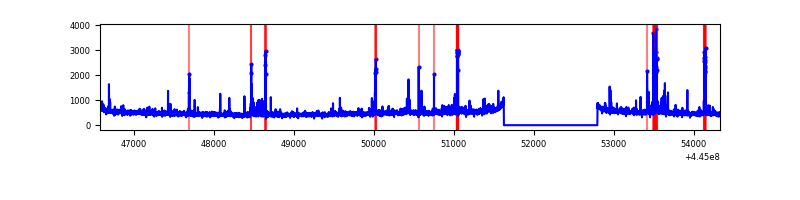 |
| C | 7753 | 6584 | 7 | 7 | 0.09% | 0.11% |  |
| D | 7753 | 6584 | 369 | 369 | 4.76% | 5.60% | 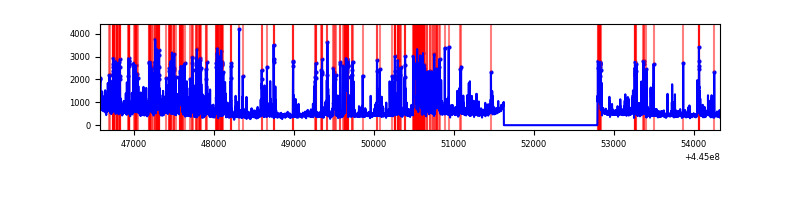 |
Top three noisy pixels from each quadrant. If the there are fewer than three noisy pixels in the level2.evt file, extra rows are filled as -1
| Pixel properties | Quadrant properties | ||||||
|---|---|---|---|---|---|---|---|
| Quadrant | DetID | PixID | Counts | Sigma | Mean | Median | Sigma |
| A | 10 | 83 | 2475995 | 15935.87 | 751 | 736 | 155.3 |
| A | 13 | 248 | 36668 | 231.33 | 751 | 736 | 155.3 |
| A | 2 | 79 | 35477 | 223.66 | 751 | 736 | 155.3 |
| B | 5 | 32 | 157280 | 1057.18 | 761 | 738 | 148.1 |
| B | 3 | 112 | 146869 | 986.87 | 761 | 738 | 148.1 |
| B | 5 | 172 | 51360 | 341.87 | 761 | 738 | 148.1 |
| C | 12 | 2 | 60421 | 334.5 | 760 | 766 | 178.3 |
| C | 2 | 14 | 25900 | 140.93 | 760 | 766 | 178.3 |
| C | 3 | 233 | 19175 | 103.22 | 760 | 766 | 178.3 |
| D | 13 | 249 | 915547 | 5056.47 | 727 | 708 | 180.9 |
| D | 5 | 235 | 358182 | 1975.82 | 727 | 708 | 180.9 |
| D | 2 | 249 | 236600 | 1303.81 | 727 | 708 | 180.9 |
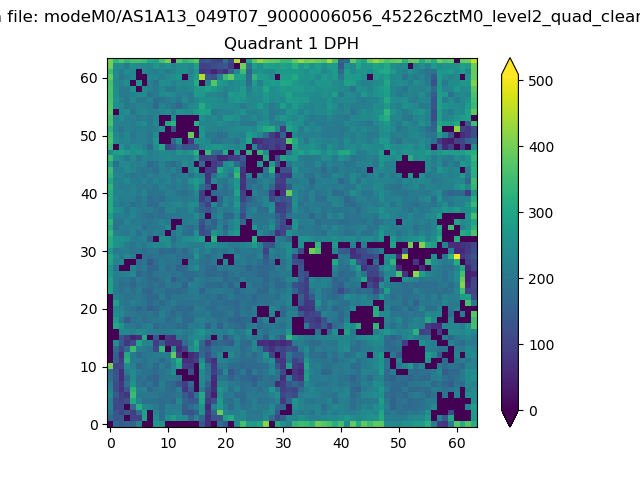
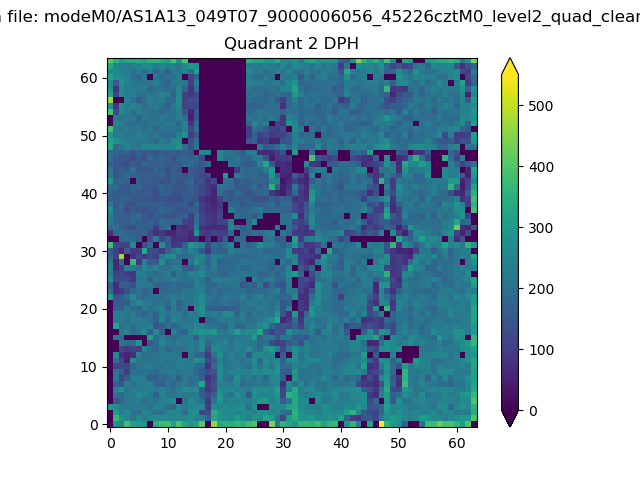
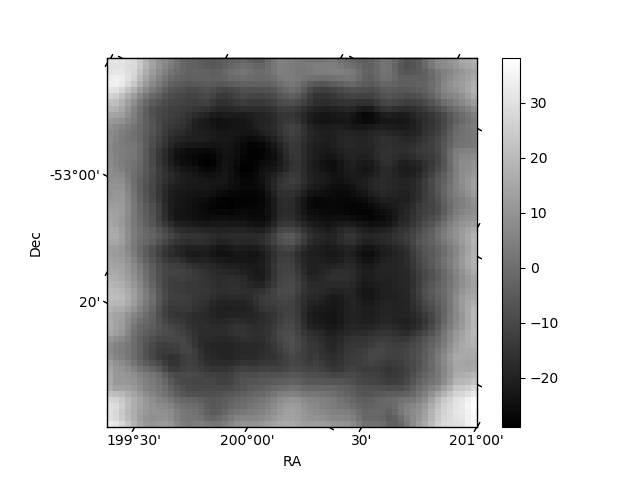
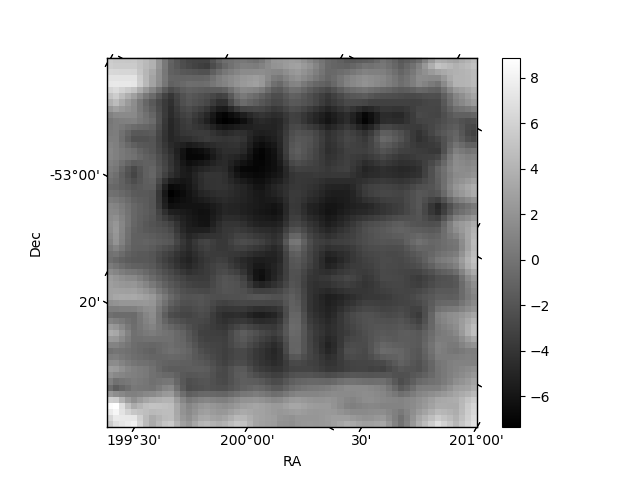
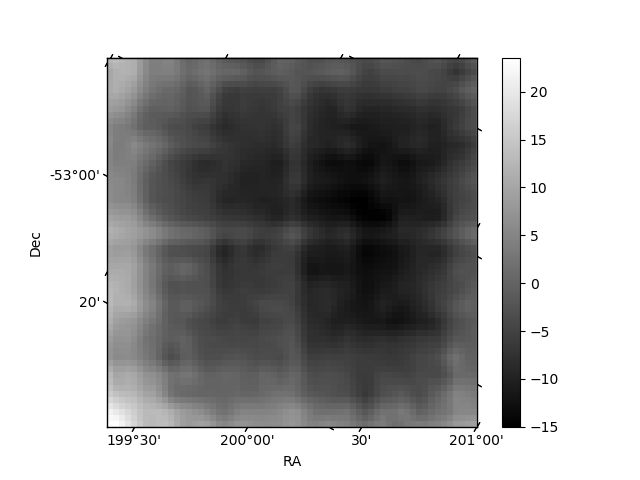
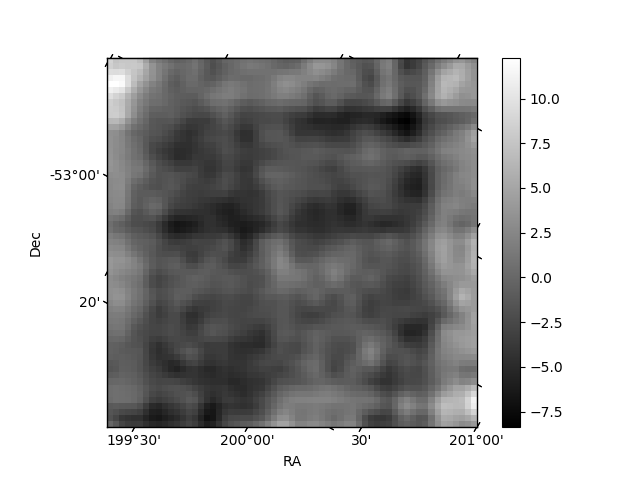
Histogram calculated using DETX and DETY for each event in the final _common_clean file
| Quadrant A | 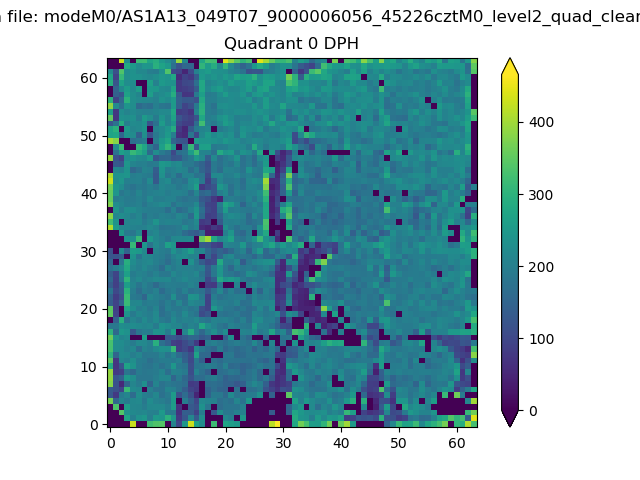 |
 |
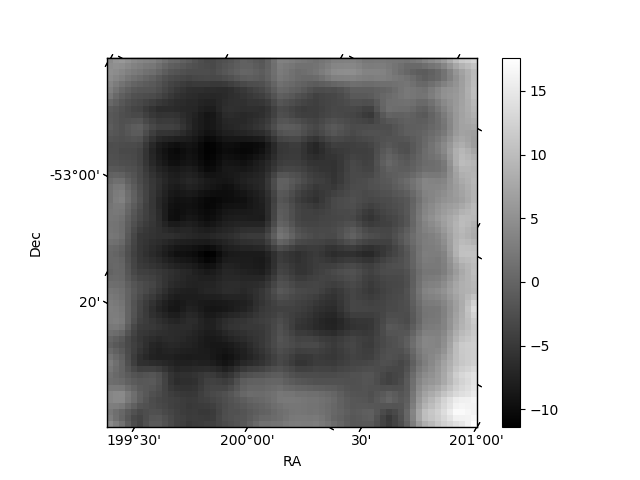
Quadrant B |
|---|---|---|---|
| Quadrant D | 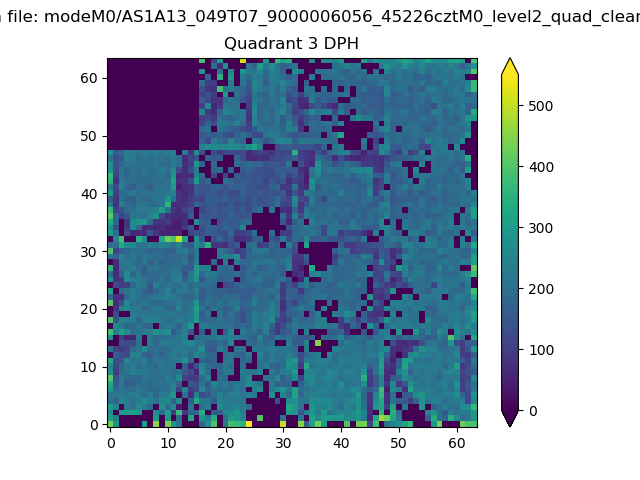 |
 |
Quadrant C |
| Plot type | Count rate plots | Images |
|---|---|---|
| Comparison with Poisson distribution Blue bars denote a histogram of data divided into 1 sec bins. Red curve is a Poisson curve with rate = median count rate of data. |
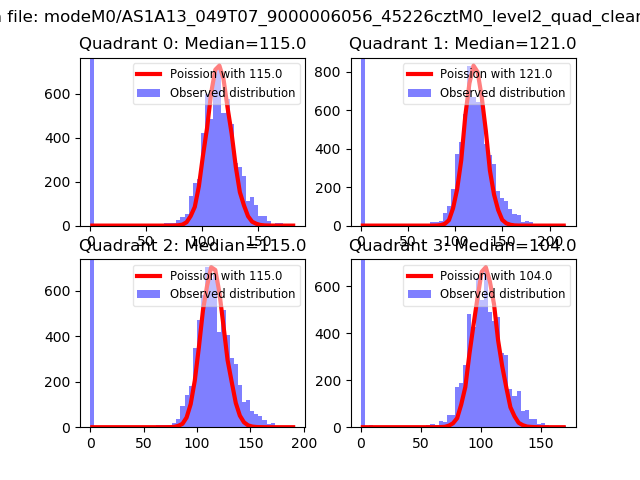 |
 |
| Quadrant-wise count rates Data is divided into 100 sec bins |
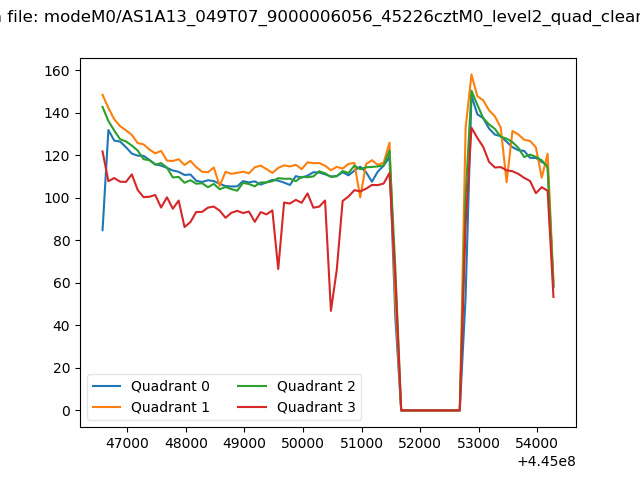 |
|
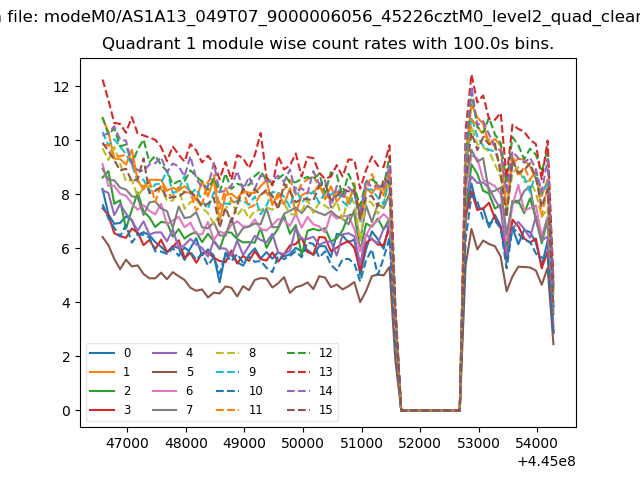
| Module-wise count rates for Quadrant A Data is divided into 100 sec bins |
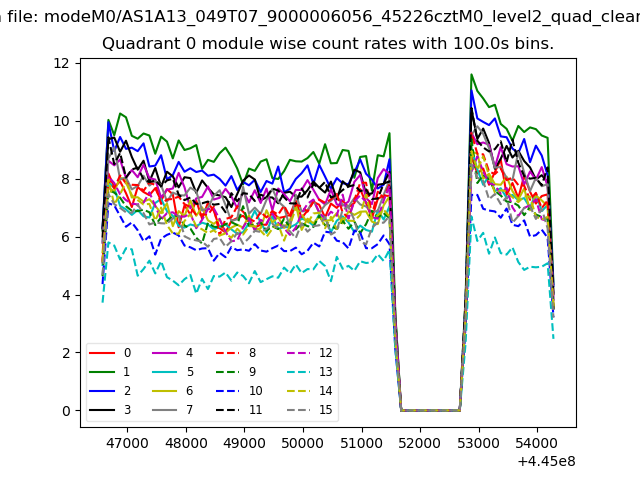 |
 |
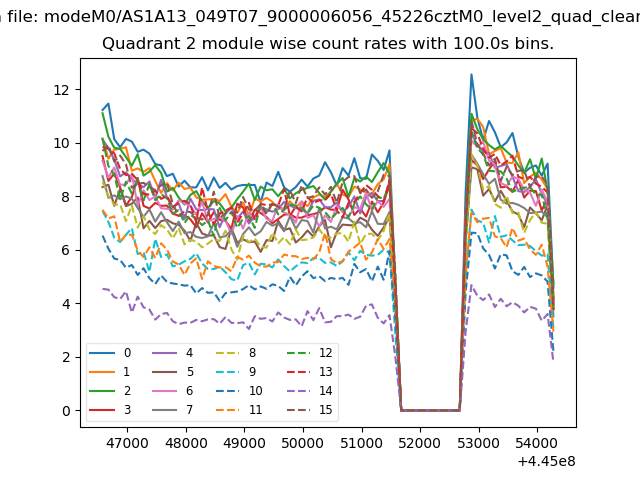
| Module-wise count rates for Quadrant B Data is divided into 100 sec bins |
 |
 |
| Module-wise count rates for Quadrant C Data is divided into 100 sec bins |
 |
 |
| Module-wise count rates for Quadrant D Data is divided into 100 sec bins |
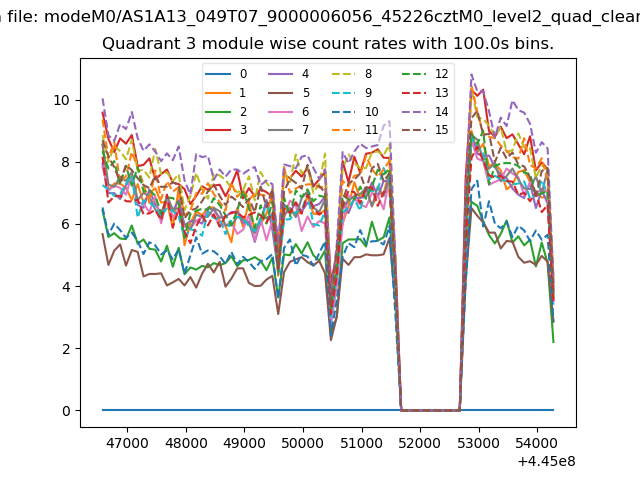 |
 |
| Parameter | Plot |
|---|---|
| CZT HV Monitor | 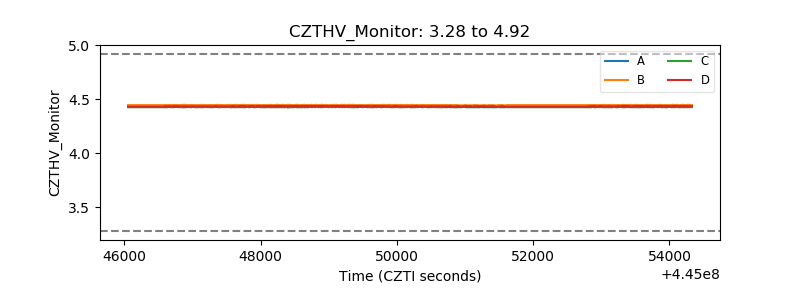 |
| D_VDD | 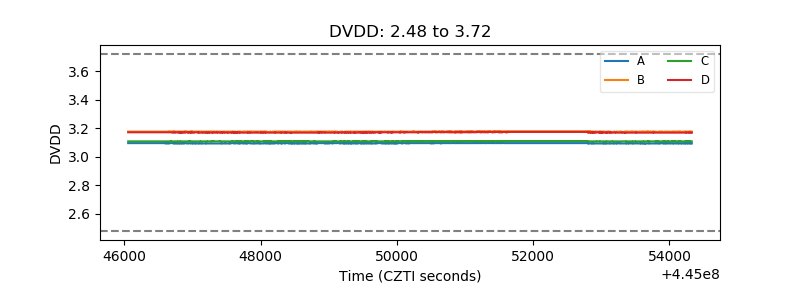 |
| Temperature 1 | 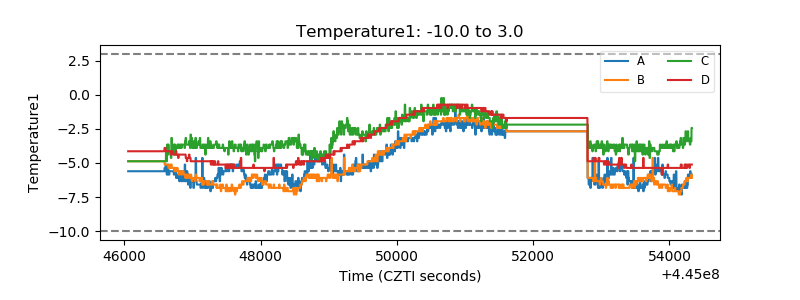 |
| Veto HV Monitor | 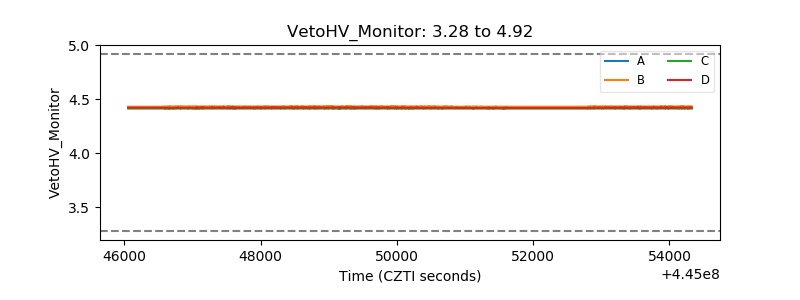 |
| Veto LLD | 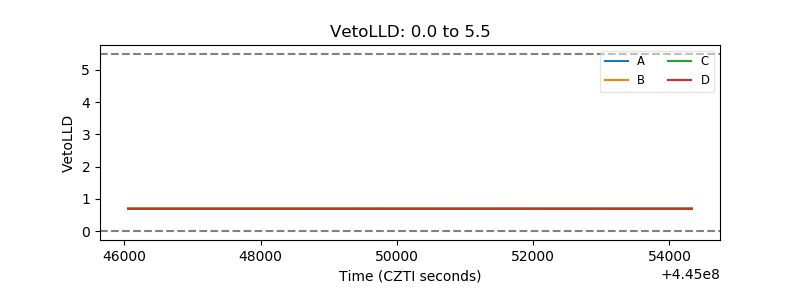 |
| Alpha Counter | 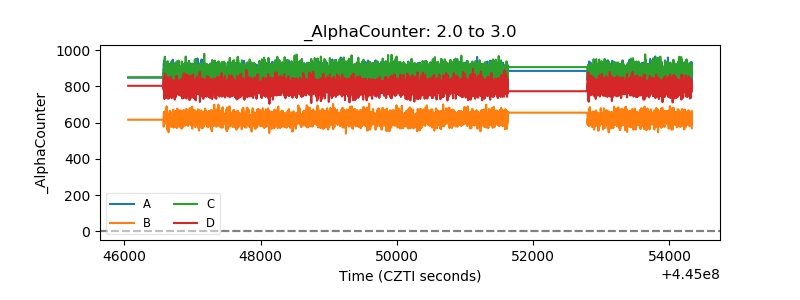 |
| _CPM_Rate | 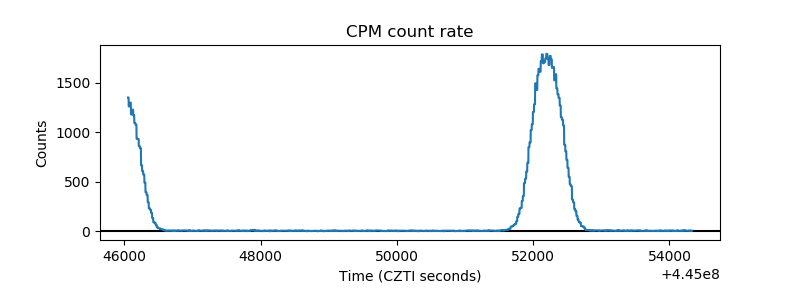 |
| CZT Counter | 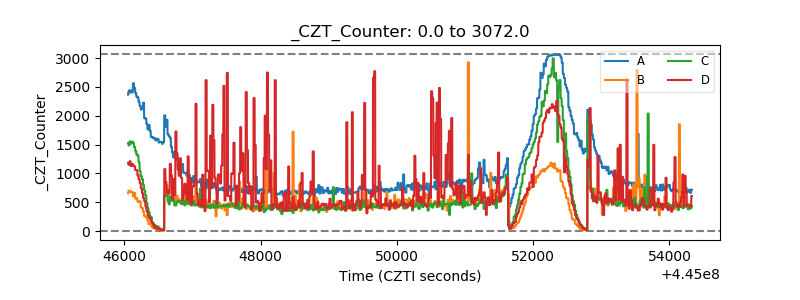 |
| +2.5 Volts monitor | 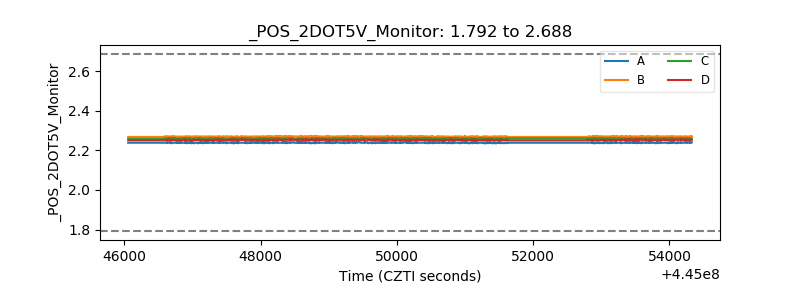 |
| +5 Volts monitor | 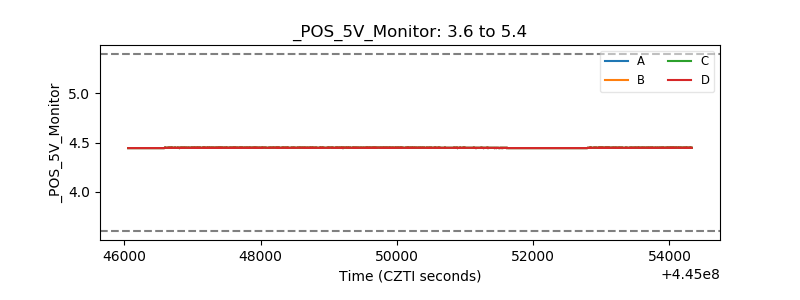 |
| _ROLL_ROT | 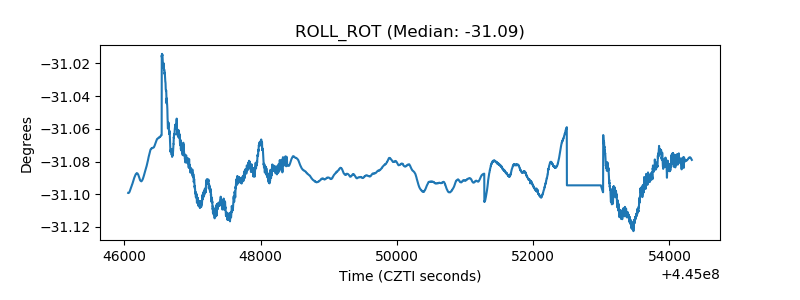 |
| _Roll_DEC | 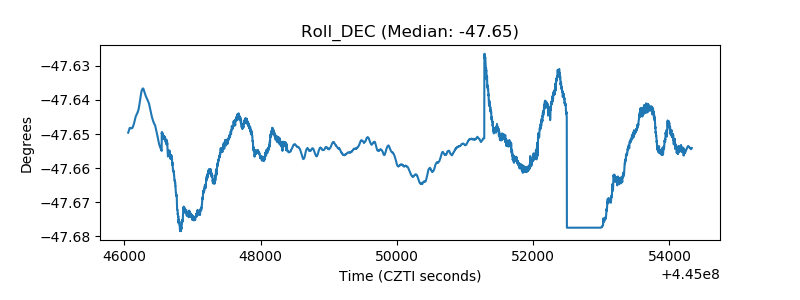 |
| _Roll_RA | 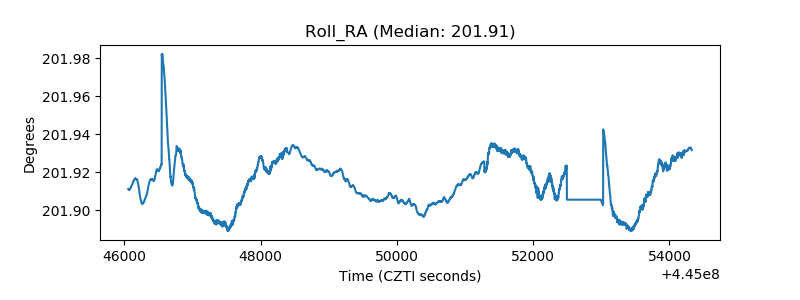 |
| Veto Counter | 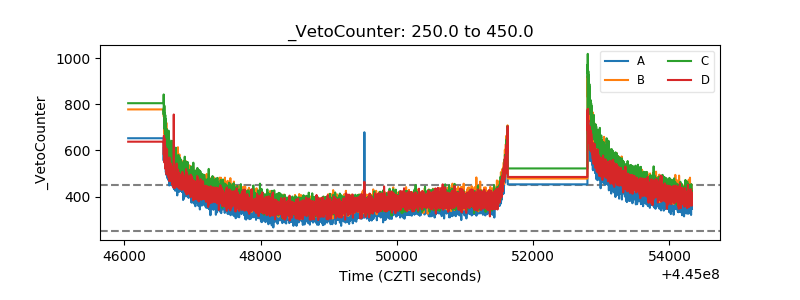 |