| Param | Original file | Final file |
|---|---|---|
| Filename | modeM0/AS1A13_049T07_9000006056_45227cztM0_level2.fits | modeM0/AS1A13_049T07_9000006056_45227cztM0_level2_quad_clean.evt |
| Size (bytes) | 471,369,600 | 111,337,920 |
| Size | 449.5 MB | 106.2 MB |
| Events in quadrant A | 5,210,993 | 741,905 |
| Events in quadrant B | 3,700,237 | 772,657 |
| Events in quadrant C | 3,097,387 | 761,784 |
| Events in quadrant D | 4,948,294 | 653,208 |
| Mode M0 | |||
|---|---|---|---|
| Quadrant | BADHDUFLAG | Total packets | Discarded packets |
| A | 0 | 20203 | 1 |
| B | 0 | 15003 | 1 |
| C | 0 | 13336 | 1 |
| D | 0 | 19074 | 1 |
| Mode M9 | |||
|---|---|---|---|
| Quadrant | BADHDUFLAG | Total packets | Discarded packets |
| A | 0 | 12 | 0 |
| B | 0 | 12 | 0 |
| C | 0 | 12 | 0 |
| D | 0 | 12 | 0 |
| Mode SS | |||
|---|---|---|---|
| Quadrant | BADHDUFLAG | Total packets | Discarded packets |
| A | 0 | 128 | 0 |
| B | 0 | 128 | 0 |
| C | 0 | 128 | 0 |
| D | 0 | 128 | 0 |
| Quadrant | Total seconds | Saturated seconds | Saturation percentage |
|---|---|---|---|
| A | 6335 | 103 | 1.625888% |
| B | 6335 | 189 | 2.983425% |
| C | 6336 | 38 | 0.599747% |
| D | 6336 | 396 | 6.250000% |
Noise dominated data is calculated using 1-second bins in cleaned event files. If a bin has >2000 counts, and if more than 50% of those come from <1% of pixels, then it is considered to be noise-dominated and hence unusable.
| Quadrant | # 1 sec bins | Bins with >0 counts | Bins with >2000 counts | High rate bins dominated by noise | Noise dominated (total time) | Noise dominated (detector-on time) | Marked lightcurve |
|---|---|---|---|---|---|---|---|
| A | 7560 | 6336 | 11 | 11 | 0.15% | 0.17% | 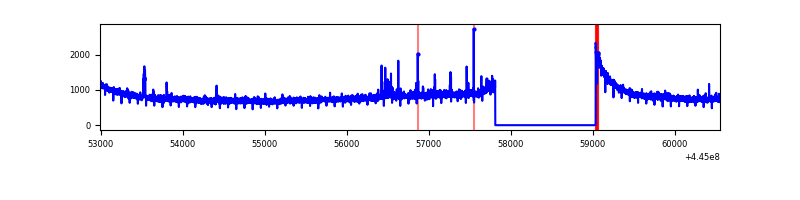 |
| B | 7560 | 6335 | 134 | 134 | 1.77% | 2.12% | 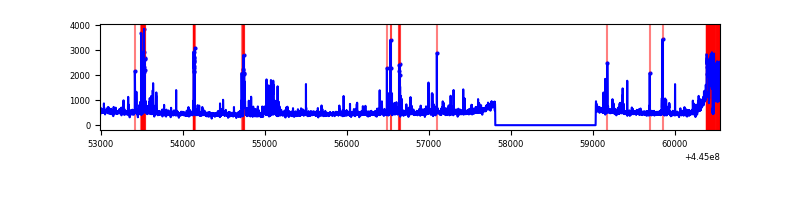 |
| C | 7561 | 6337 | 16 | 16 | 0.21% | 0.25% | 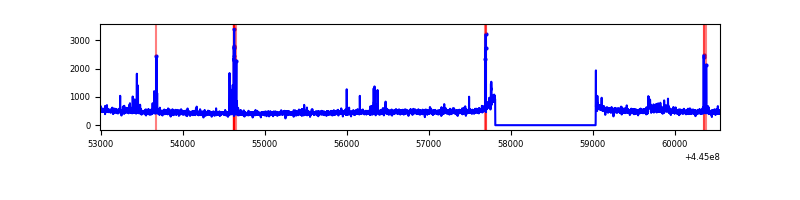 |
| D | 7561 | 6337 | 370 | 370 | 4.89% | 5.84% | 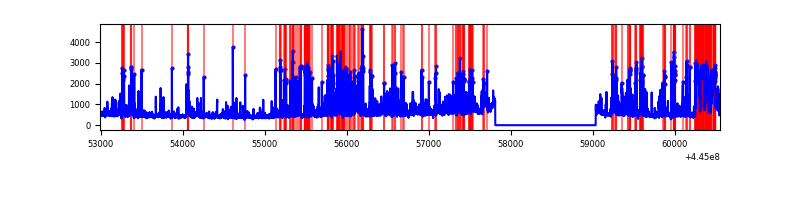 |
Top three noisy pixels from each quadrant. If the there are fewer than three noisy pixels in the level2.evt file, extra rows are filled as -1
| Pixel properties | Quadrant properties | ||||||
|---|---|---|---|---|---|---|---|
| Quadrant | DetID | PixID | Counts | Sigma | Mean | Median | Sigma |
| A | 10 | 83 | 2302842 | 15156.07 | 735 | 721 | 151.9 |
| A | 2 | 79 | 40592 | 262.49 | 735 | 721 | 151.9 |
| A | 13 | 248 | 25827 | 165.29 | 735 | 721 | 151.9 |
| B | 5 | 32 | 518953 | 3649.78 | 738 | 715 | 142.0 |
| B | 3 | 112 | 99290 | 694.23 | 738 | 715 | 142.0 |
| B | 5 | 172 | 59127 | 411.38 | 738 | 715 | 142.0 |
| C | 12 | 2 | 71916 | 406.74 | 747 | 752 | 175.0 |
| C | 14 | 254 | 39035 | 218.81 | 747 | 752 | 175.0 |
| C | 2 | 14 | 34799 | 194.59 | 747 | 752 | 175.0 |
| D | 13 | 249 | 903240 | 5046.81 | 716 | 695 | 178.8 |
| D | 1 | 52 | 313020 | 1746.44 | 716 | 695 | 178.8 |
| D | 5 | 222 | 256098 | 1428.15 | 716 | 695 | 178.8 |
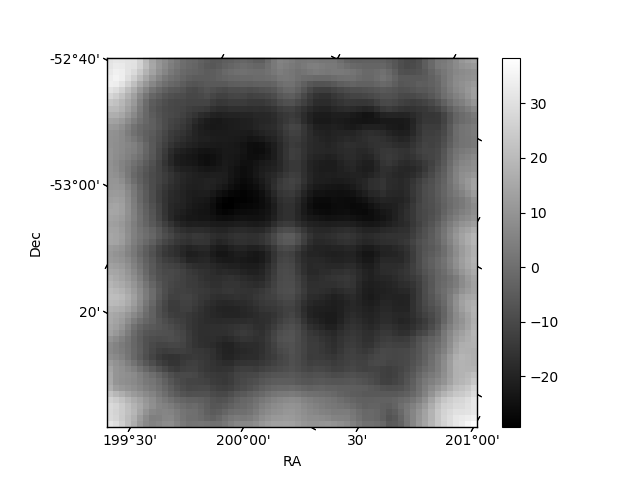
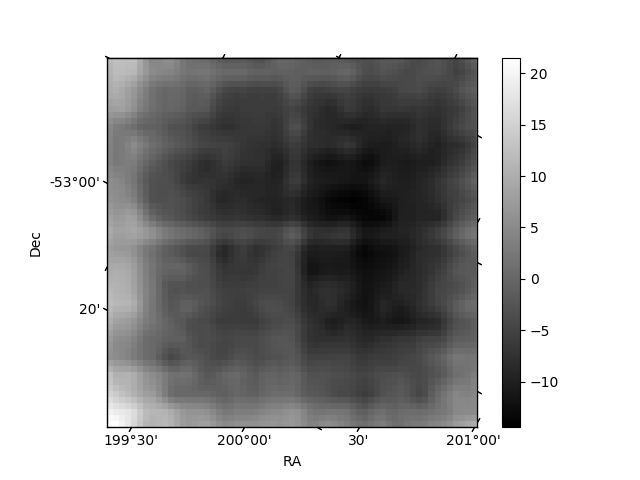
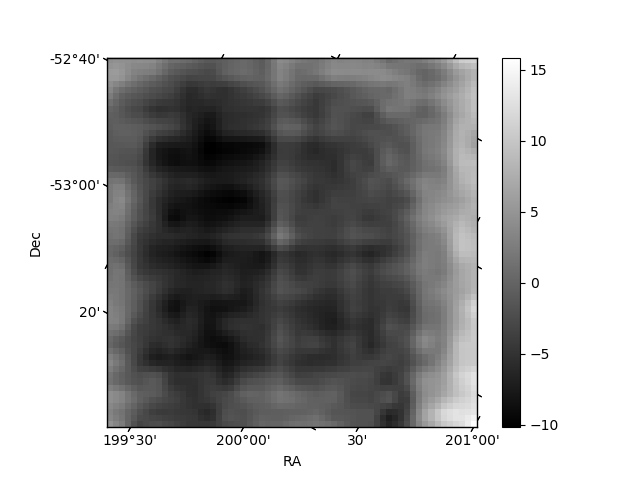
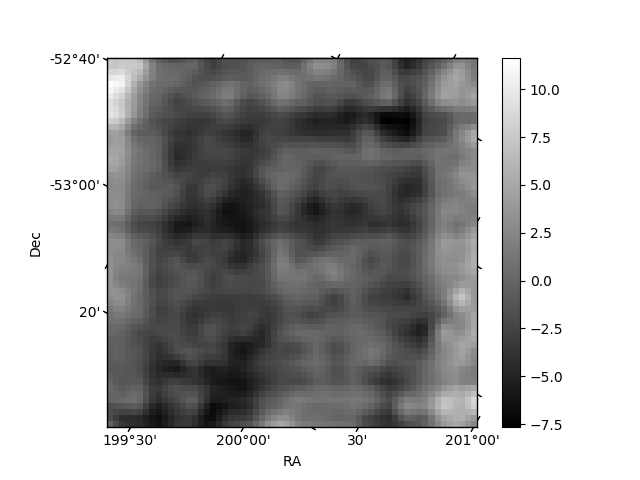
Histogram calculated using DETX and DETY for each event in the final _common_clean file
| Quadrant A | 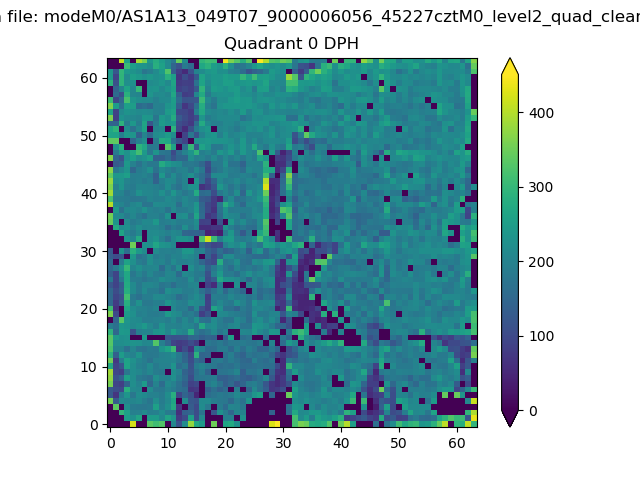 |
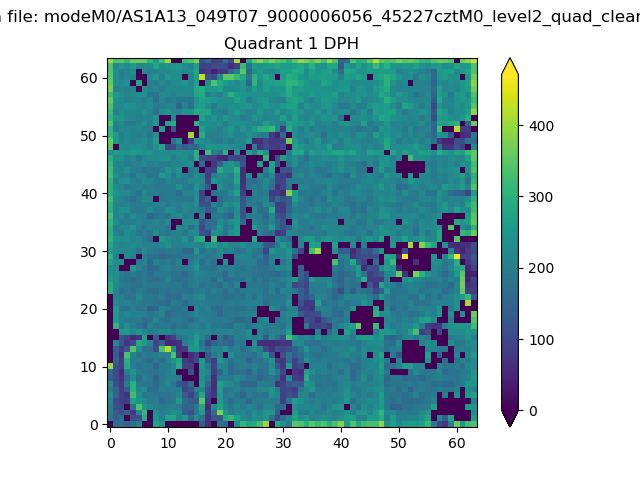 |
Quadrant B |
|---|---|---|---|
| Quadrant D | 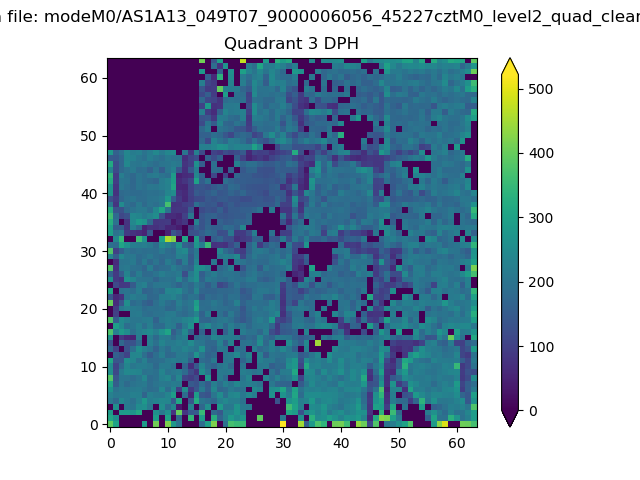 |
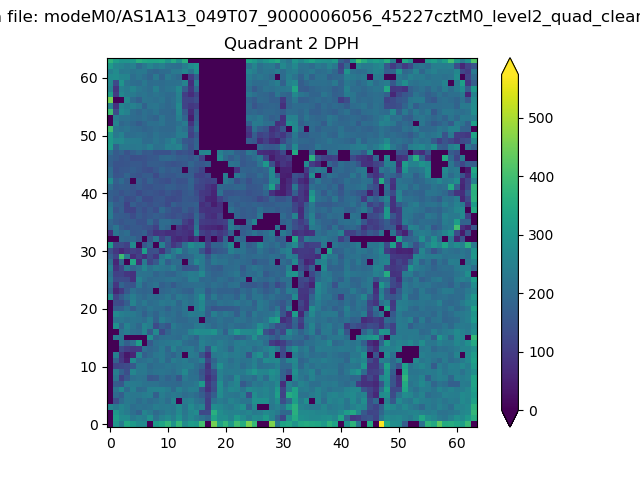 |
Quadrant C |
| Plot type | Count rate plots | Images |
|---|---|---|
| Comparison with Poisson distribution Blue bars denote a histogram of data divided into 1 sec bins. Red curve is a Poisson curve with rate = median count rate of data. |
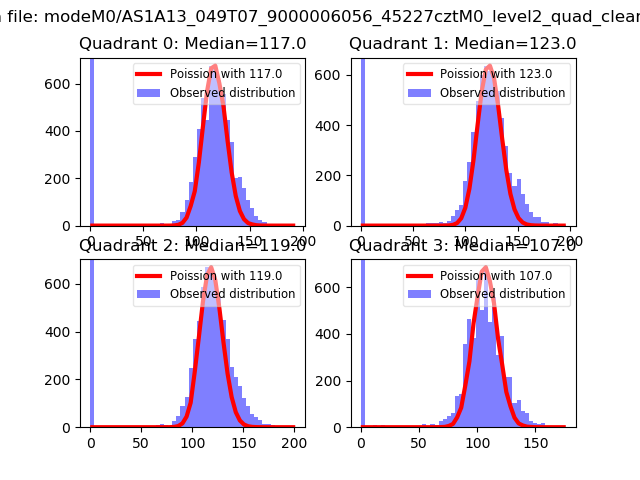 |
 |
| Quadrant-wise count rates Data is divided into 100 sec bins |
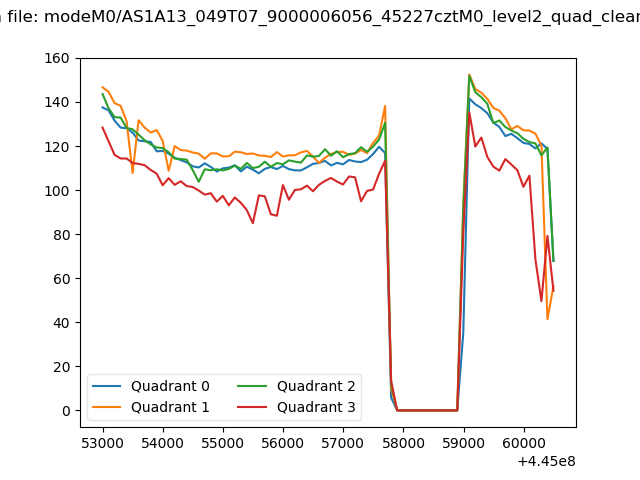 |
|
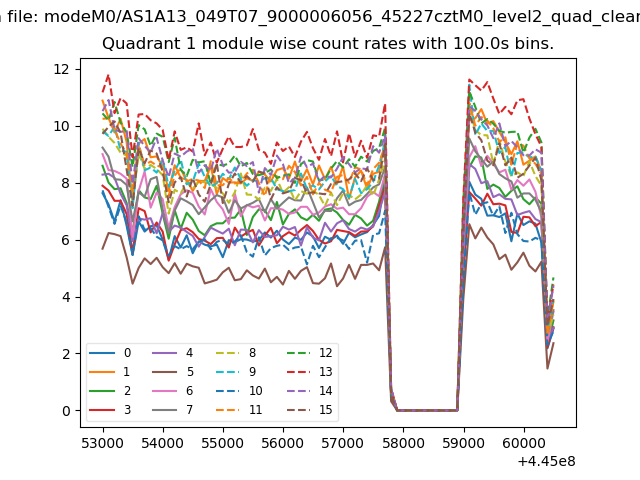
| Module-wise count rates for Quadrant A Data is divided into 100 sec bins |
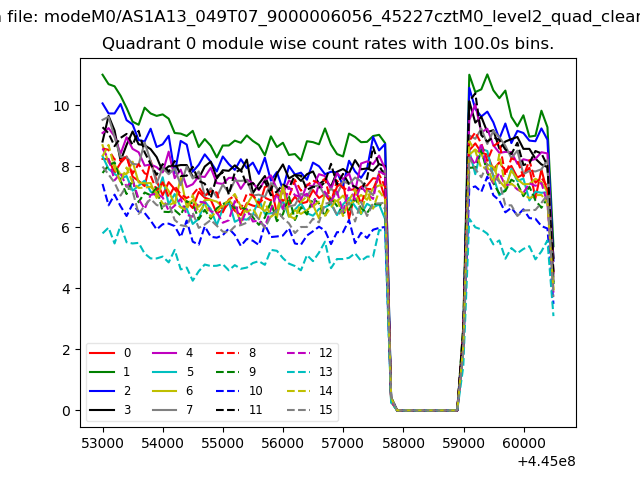 |
 |
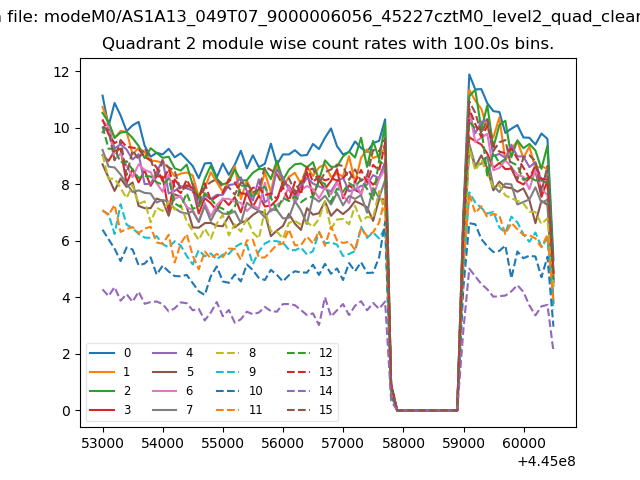
| Module-wise count rates for Quadrant B Data is divided into 100 sec bins |
 |
 |
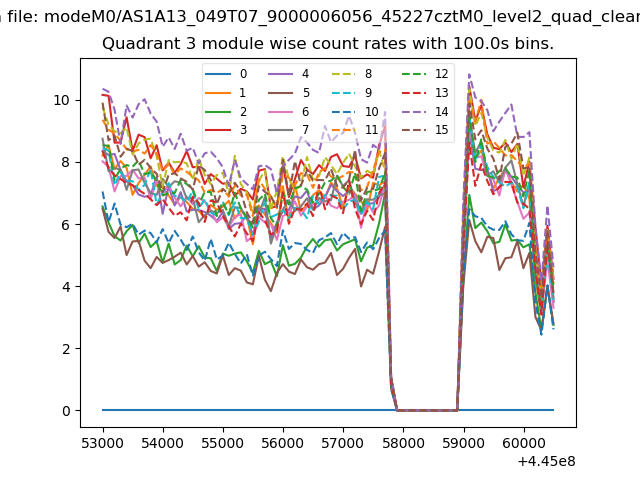
| Module-wise count rates for Quadrant C Data is divided into 100 sec bins |
 |
 |
| Module-wise count rates for Quadrant D Data is divided into 100 sec bins |
 |
 |
| Parameter | Plot |
|---|---|
| CZT HV Monitor | 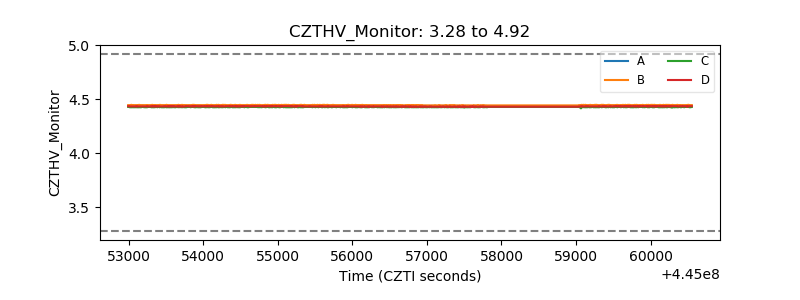 |
| D_VDD | 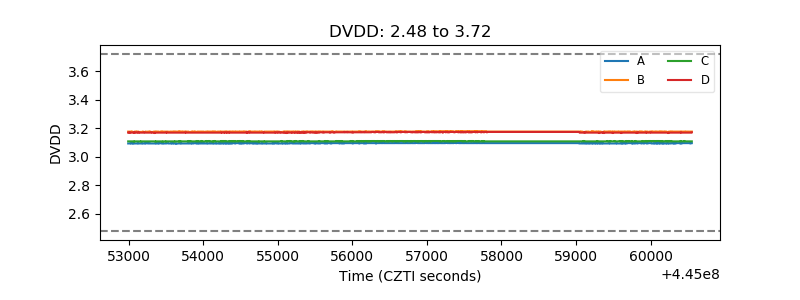 |
| Temperature 1 |  |
| Veto HV Monitor | 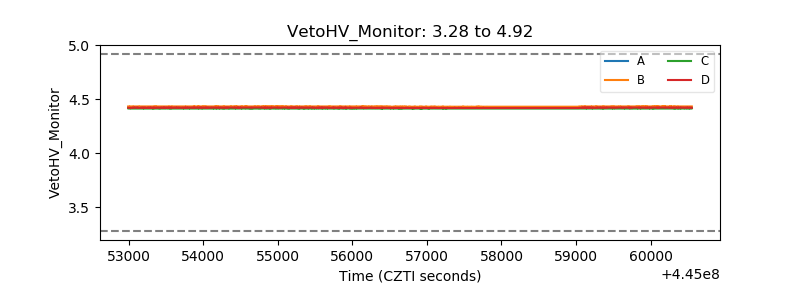 |
| Veto LLD | 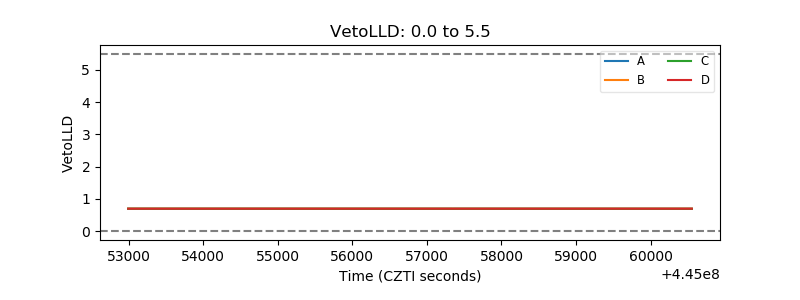 |
| Alpha Counter | 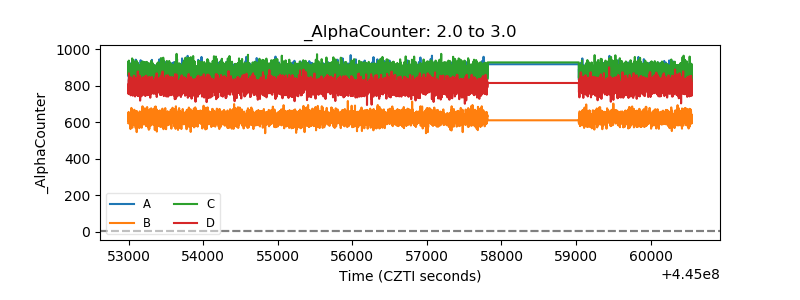 |
| _CPM_Rate | 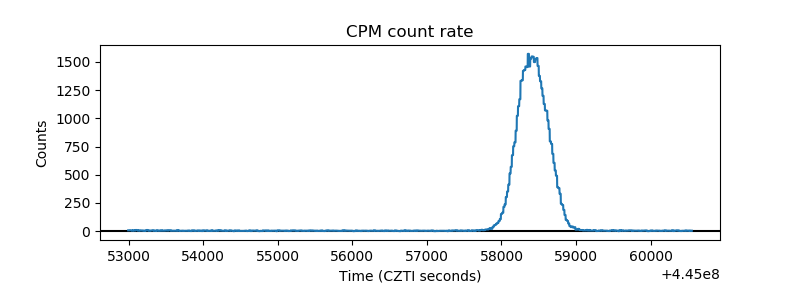 |
| CZT Counter | 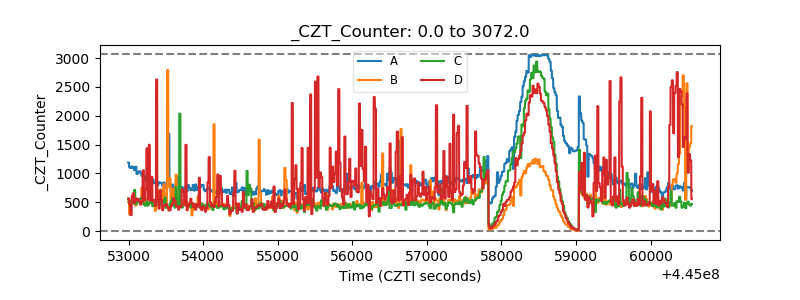 |
| +2.5 Volts monitor | 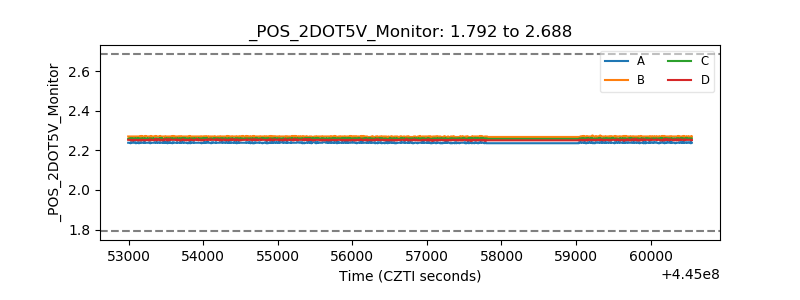 |
| +5 Volts monitor | 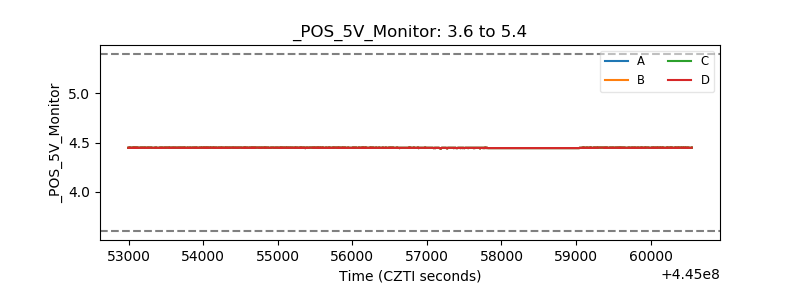 |
| _ROLL_ROT | 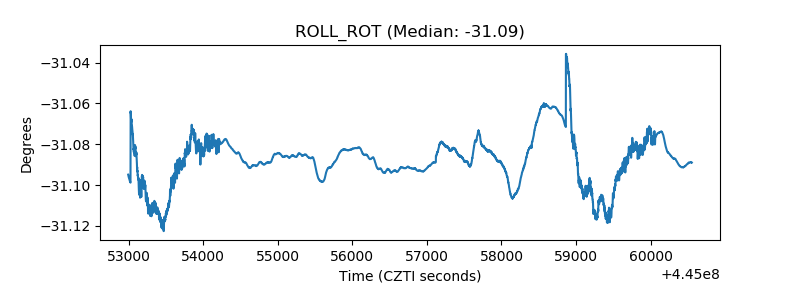 |
| _Roll_DEC | 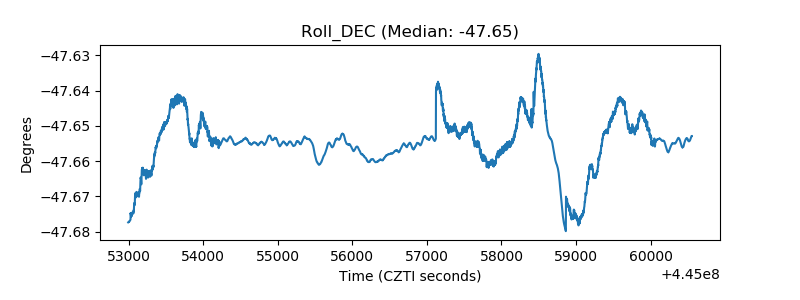 |
| _Roll_RA | 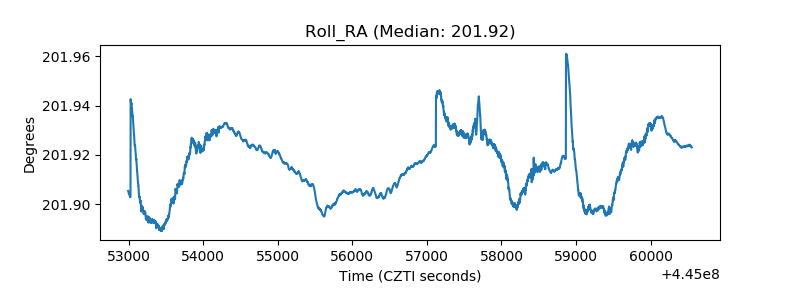 |
| Veto Counter | 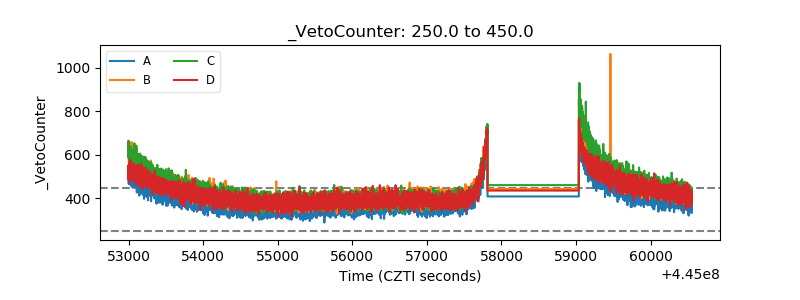 |