| Param | Original file | Final file |
|---|---|---|
| Filename | modeM0/AS1A13_049T07_9000006056_45230cztM0_level2.fits | modeM0/AS1A13_049T07_9000006056_45230cztM0_level2_quad_clean.evt |
| Size (bytes) | 549,826,560 | 109,615,680 |
| Size | 524.4 MB | 104.5 MB |
| Events in quadrant A | 5,845,038 | 729,835 |
| Events in quadrant B | 3,435,684 | 779,882 |
| Events in quadrant C | 3,120,448 | 754,935 |
| Events in quadrant D | 7,422,659 | 579,384 |
| Mode M0 | |||
|---|---|---|---|
| Quadrant | BADHDUFLAG | Total packets | Discarded packets |
| A | 0 | 22068 | 5 |
| B | 0 | 14697 | 2 |
| C | 0 | 14104 | 2 |
| D | 0 | 26687 | 2 |
| Mode M9 | |||
|---|---|---|---|
| Quadrant | BADHDUFLAG | Total packets | Discarded packets |
| A | 0 | 9 | 0 |
| B | 0 | 9 | 0 |
| C | 0 | 10 | 0 |
| D | 0 | 10 | 0 |
| Mode SS | |||
|---|---|---|---|
| Quadrant | BADHDUFLAG | Total packets | Discarded packets |
| A | 0 | 138 | 0 |
| B | 0 | 138 | 0 |
| C | 0 | 138 | 0 |
| D | 0 | 138 | 0 |
| Quadrant | Total seconds | Saturated seconds | Saturation percentage |
|---|---|---|---|
| A | 6816 | 291 | 4.269366% |
| B | 6817 | 116 | 1.701628% |
| C | 6817 | 73 | 1.070852% |
| D | 6817 | 1274 | 18.688573% |
Noise dominated data is calculated using 1-second bins in cleaned event files. If a bin has >2000 counts, and if more than 50% of those come from <1% of pixels, then it is considered to be noise-dominated and hence unusable.
| Quadrant | # 1 sec bins | Bins with >0 counts | Bins with >2000 counts | High rate bins dominated by noise | Noise dominated (total time) | Noise dominated (detector-on time) | Marked lightcurve |
|---|---|---|---|---|---|---|---|
| A | 7652 | 6818 | 55 | 55 | 0.72% | 0.81% | 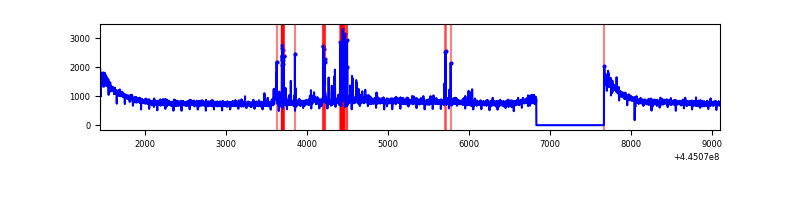 |
| B | 7652 | 6818 | 8 | 8 | 0.10% | 0.12% | 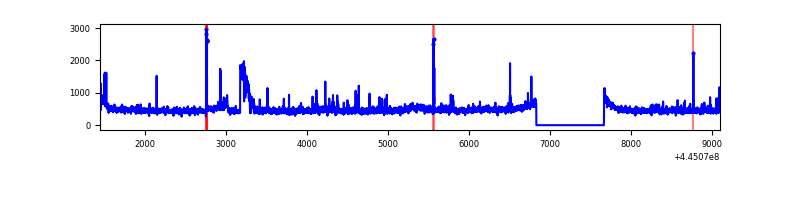 |
| C | 7652 | 6817 | 3 | 3 | 0.04% | 0.04% | 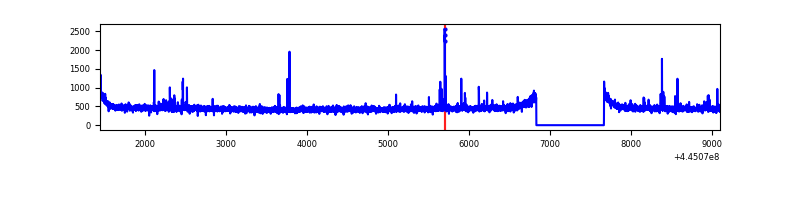 |
| D | 7652 | 6817 | 1097 | 1097 | 14.34% | 16.09% | 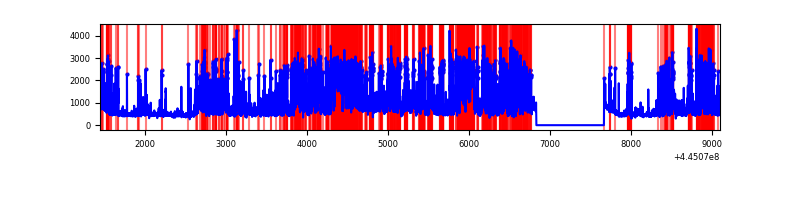 |
Top three noisy pixels from each quadrant. If the there are fewer than three noisy pixels in the level2.evt file, extra rows are filled as -1
| Pixel properties | Quadrant properties | ||||||
|---|---|---|---|---|---|---|---|
| Quadrant | DetID | PixID | Counts | Sigma | Mean | Median | Sigma |
| A | 10 | 83 | 2642103 | 16602.98 | 768 | 750 | 159.1 |
| A | 13 | 248 | 166169 | 1039.79 | 768 | 750 | 159.1 |
| A | 15 | 174 | 43690 | 269.91 | 768 | 750 | 159.1 |
| B | 5 | 32 | 188938 | 1235.26 | 775 | 750 | 152.3 |
| B | 3 | 112 | 86045 | 559.88 | 775 | 750 | 152.3 |
| B | 0 | 183 | 43541 | 280.88 | 775 | 750 | 152.3 |
| C | 14 | 254 | 40047 | 216.04 | 777 | 781 | 181.8 |
| C | 12 | 2 | 23007 | 122.29 | 777 | 781 | 181.8 |
| C | 2 | 14 | 13504 | 70.0 | 777 | 781 | 181.8 |
| D | 13 | 249 | 2669399 | 14643.76 | 717 | 695 | 182.2 |
| D | 5 | 235 | 793157 | 4348.41 | 717 | 695 | 182.2 |
| D | 1 | 52 | 447330 | 2450.78 | 717 | 695 | 182.2 |
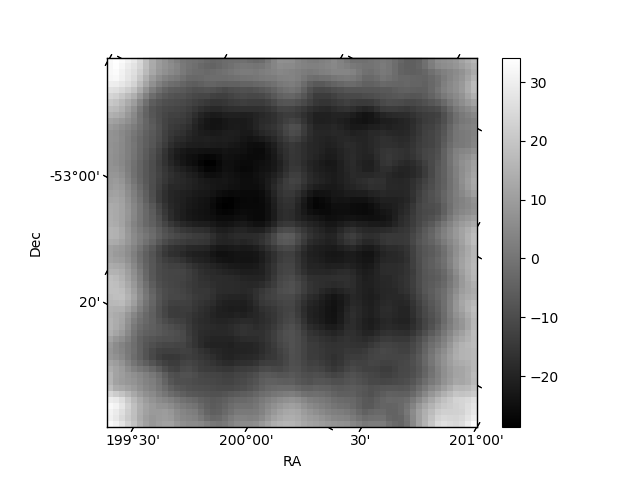
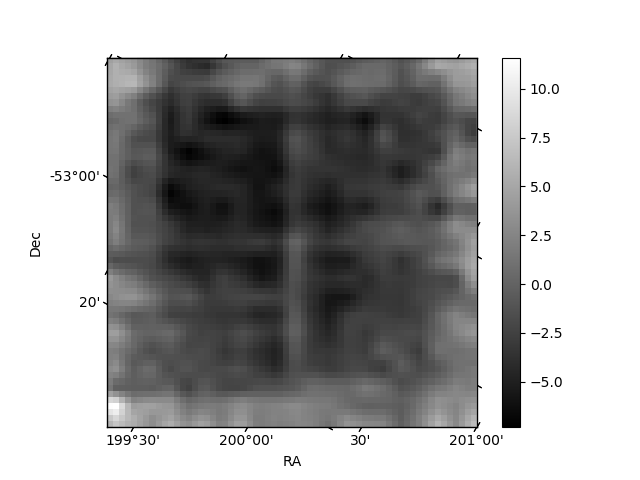
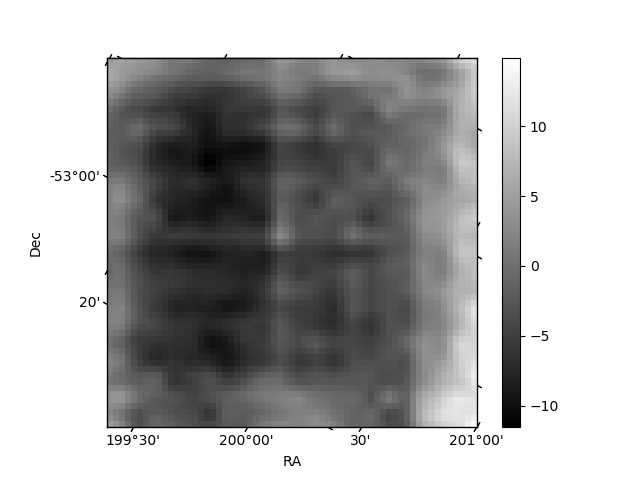
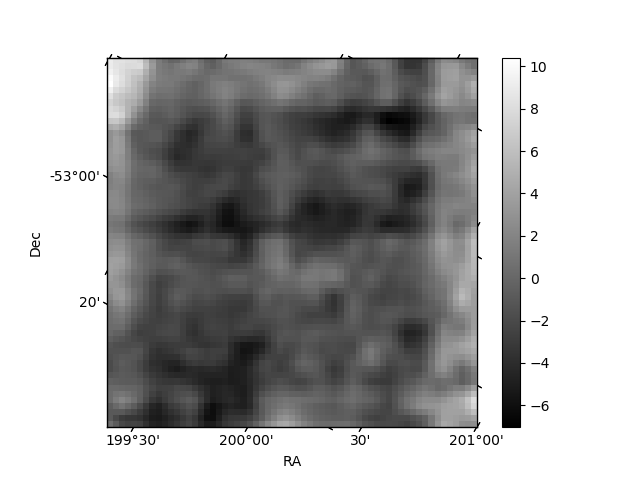
Histogram calculated using DETX and DETY for each event in the final _common_clean file
| Quadrant A | 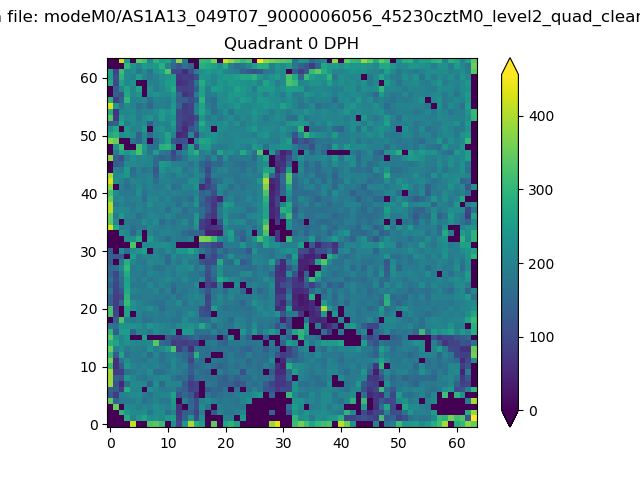 |
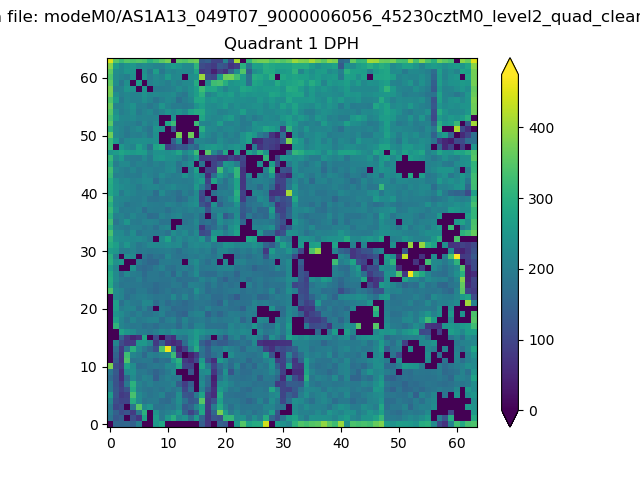 |
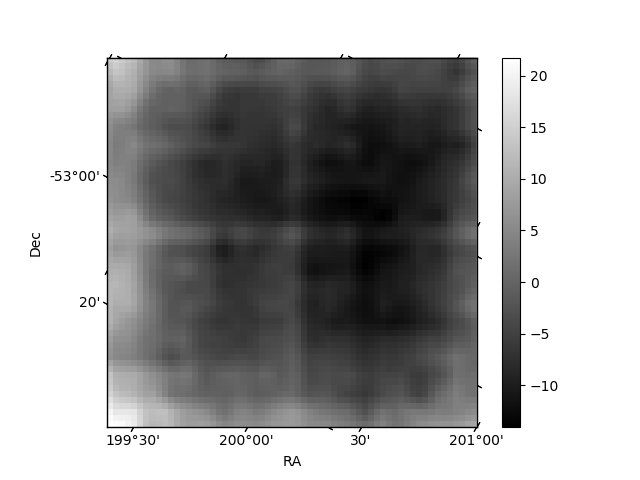
Quadrant B |
|---|---|---|---|
| Quadrant D | 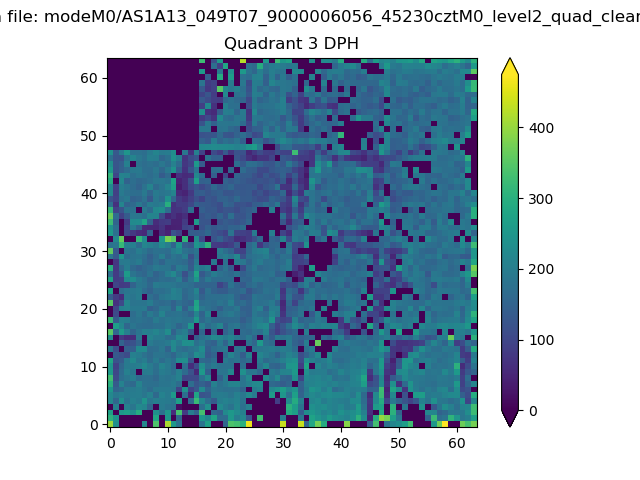 |
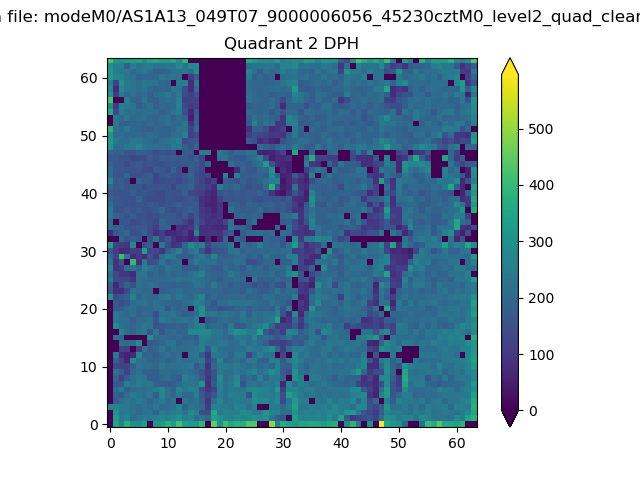 |
Quadrant C |
| Plot type | Count rate plots | Images |
|---|---|---|
| Comparison with Poisson distribution Blue bars denote a histogram of data divided into 1 sec bins. Red curve is a Poisson curve with rate = median count rate of data. |
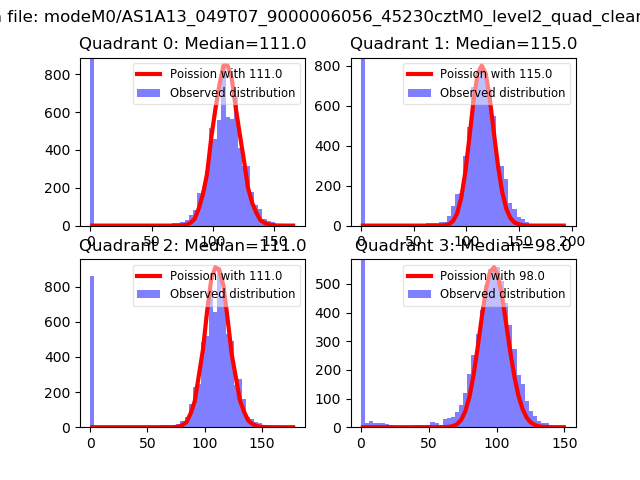 |
 |
| Quadrant-wise count rates Data is divided into 100 sec bins |
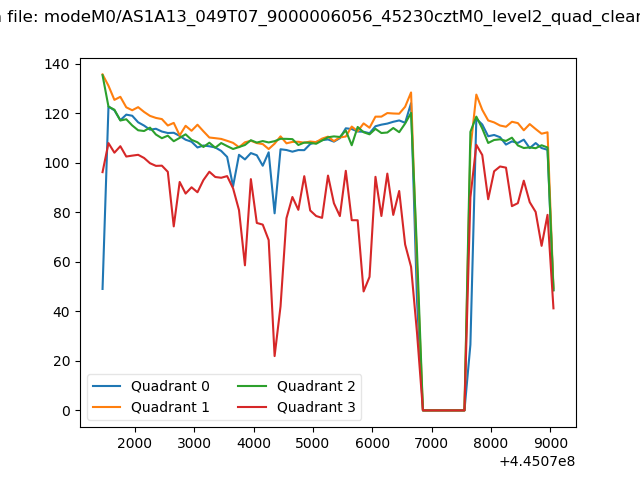 |
|
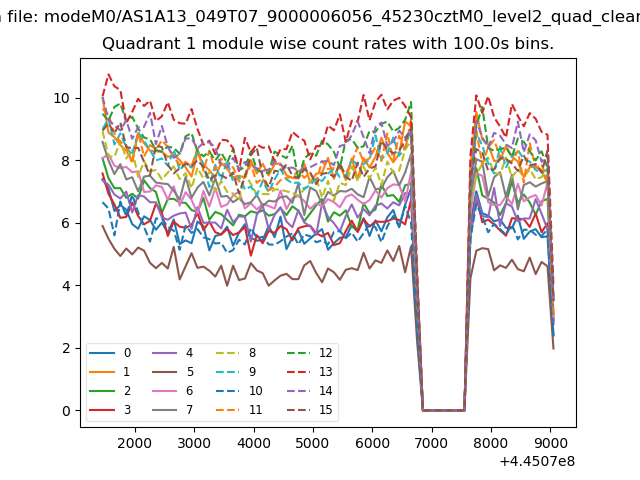
| Module-wise count rates for Quadrant A Data is divided into 100 sec bins |
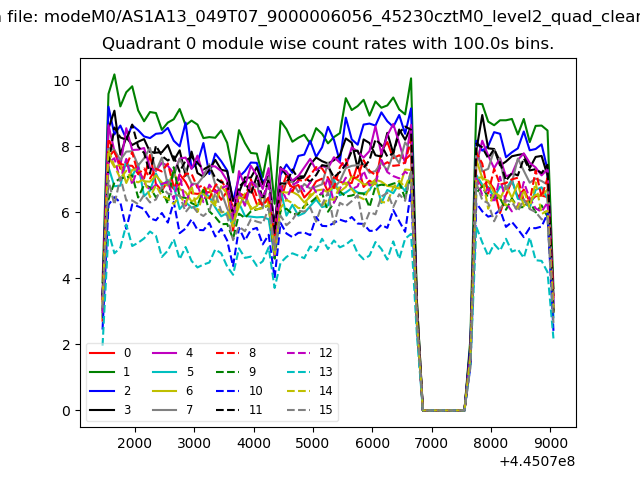 |
 |
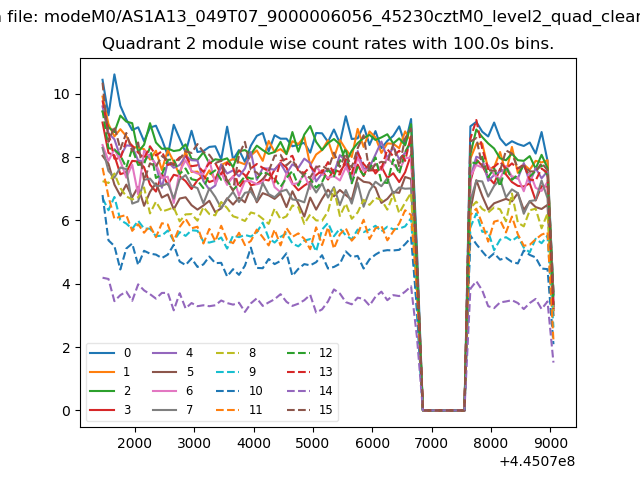
| Module-wise count rates for Quadrant B Data is divided into 100 sec bins |
 |
 |
| Module-wise count rates for Quadrant C Data is divided into 100 sec bins |
 |
 |
| Module-wise count rates for Quadrant D Data is divided into 100 sec bins |
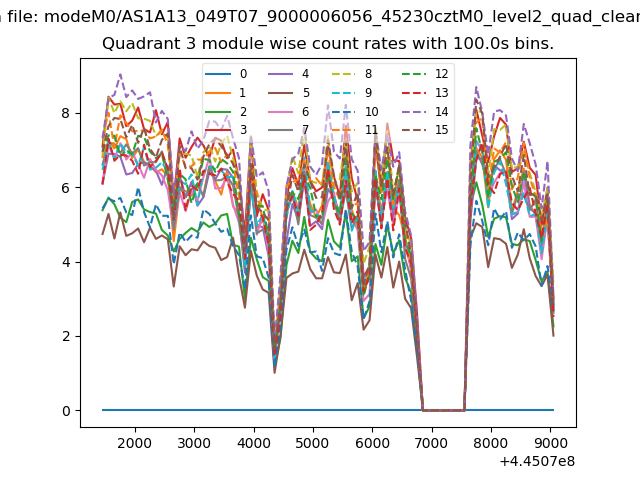 |
 |
| Parameter | Plot |
|---|---|
| CZT HV Monitor | 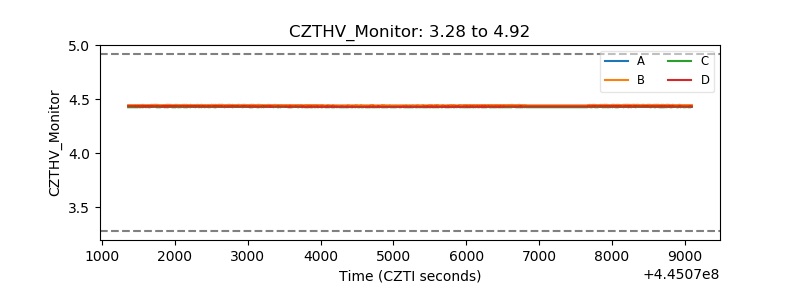 |
| D_VDD | 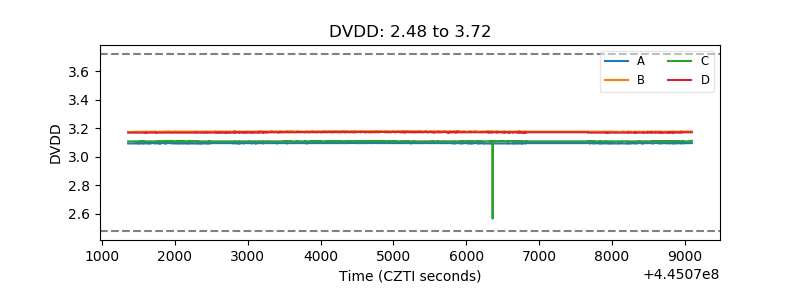 |
| Temperature 1 | 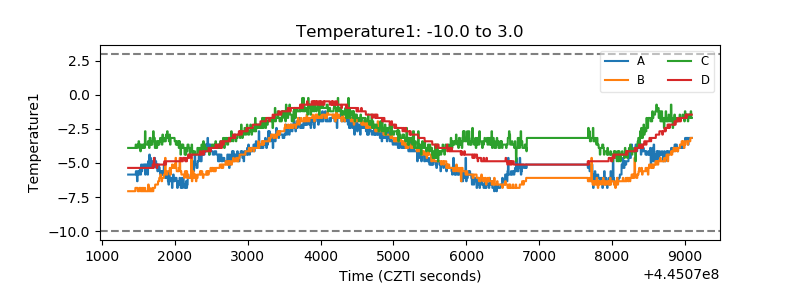 |
| Veto HV Monitor | 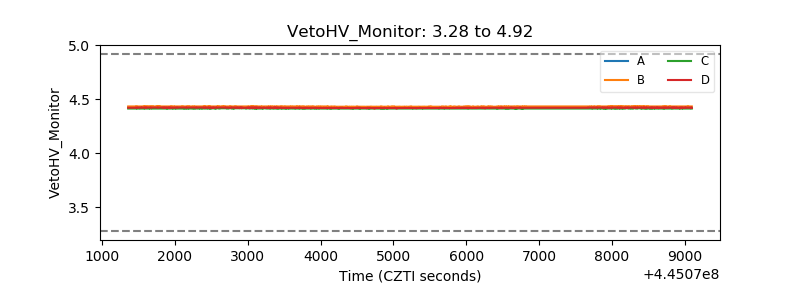 |
| Veto LLD | 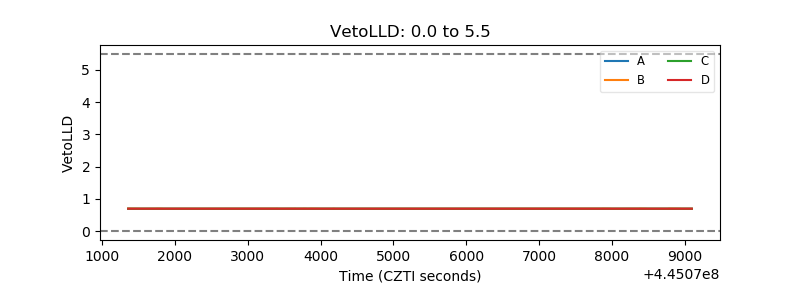 |
| Alpha Counter | 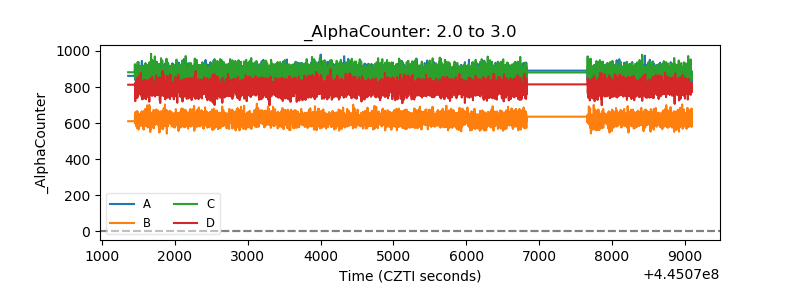 |
| _CPM_Rate | 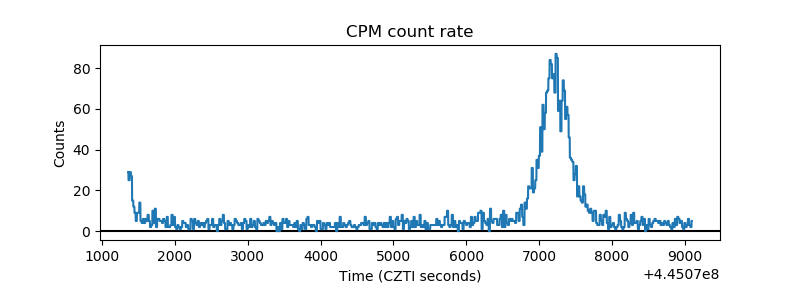 |
| CZT Counter | 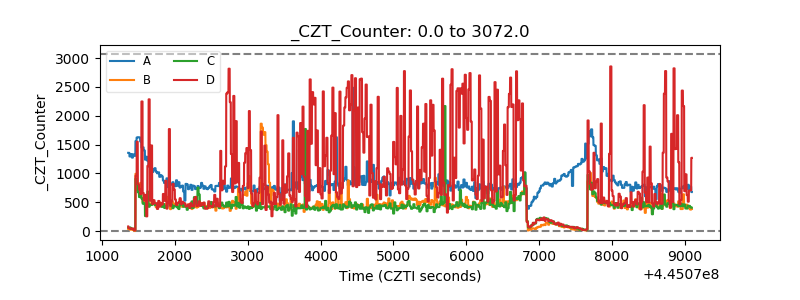 |
| +2.5 Volts monitor | 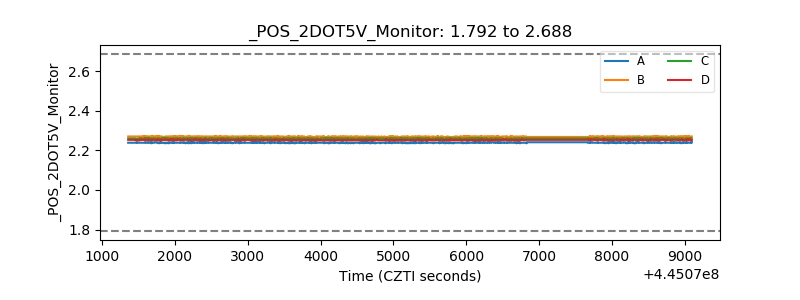 |
| +5 Volts monitor | 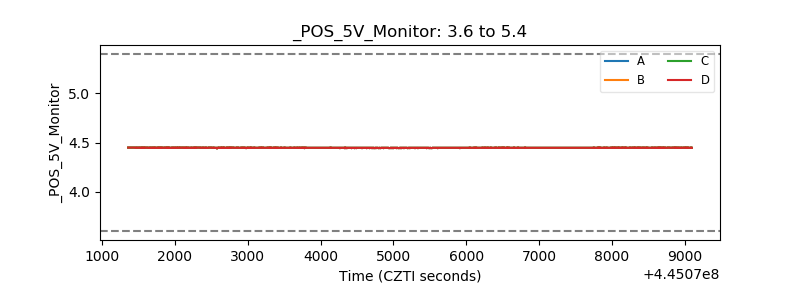 |
| _ROLL_ROT | 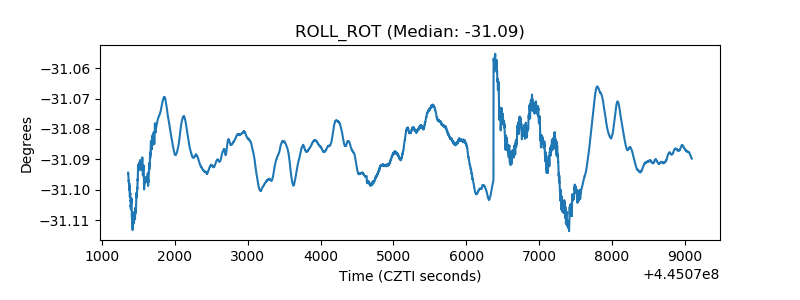 |
| _Roll_DEC | 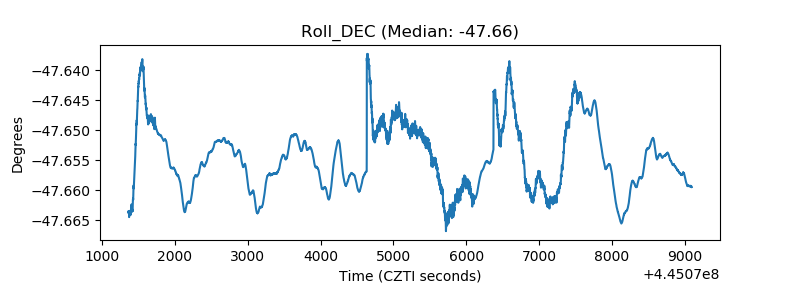 |
| _Roll_RA | 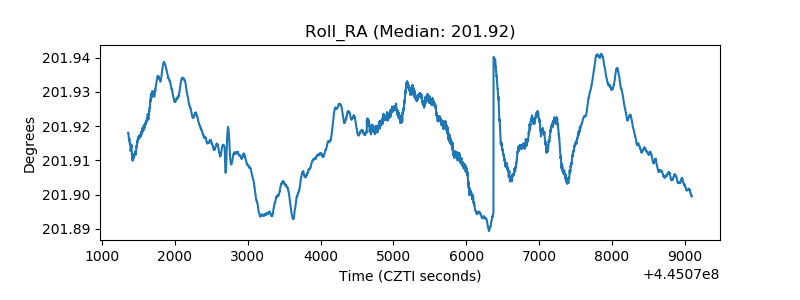 |
| Veto Counter | 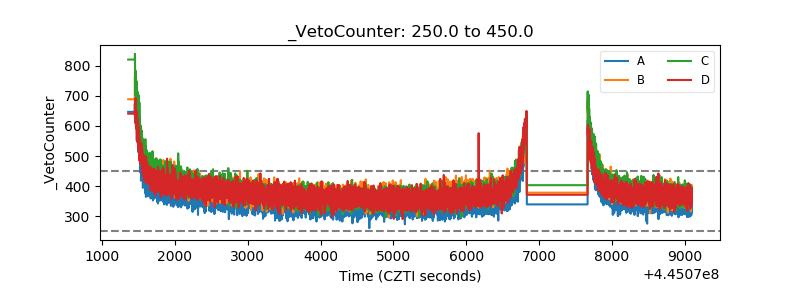 |