| Param | Original file | Final file |
|---|---|---|
| Filename | modeM0/AS1A13_049T07_9000006056_45231cztM0_level2.fits | modeM0/AS1A13_049T07_9000006056_45231cztM0_level2_quad_clean.evt |
| Size (bytes) | 593,447,040 | 110,652,480 |
| Size | 566.0 MB | 105.5 MB |
| Events in quadrant A | 5,950,293 | 730,061 |
| Events in quadrant B | 3,771,617 | 767,992 |
| Events in quadrant C | 4,084,878 | 733,141 |
| Events in quadrant D | 7,593,659 | 611,052 |
| Mode M0 | |||
|---|---|---|---|
| Quadrant | BADHDUFLAG | Total packets | Discarded packets |
| A | 0 | 22949 | 1 |
| B | 0 | 16096 | 1 |
| C | 0 | 17351 | 1 |
| D | 0 | 27622 | 2 |
| Mode M9 | |||
|---|---|---|---|
| Quadrant | BADHDUFLAG | Total packets | Discarded packets |
| A | 0 | 1 | 0 |
| B | 0 | 1 | 0 |
| C | 0 | 1 | 0 |
| D | 0 | 1 | 0 |
| Mode SS | |||
|---|---|---|---|
| Quadrant | BADHDUFLAG | Total packets | Discarded packets |
| A | 0 | 146 | 0 |
| B | 0 | 146 | 0 |
| C | 0 | 146 | 0 |
| D | 0 | 146 | 0 |
| Quadrant | Total seconds | Saturated seconds | Saturation percentage |
|---|---|---|---|
| A | 7305 | 532 | 7.282683% |
| B | 7305 | 477 | 6.529774% |
| C | 7306 | 550 | 7.528059% |
| D | 7305 | 1271 | 17.399042% |
Noise dominated data is calculated using 1-second bins in cleaned event files. If a bin has >2000 counts, and if more than 50% of those come from <1% of pixels, then it is considered to be noise-dominated and hence unusable.
| Quadrant | # 1 sec bins | Bins with >0 counts | Bins with >2000 counts | High rate bins dominated by noise | Noise dominated (total time) | Noise dominated (detector-on time) | Marked lightcurve |
|---|---|---|---|---|---|---|---|
| A | 7350 | 7305 | 51 | 51 | 0.69% | 0.70% | 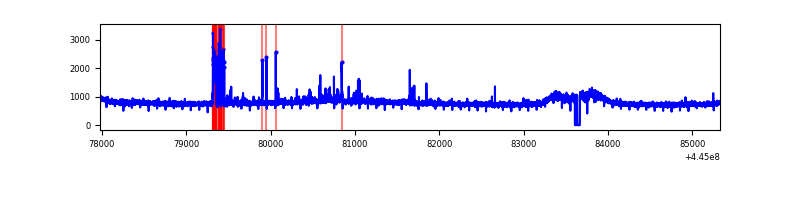 |
| B | 7350 | 7305 | 18 | 18 | 0.24% | 0.25% | 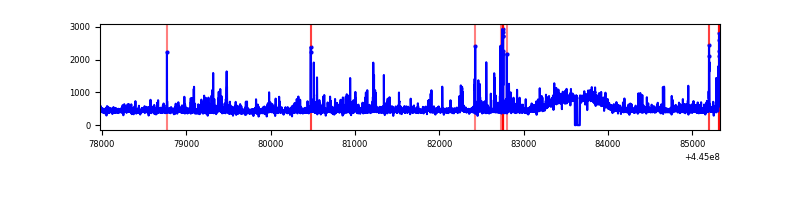 |
| C | 7351 | 7306 | 182 | 182 | 2.48% | 2.49% | 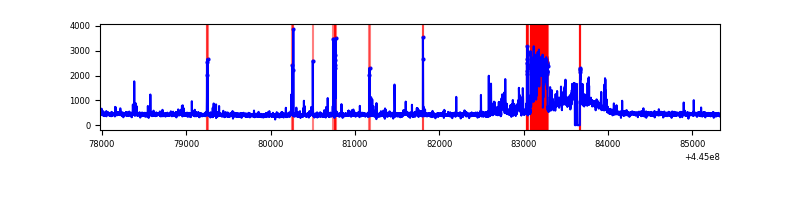 |
| D | 7350 | 7305 | 848 | 848 | 11.54% | 11.61% | 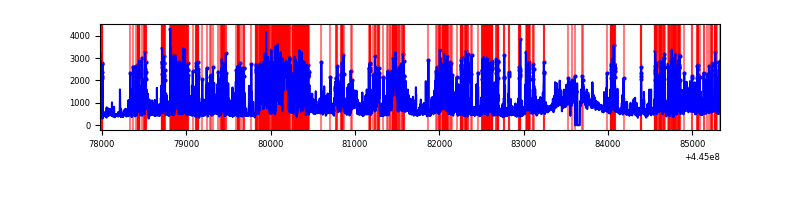 |
Top three noisy pixels from each quadrant. If the there are fewer than three noisy pixels in the level2.evt file, extra rows are filled as -1
| Pixel properties | Quadrant properties | ||||||
|---|---|---|---|---|---|---|---|
| Quadrant | DetID | PixID | Counts | Sigma | Mean | Median | Sigma |
| A | 10 | 83 | 2447809 | 13747.66 | 849 | 827 | 178.0 |
| A | 13 | 248 | 128040 | 714.71 | 849 | 827 | 178.0 |
| A | 15 | 174 | 75911 | 421.84 | 849 | 827 | 178.0 |
| B | 3 | 112 | 245593 | 1428.04 | 851 | 821 | 171.4 |
| B | 5 | 32 | 72064 | 415.64 | 851 | 821 | 171.4 |
| B | 12 | 111 | 21797 | 122.38 | 851 | 821 | 171.4 |
| C | 14 | 254 | 653655 | 3286.73 | 845 | 848 | 198.6 |
| C | 12 | 2 | 54488 | 270.06 | 845 | 848 | 198.6 |
| C | 0 | 207 | 27417 | 133.77 | 845 | 848 | 198.6 |
| D | 13 | 249 | 2242325 | 10771.47 | 811 | 783 | 208.1 |
| D | 12 | 17 | 617440 | 2963.27 | 811 | 783 | 208.1 |
| D | 1 | 52 | 459350 | 2203.59 | 811 | 783 | 208.1 |
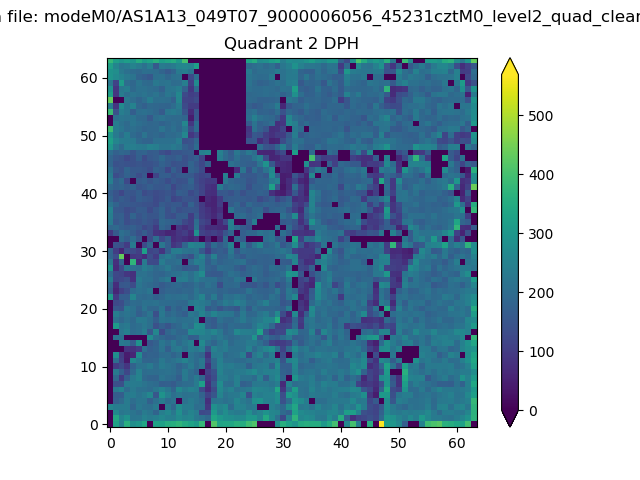
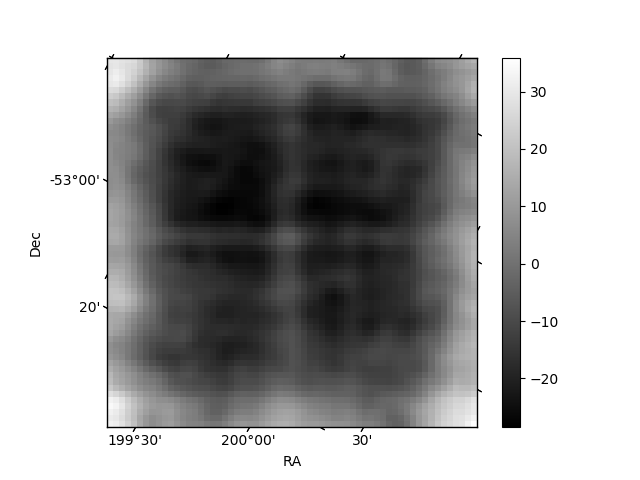
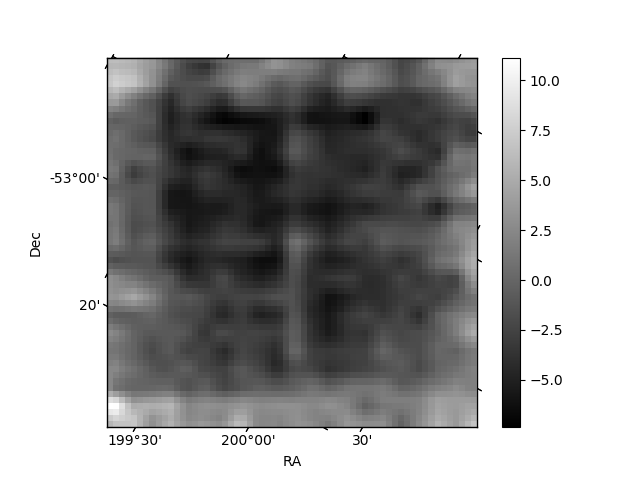
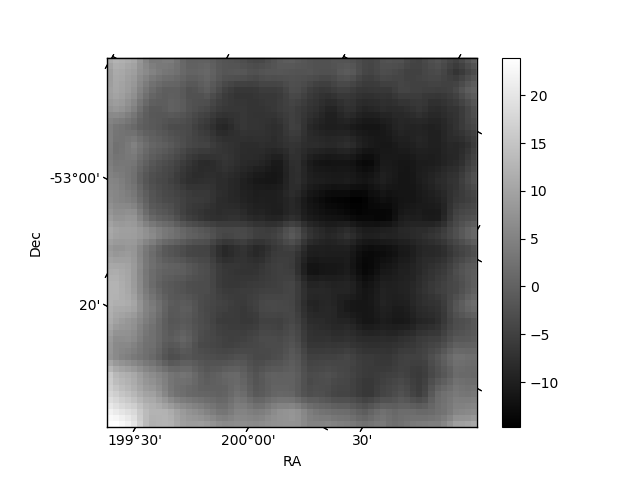
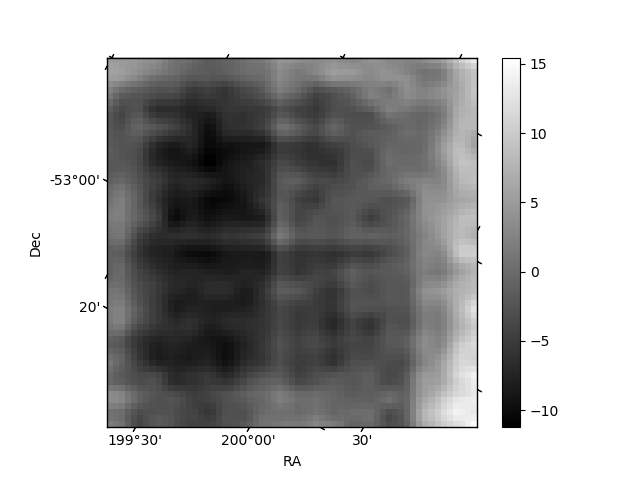
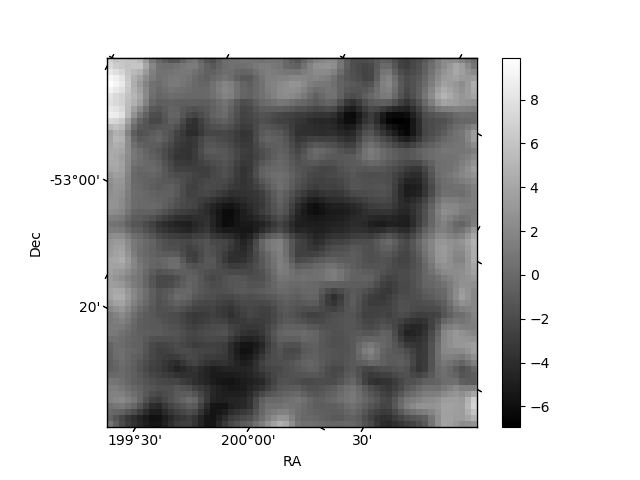
Histogram calculated using DETX and DETY for each event in the final _common_clean file
| Quadrant A | 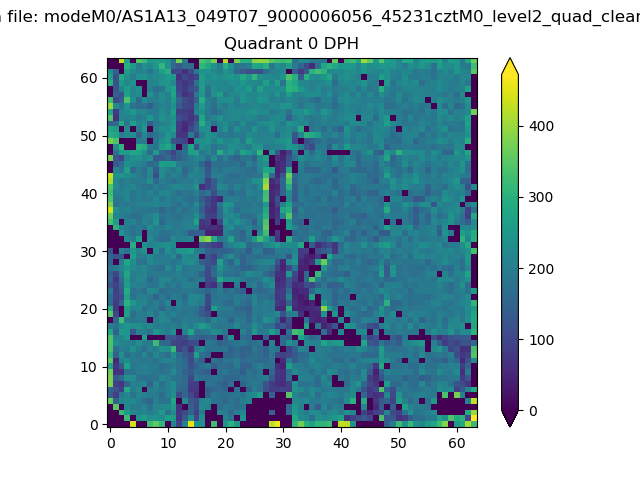 |
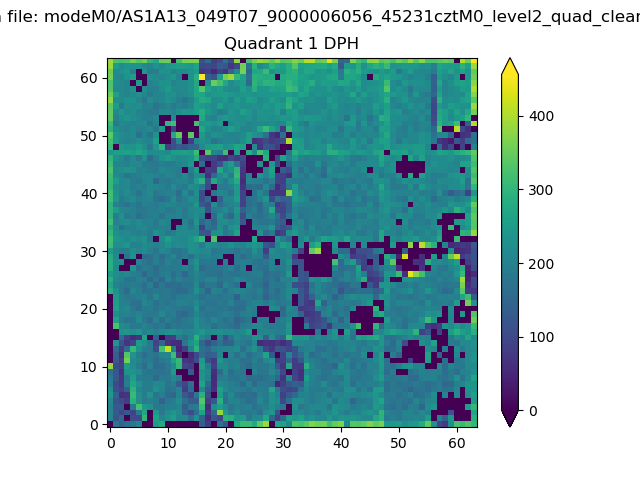 |
Quadrant B |
|---|---|---|---|
| Quadrant D | 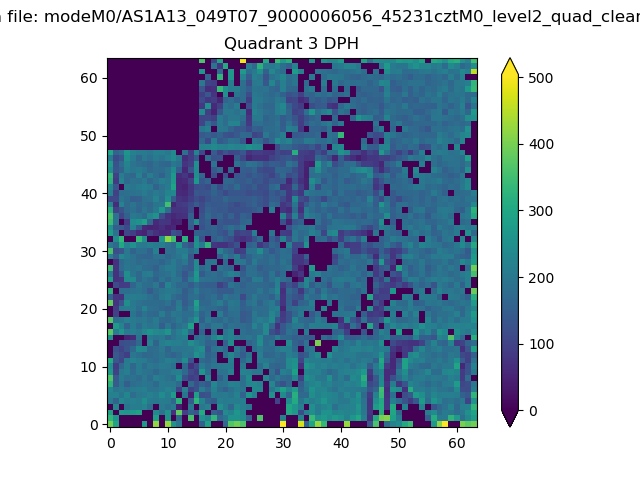 |
 |
Quadrant C |
| Plot type | Count rate plots | Images |
|---|---|---|
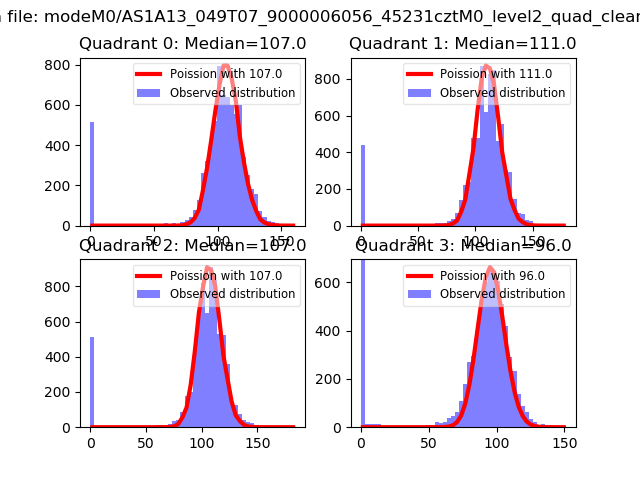
| Comparison with Poisson distribution Blue bars denote a histogram of data divided into 1 sec bins. Red curve is a Poisson curve with rate = median count rate of data. |
 |
 |
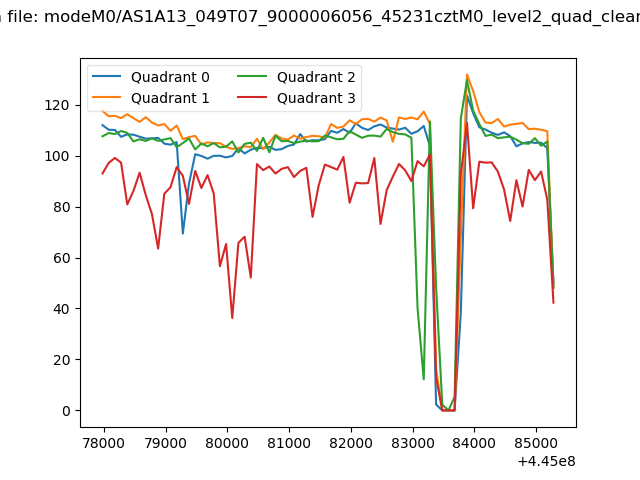
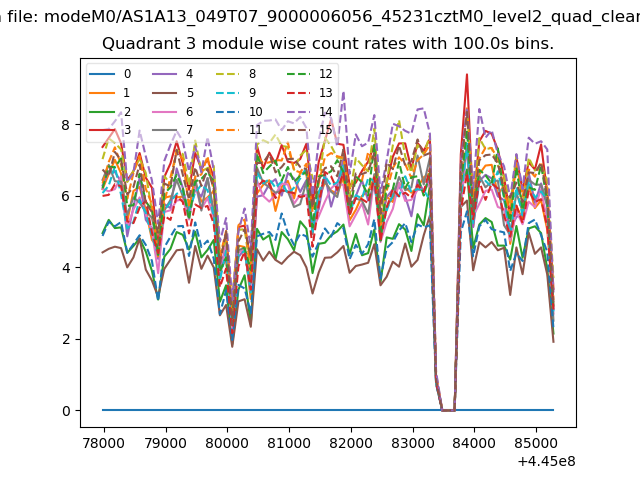
| Quadrant-wise count rates Data is divided into 100 sec bins |
 |
|
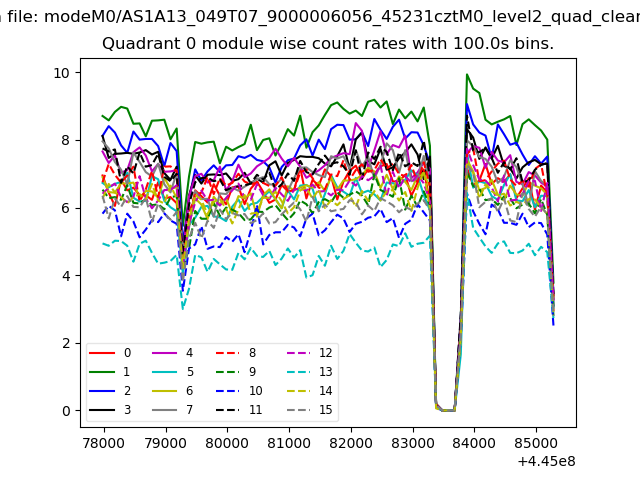
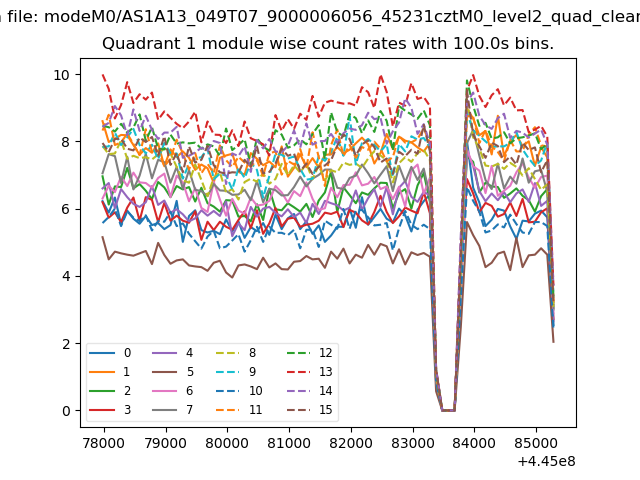
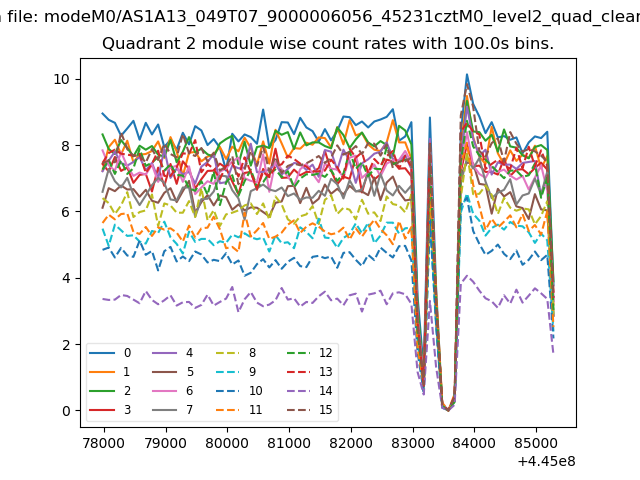
| Module-wise count rates for Quadrant A Data is divided into 100 sec bins |
 |
 |
| Module-wise count rates for Quadrant B Data is divided into 100 sec bins |
 |
 |
| Module-wise count rates for Quadrant C Data is divided into 100 sec bins |
 |
 |
| Module-wise count rates for Quadrant D Data is divided into 100 sec bins |
 |
 |
| Parameter | Plot |
|---|---|
| CZT HV Monitor | 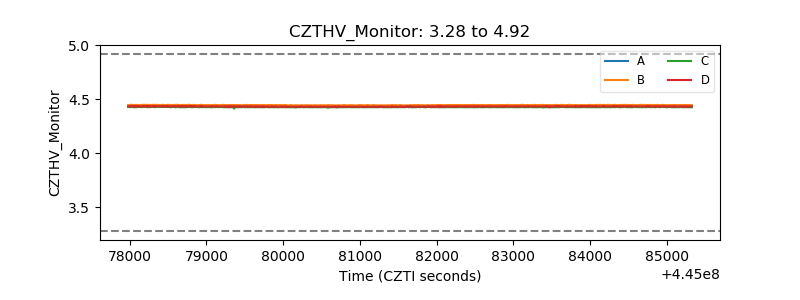 |
| D_VDD | 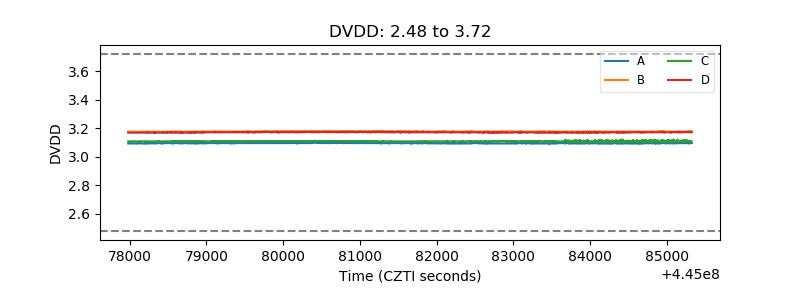 |
| Temperature 1 | 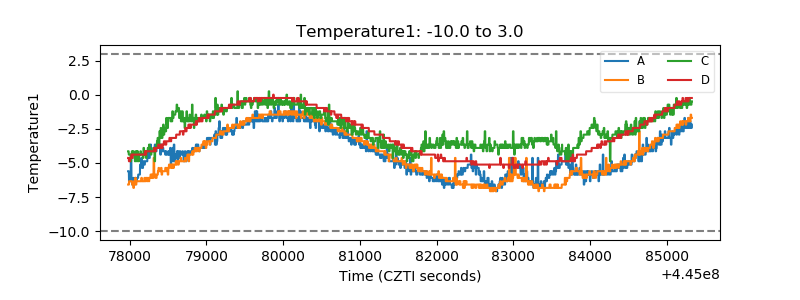 |
| Veto HV Monitor | 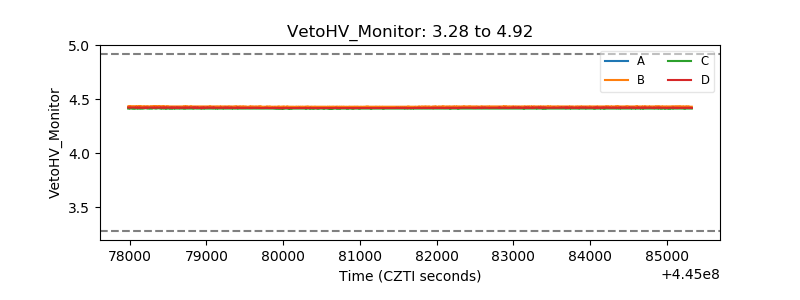 |
| Veto LLD | 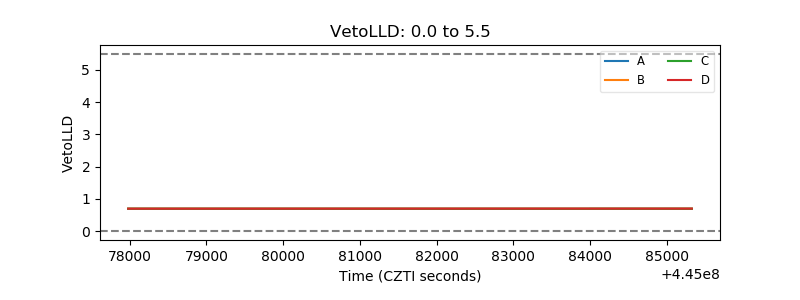 |
| Alpha Counter | 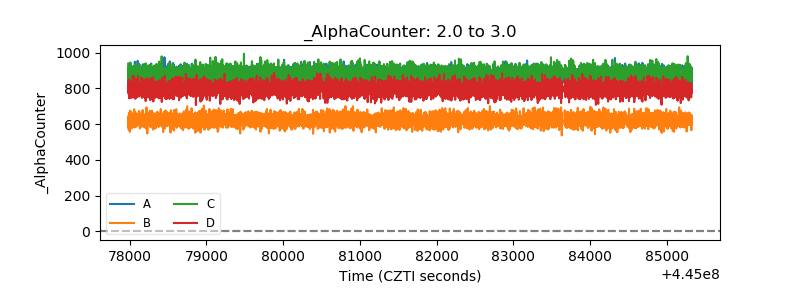 |
| _CPM_Rate | 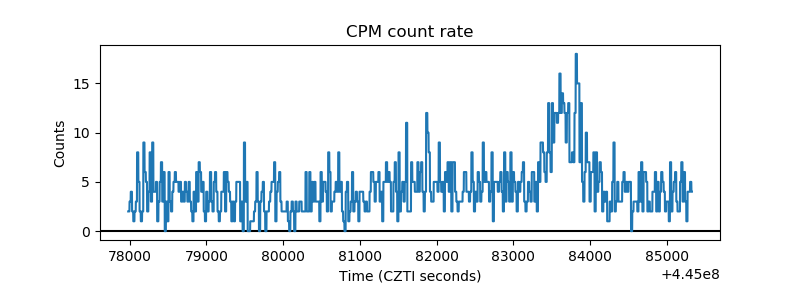 |
| CZT Counter | 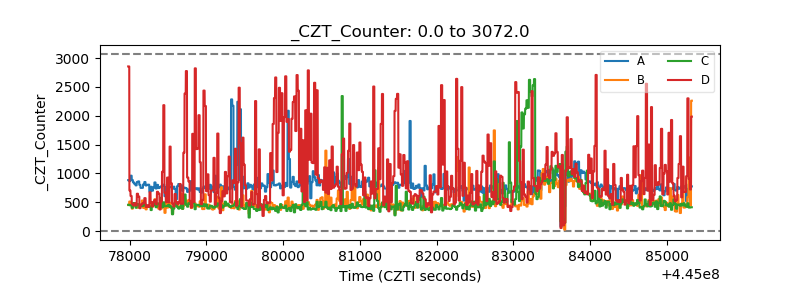 |
| +2.5 Volts monitor | 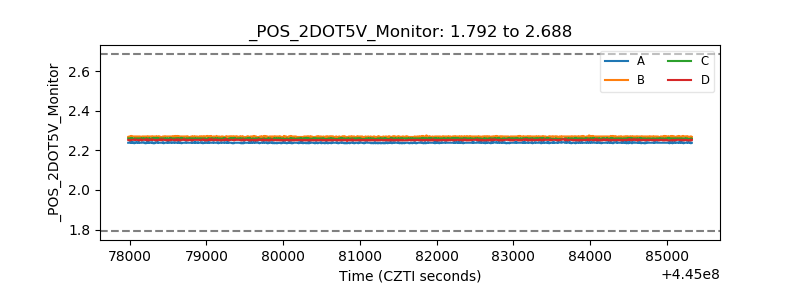 |
| +5 Volts monitor | 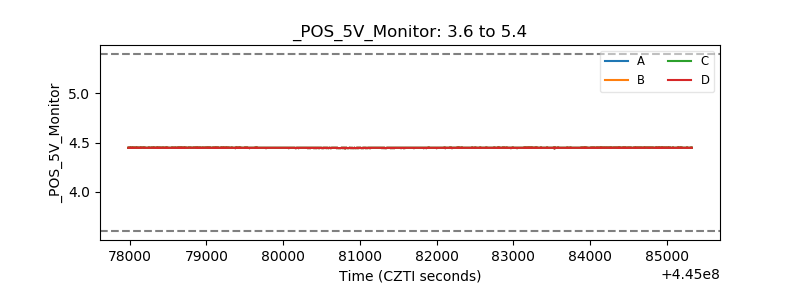 |
| _ROLL_ROT | 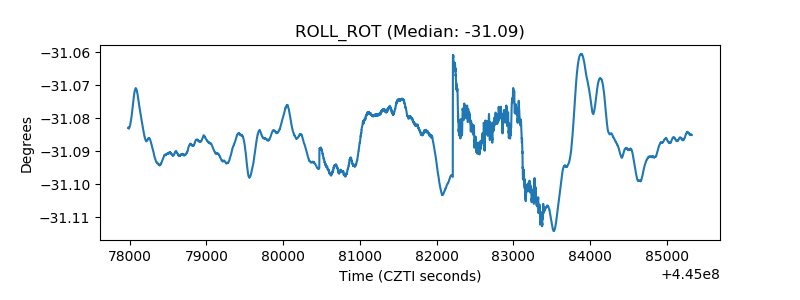 |
| _Roll_DEC | 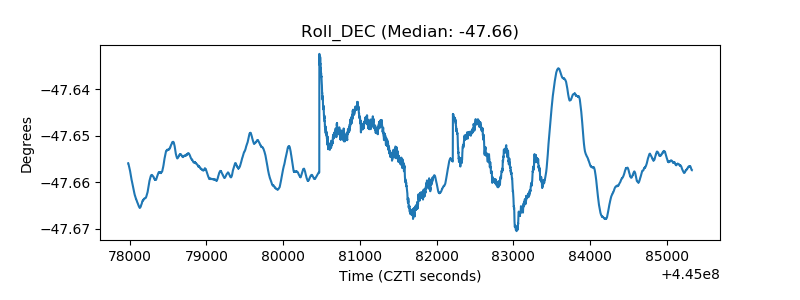 |
| _Roll_RA | 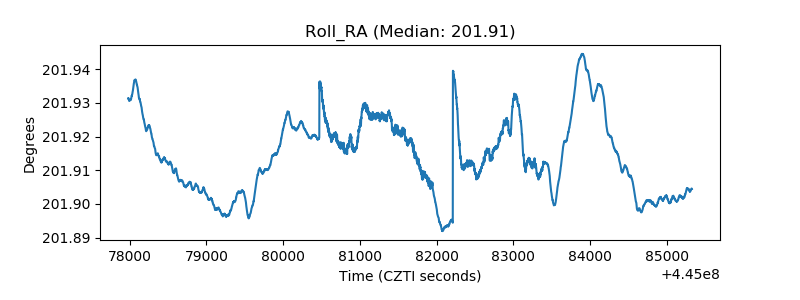 |
| Veto Counter | 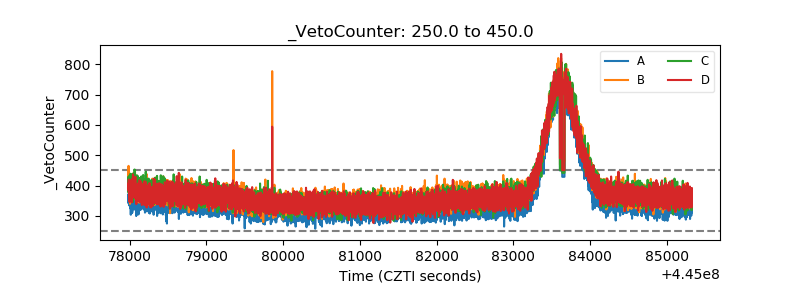 |