| Param | Original file | Final file |
|---|---|---|
| Filename | modeM0/AS1A13_049T07_9000006056_45232cztM0_level2.fits | modeM0/AS1A13_049T07_9000006056_45232cztM0_level2_quad_clean.evt |
| Size (bytes) | 573,707,520 | 116,478,720 |
| Size | 547.1 MB | 111.1 MB |
| Events in quadrant A | 5,883,884 | 781,025 |
| Events in quadrant B | 4,019,294 | 804,627 |
| Events in quadrant C | 3,522,645 | 781,629 |
| Events in quadrant D | 7,241,249 | 647,789 |
| Mode M0 | |||
|---|---|---|---|
| Quadrant | BADHDUFLAG | Total packets | Discarded packets |
| A | 0 | 22781 | 0 |
| B | 0 | 16900 | 0 |
| C | 0 | 15762 | 0 |
| D | 0 | 26542 | 6 |
| Mode SS | |||
|---|---|---|---|
| Quadrant | BADHDUFLAG | Total packets | Discarded packets |
| A | 0 | 146 | 0 |
| B | 0 | 146 | 0 |
| C | 0 | 146 | 0 |
| D | 0 | 146 | 0 |
| Quadrant | Total seconds | Saturated seconds | Saturation percentage |
|---|---|---|---|
| A | 7352 | 107 | 1.455386% |
| B | 7352 | 131 | 1.781828% |
| C | 7353 | 45 | 0.611995% |
| D | 7352 | 861 | 11.711099% |
Noise dominated data is calculated using 1-second bins in cleaned event files. If a bin has >2000 counts, and if more than 50% of those come from <1% of pixels, then it is considered to be noise-dominated and hence unusable.
| Quadrant | # 1 sec bins | Bins with >0 counts | Bins with >2000 counts | High rate bins dominated by noise | Noise dominated (total time) | Noise dominated (detector-on time) | Marked lightcurve |
|---|---|---|---|---|---|---|---|
| A | 7352 | 7352 | 36 | 36 | 0.49% | 0.49% | 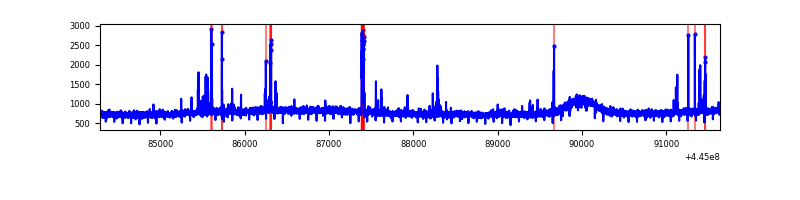 |
| B | 7352 | 7352 | 52 | 52 | 0.71% | 0.71% | 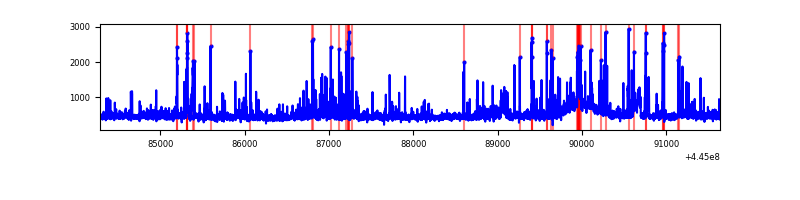 |
| C | 7353 | 7353 | 37 | 37 | 0.50% | 0.50% | 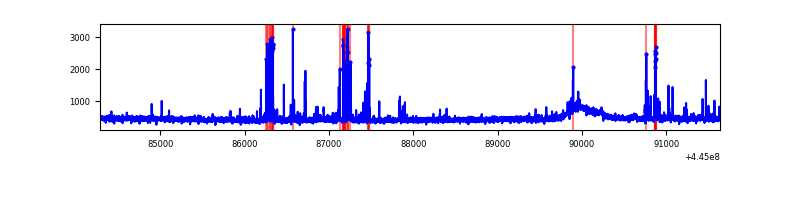 |
| D | 7351 | 7351 | 810 | 810 | 11.02% | 11.02% | 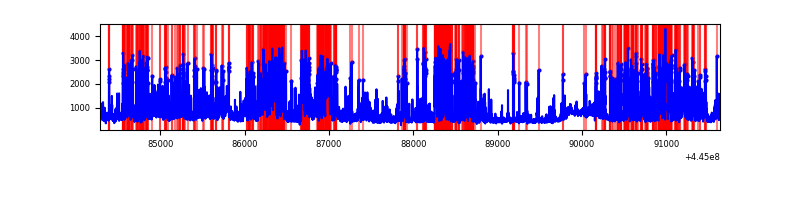 |
Top three noisy pixels from each quadrant. If the there are fewer than three noisy pixels in the level2.evt file, extra rows are filled as -1
| Pixel properties | Quadrant properties | ||||||
|---|---|---|---|---|---|---|---|
| Quadrant | DetID | PixID | Counts | Sigma | Mean | Median | Sigma |
| A | 10 | 83 | 2503315 | 14342.03 | 831 | 811 | 174.5 |
| A | 13 | 248 | 147619 | 841.37 | 831 | 811 | 174.5 |
| A | 2 | 79 | 12482 | 66.89 | 831 | 811 | 174.5 |
| B | 3 | 112 | 277721 | 1691.13 | 826 | 800 | 163.7 |
| B | 5 | 32 | 232079 | 1412.4 | 826 | 800 | 163.7 |
| B | 12 | 48 | 177246 | 1077.54 | 826 | 800 | 163.7 |
| C | 14 | 254 | 150202 | 769.87 | 822 | 823 | 194.0 |
| C | 12 | 2 | 50622 | 256.65 | 822 | 823 | 194.0 |
| C | 15 | 208 | 36075 | 181.68 | 822 | 823 | 194.0 |
| D | 13 | 249 | 2752034 | 13744.4 | 788 | 763 | 200.2 |
| D | 1 | 52 | 276057 | 1375.27 | 788 | 763 | 200.2 |
| D | 12 | 17 | 203561 | 1013.11 | 788 | 763 | 200.2 |
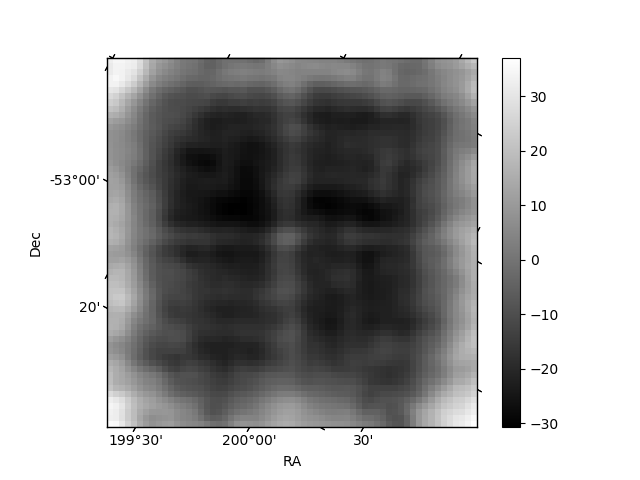
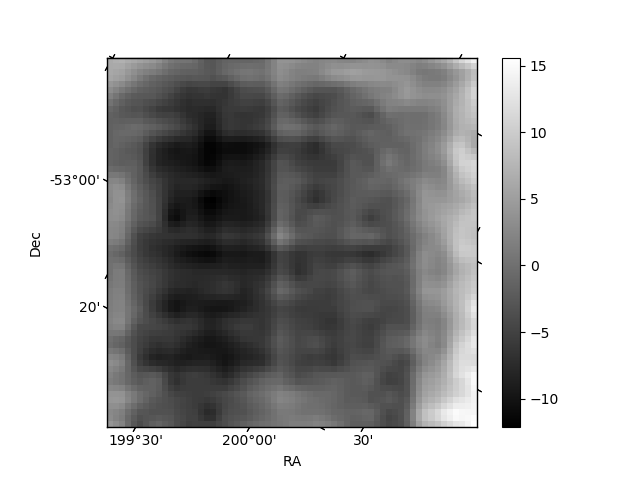
Histogram calculated using DETX and DETY for each event in the final _common_clean file
| Quadrant A | 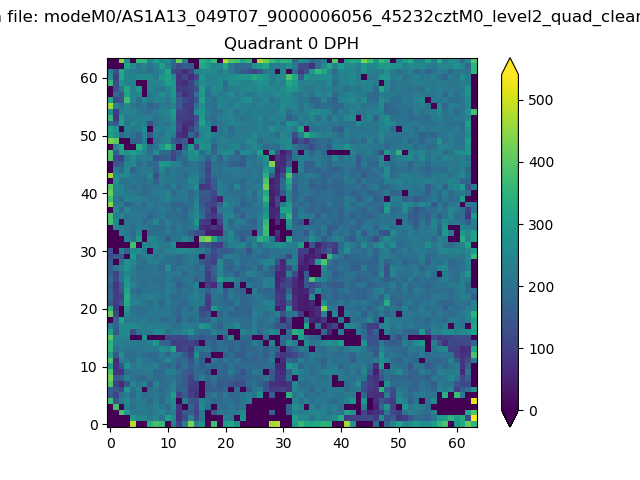 |
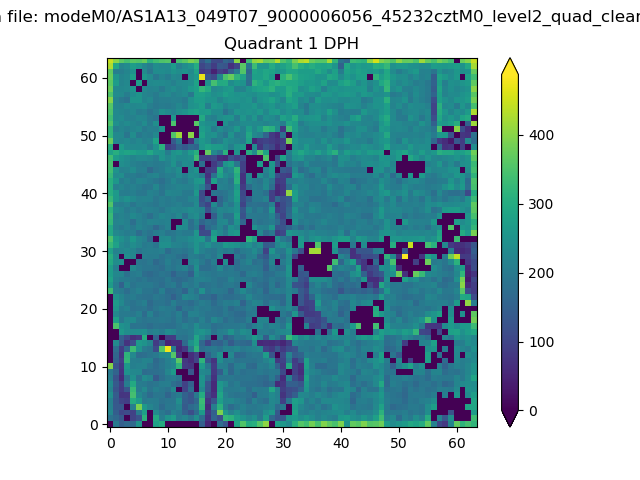 |
Quadrant B |
|---|---|---|---|
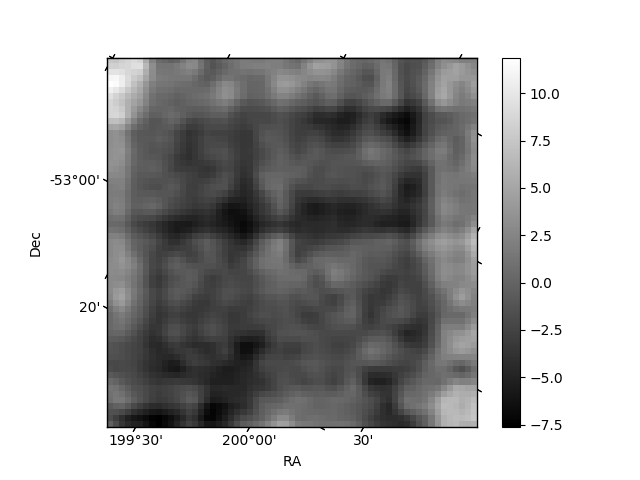
| Quadrant D | 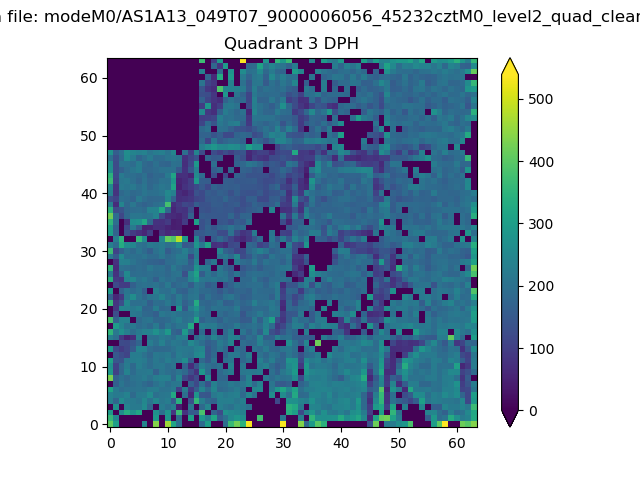 |
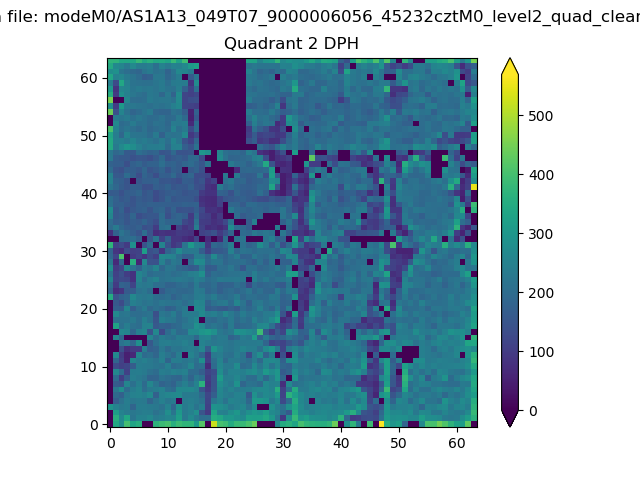 |
Quadrant C |
| Plot type | Count rate plots | Images |
|---|---|---|
| Comparison with Poisson distribution Blue bars denote a histogram of data divided into 1 sec bins. Red curve is a Poisson curve with rate = median count rate of data. |
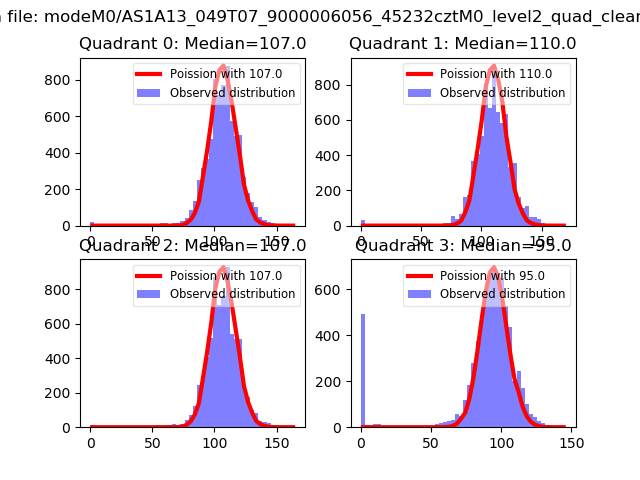 |
 |
| Quadrant-wise count rates Data is divided into 100 sec bins |
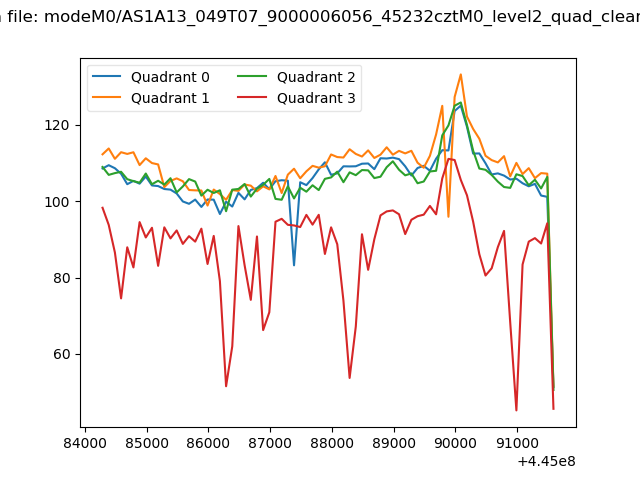 |
|
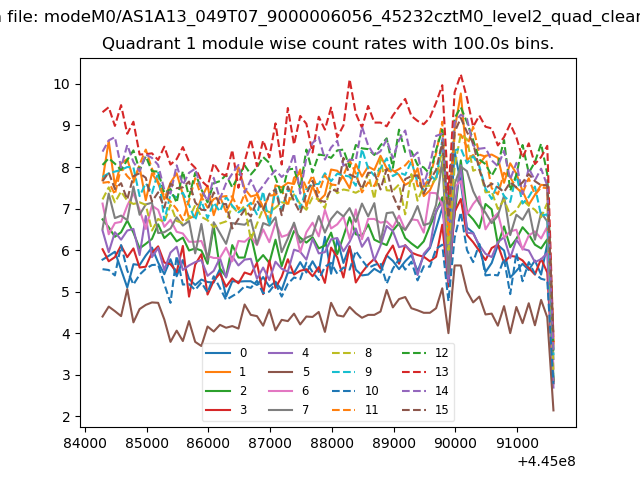
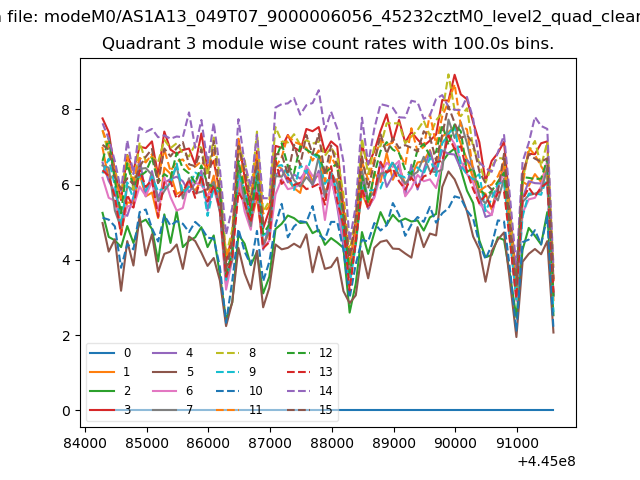
| Module-wise count rates for Quadrant A Data is divided into 100 sec bins |
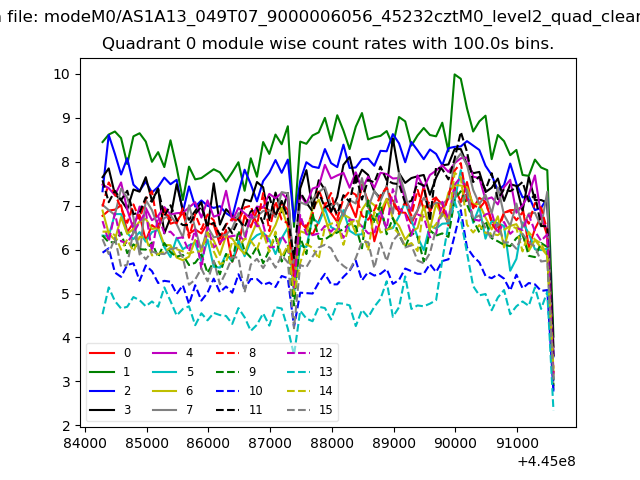 |
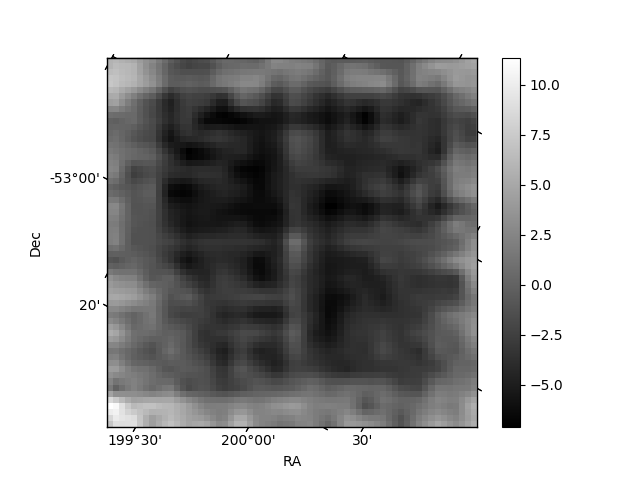 |
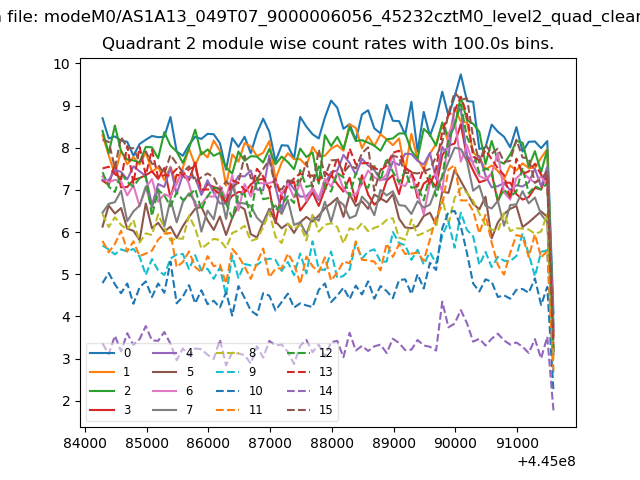
| Module-wise count rates for Quadrant B Data is divided into 100 sec bins |
 |
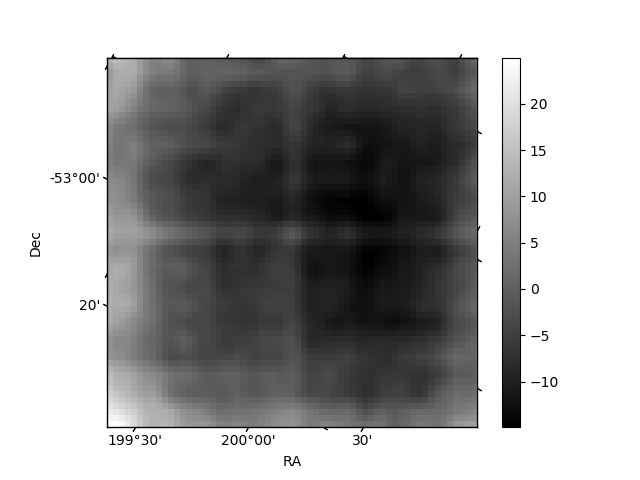 |
| Module-wise count rates for Quadrant C Data is divided into 100 sec bins |
 |
 |
| Module-wise count rates for Quadrant D Data is divided into 100 sec bins |
 |
 |
| Parameter | Plot |
|---|---|
| CZT HV Monitor | 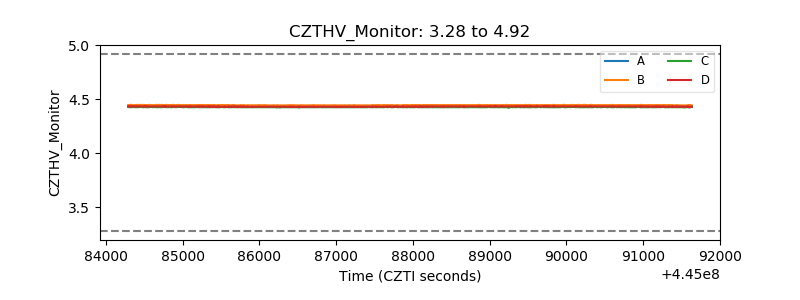 |
| D_VDD | 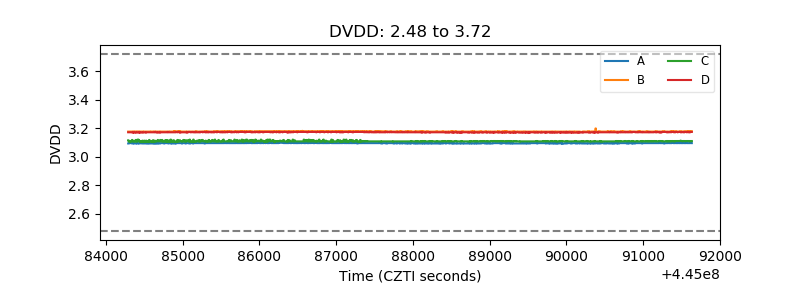 |
| Temperature 1 | 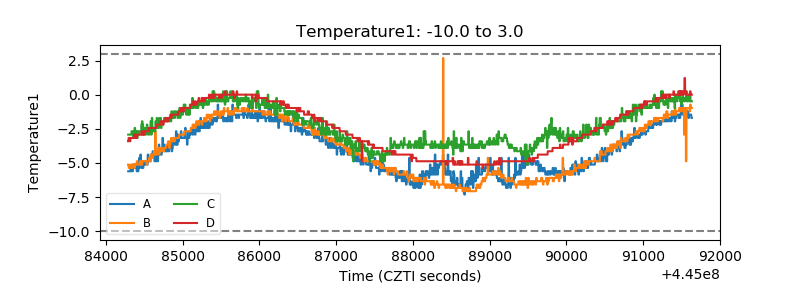 |
| Veto HV Monitor | 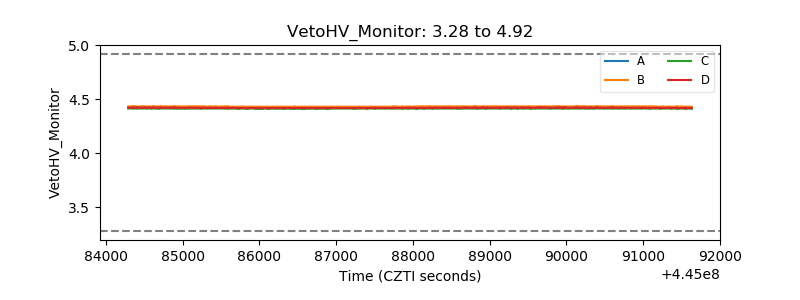 |
| Veto LLD | 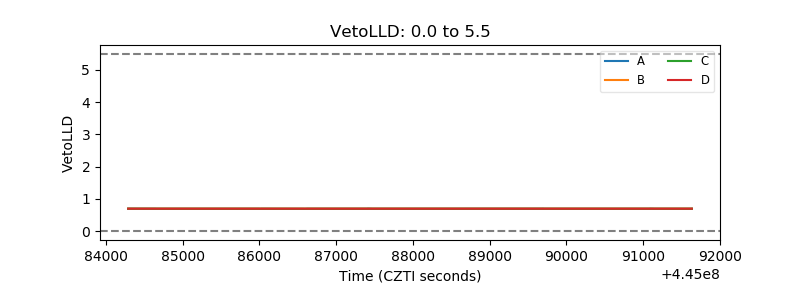 |
| Alpha Counter | 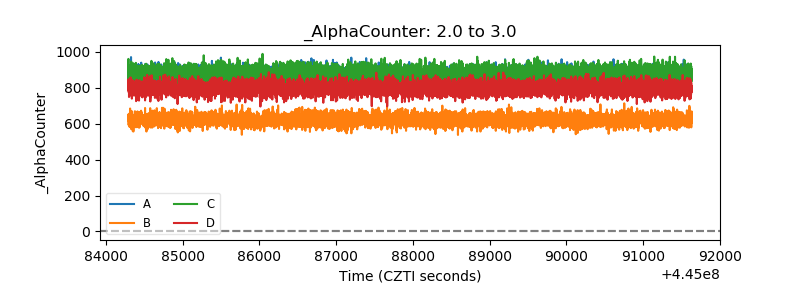 |
| _CPM_Rate | 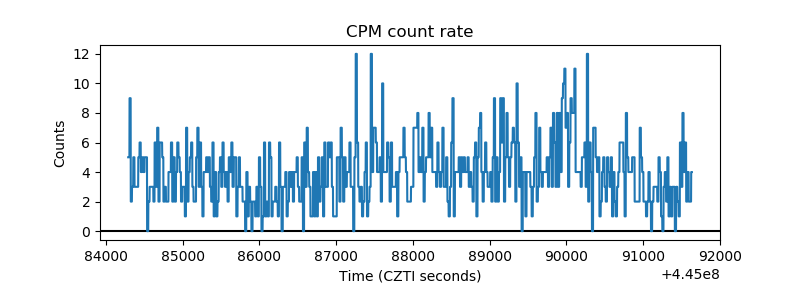 |
| CZT Counter | 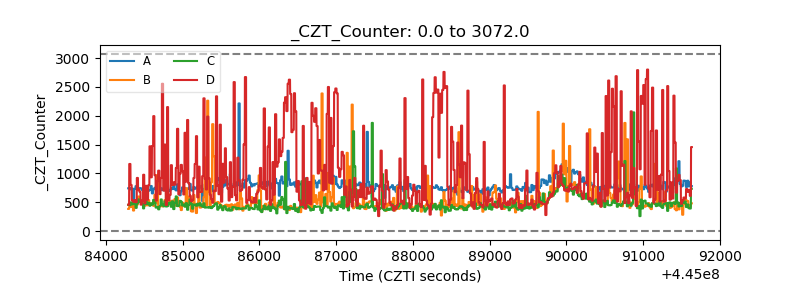 |
| +2.5 Volts monitor | 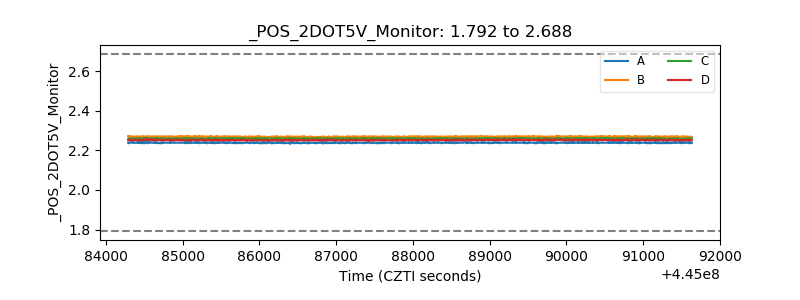 |
| +5 Volts monitor |  |
| _ROLL_ROT | 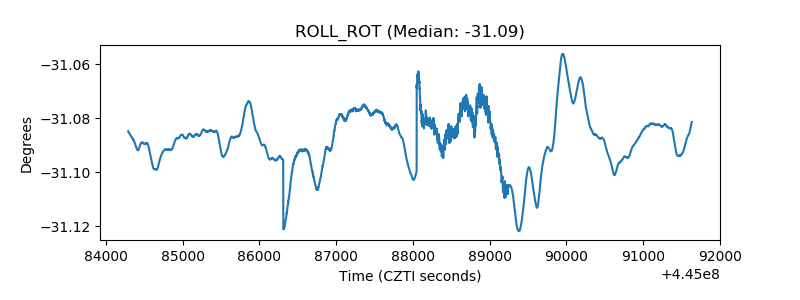 |
| _Roll_DEC | 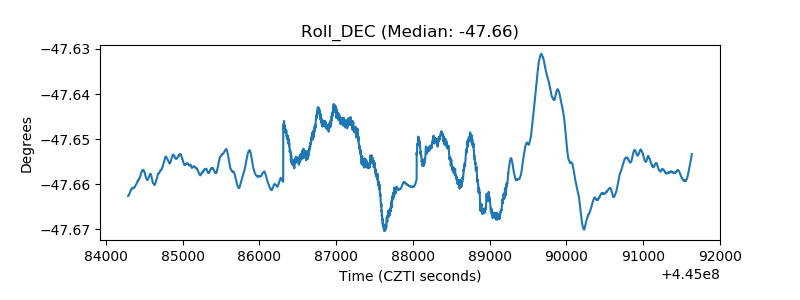 |
| _Roll_RA | 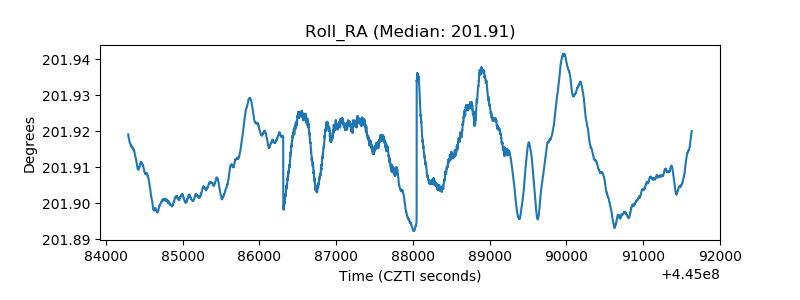 |
| Veto Counter | 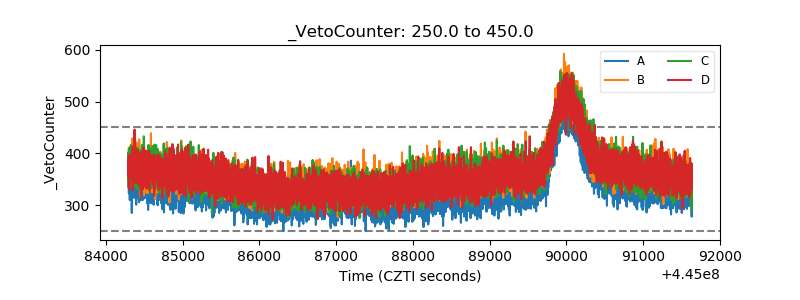 |