| Param | Original file | Final file |
|---|---|---|
| Filename | modeM0/AS1A13_049T07_9000006056_45233cztM0_level2.fits | modeM0/AS1A13_049T07_9000006056_45233cztM0_level2_quad_clean.evt |
| Size (bytes) | 335,669,760 | 63,149,760 |
| Size | 320.1 MB | 60.2 MB |
| Events in quadrant A | 3,500,909 | 422,766 |
| Events in quadrant B | 2,203,364 | 436,175 |
| Events in quadrant C | 2,087,225 | 423,832 |
| Events in quadrant D | 4,317,380 | 342,461 |
| Mode M0 | |||
|---|---|---|---|
| Quadrant | BADHDUFLAG | Total packets | Discarded packets |
| A | 0 | 13484 | 352 |
| B | 0 | 9672 | 296 |
| C | 0 | 9363 | 262 |
| D | 0 | 16378 | 802 |
| Mode SS | |||
|---|---|---|---|
| Quadrant | BADHDUFLAG | Total packets | Discarded packets |
| A | 0 | 83 | 1 |
| B | 0 | 84 | 0 |
| C | 0 | 83 | 1 |
| D | 0 | 84 | 0 |
| Quadrant | Total seconds | Saturated seconds | Saturation percentage |
|---|---|---|---|
| A | 4081 | 103 | 2.523891% |
| B | 4074 | 89 | 2.184585% |
| C | 4062 | 55 | 1.354013% |
| D | 4015 | 583 | 14.520548% |
Noise dominated data is calculated using 1-second bins in cleaned event files. If a bin has >2000 counts, and if more than 50% of those come from <1% of pixels, then it is considered to be noise-dominated and hence unusable.
| Quadrant | # 1 sec bins | Bins with >0 counts | Bins with >2000 counts | High rate bins dominated by noise | Noise dominated (total time) | Noise dominated (detector-on time) | Marked lightcurve |
|---|---|---|---|---|---|---|---|
| A | 4213 | 4189 | 42 | 42 | 1.00% | 1.00% | 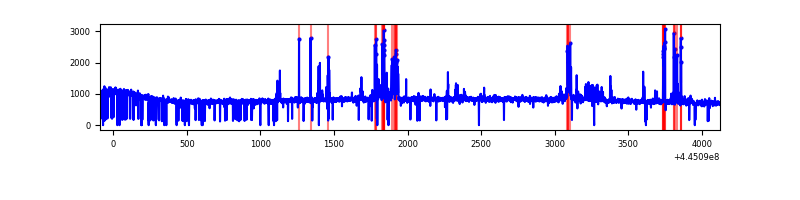 |
| B | 4213 | 4163 | 28 | 28 | 0.66% | 0.67% | 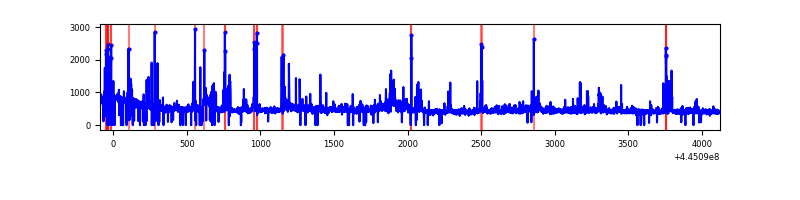 |
| C | 4213 | 4160 | 44 | 44 | 1.04% | 1.06% | 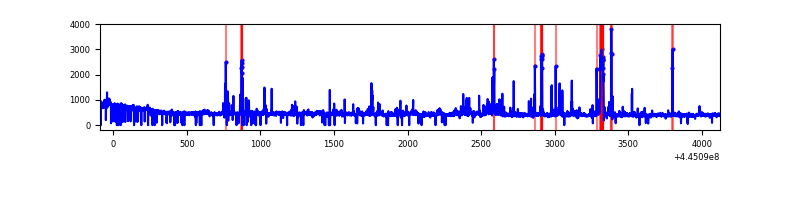 |
| D | 4214 | 4144 | 543 | 543 | 12.89% | 13.10% | 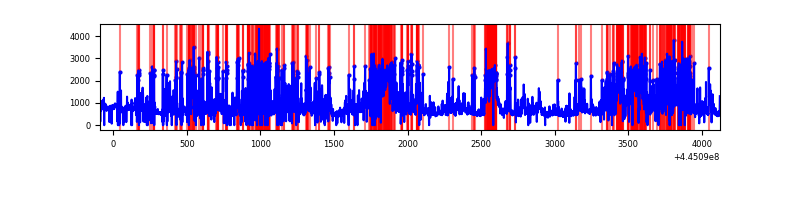 |
Top three noisy pixels from each quadrant. If the there are fewer than three noisy pixels in the level2.evt file, extra rows are filled as -1
| Pixel properties | Quadrant properties | ||||||
|---|---|---|---|---|---|---|---|
| Quadrant | DetID | PixID | Counts | Sigma | Mean | Median | Sigma |
| A | 10 | 83 | 1487734 | 15370.56 | 459 | 448 | 96.8 |
| A | 13 | 248 | 179748 | 1853.0 | 459 | 448 | 96.8 |
| A | 15 | 174 | 49600 | 507.97 | 459 | 448 | 96.8 |
| B | 3 | 112 | 151615 | 1656.37 | 455 | 440 | 91.3 |
| B | 5 | 32 | 134622 | 1470.19 | 455 | 440 | 91.3 |
| B | 5 | 172 | 25333 | 272.74 | 455 | 440 | 91.3 |
| C | 14 | 254 | 197938 | 1846.36 | 446 | 447 | 107.0 |
| C | 3 | 9 | 53193 | 493.13 | 446 | 447 | 107.0 |
| C | 12 | 2 | 38316 | 354.04 | 446 | 447 | 107.0 |
| D | 13 | 249 | 1002704 | 9269.17 | 423 | 409 | 108.1 |
| D | 4 | 232 | 360150 | 3326.86 | 423 | 409 | 108.1 |
| D | 5 | 222 | 255454 | 2358.64 | 423 | 409 | 108.1 |
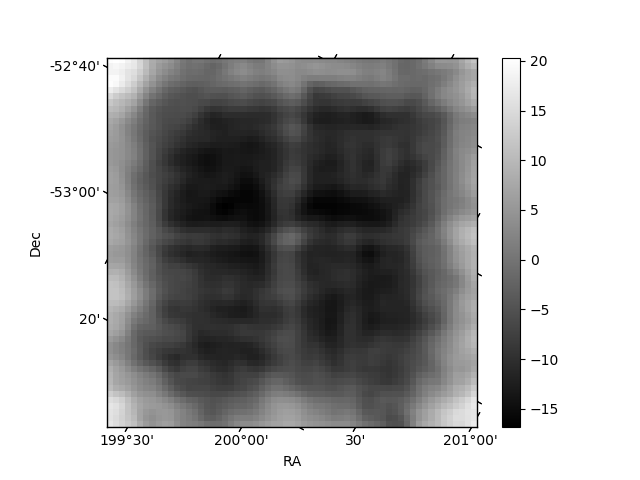
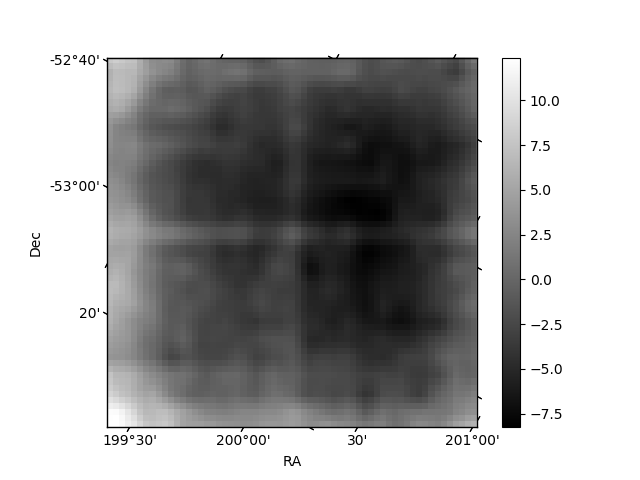
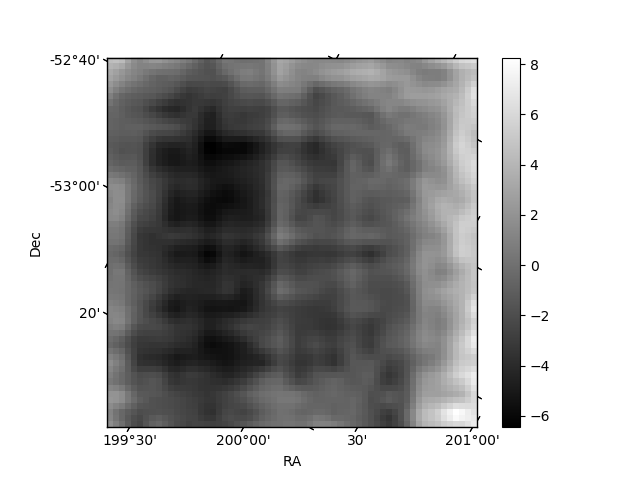
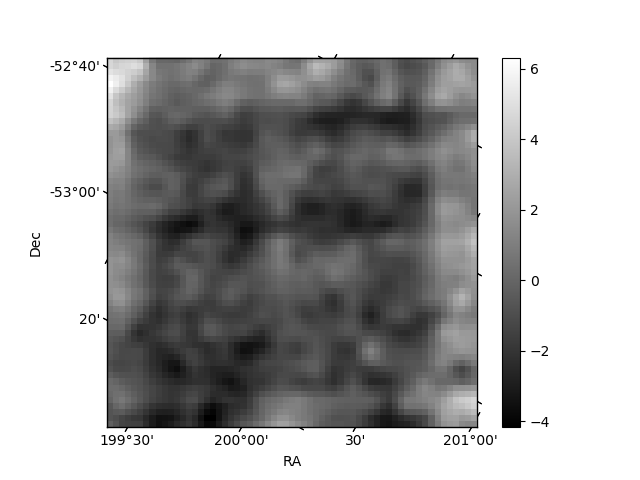
Histogram calculated using DETX and DETY for each event in the final _common_clean file
| Quadrant A | 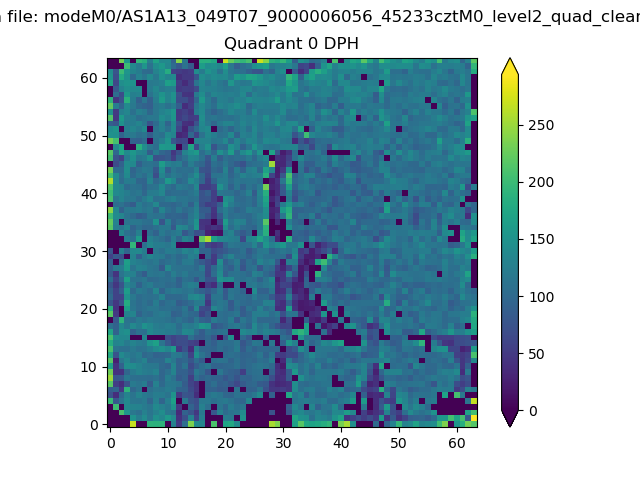 |
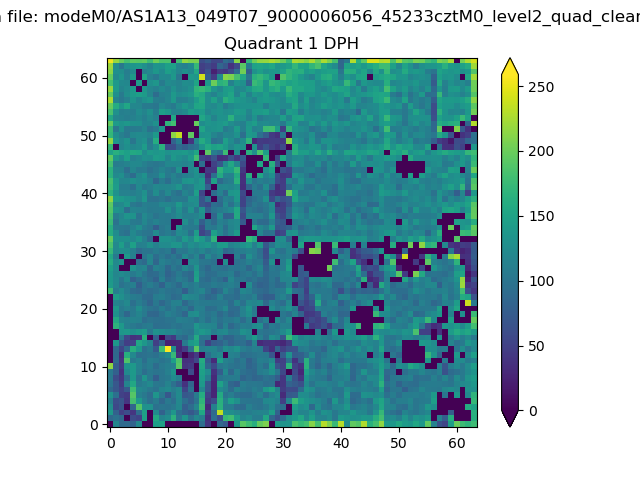 |
Quadrant B |
|---|---|---|---|
| Quadrant D | 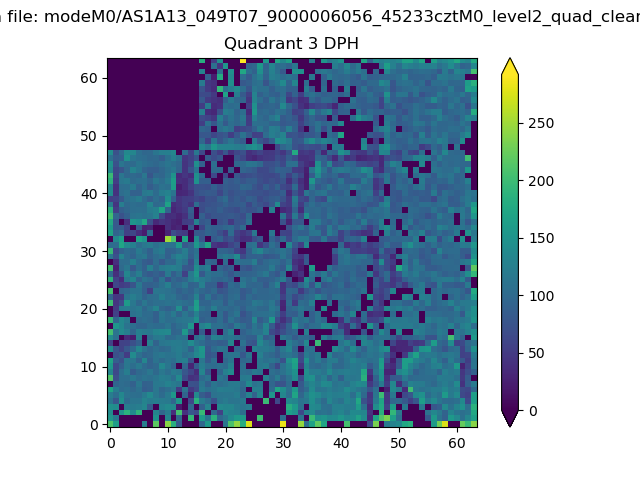 |
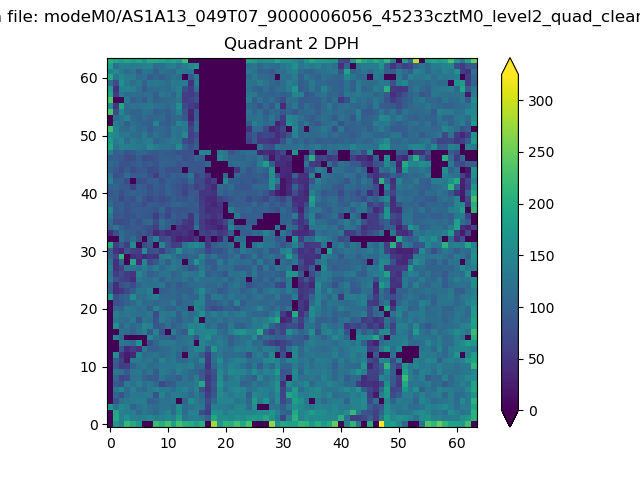 |
Quadrant C |
| Plot type | Count rate plots | Images |
|---|---|---|
| Comparison with Poisson distribution Blue bars denote a histogram of data divided into 1 sec bins. Red curve is a Poisson curve with rate = median count rate of data. |
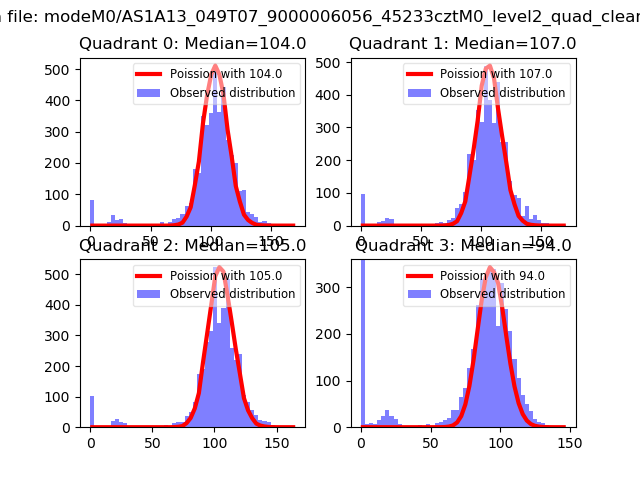 |
 |
| Quadrant-wise count rates Data is divided into 100 sec bins |
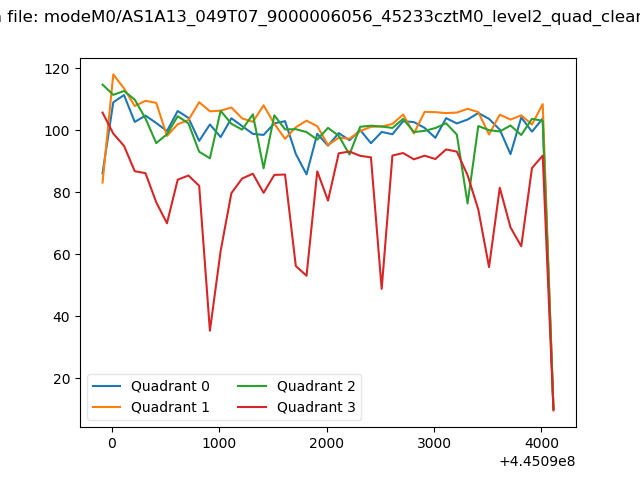 |
|
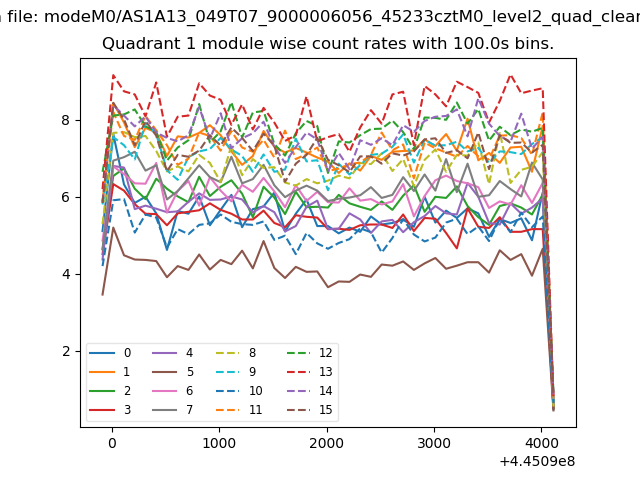
| Module-wise count rates for Quadrant A Data is divided into 100 sec bins |
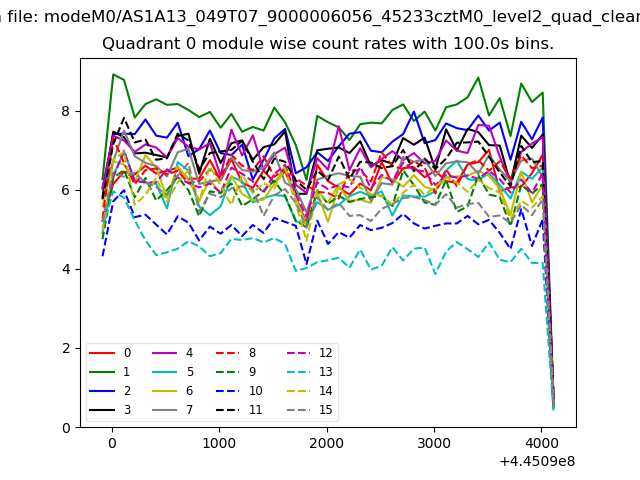 |
 |
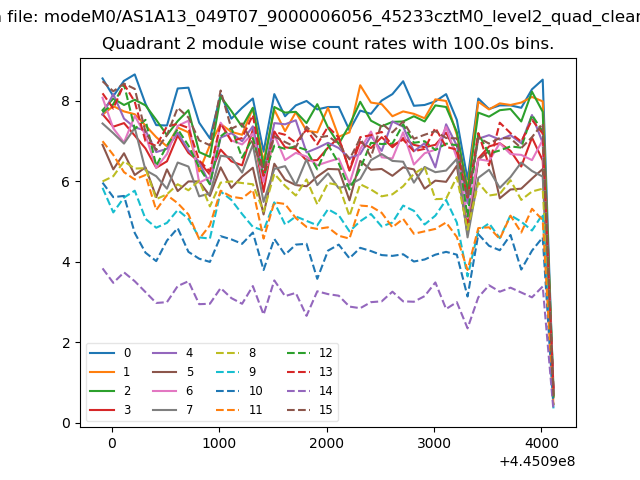
| Module-wise count rates for Quadrant B Data is divided into 100 sec bins |
 |
 |
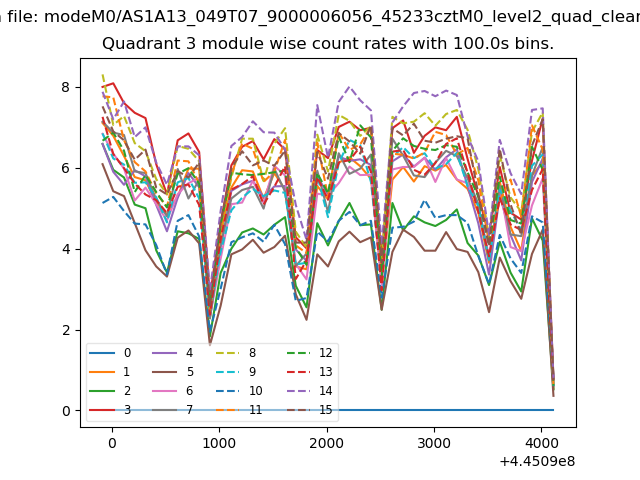
| Module-wise count rates for Quadrant C Data is divided into 100 sec bins |
 |
 |
| Module-wise count rates for Quadrant D Data is divided into 100 sec bins |
 |
 |
| Parameter | Plot |
|---|---|
| CZT HV Monitor |  |
| D_VDD | 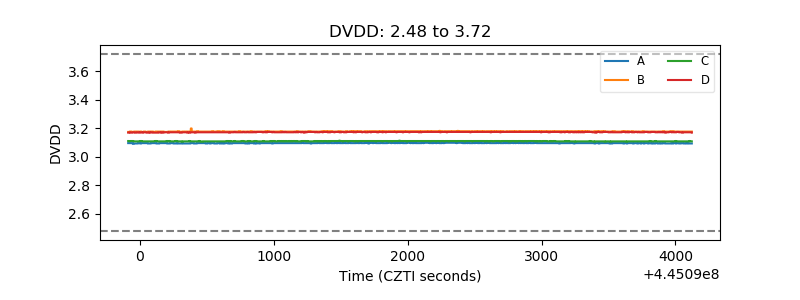 |
| Temperature 1 | 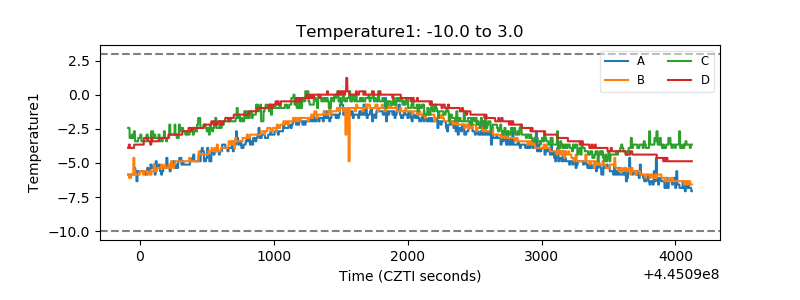 |
| Veto HV Monitor | 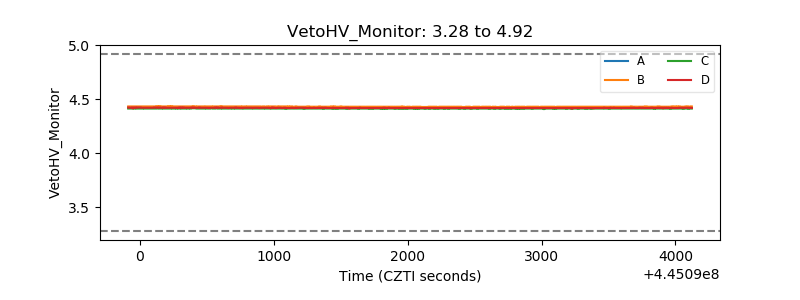 |
| Veto LLD | 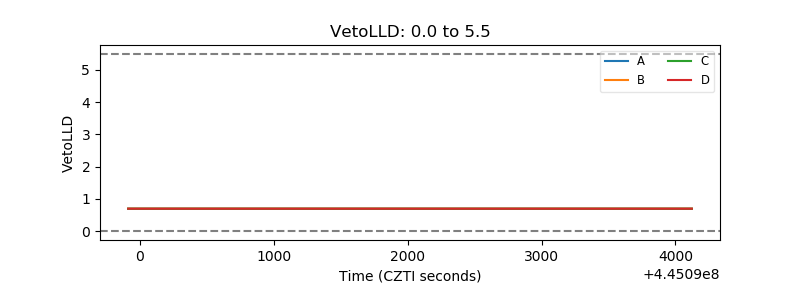 |
| Alpha Counter | 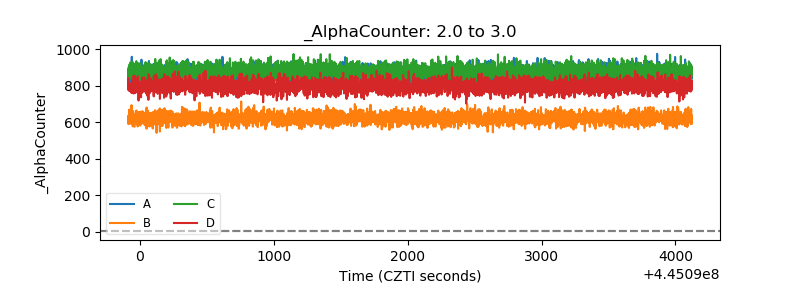 |
| _CPM_Rate | 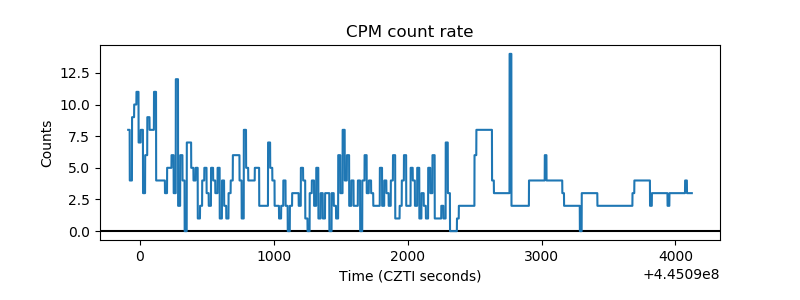 |
| CZT Counter | 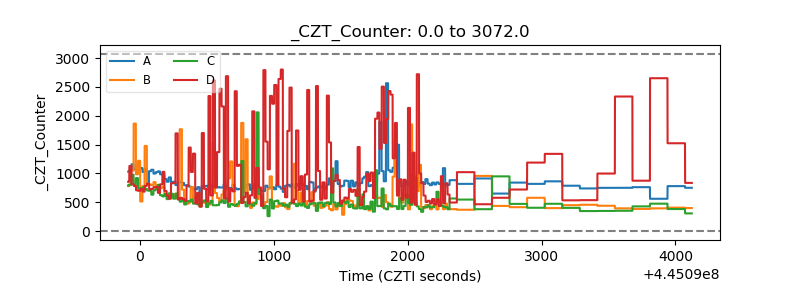 |
| +2.5 Volts monitor | 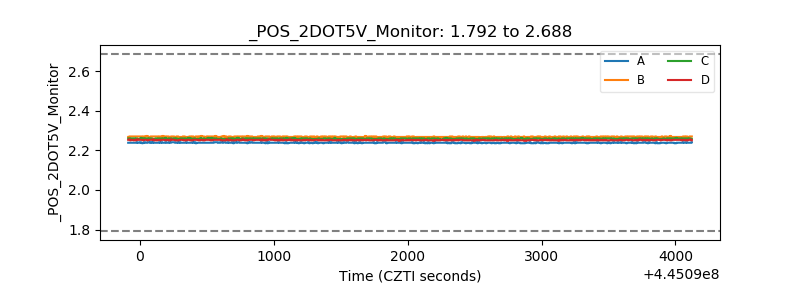 |
| +5 Volts monitor | 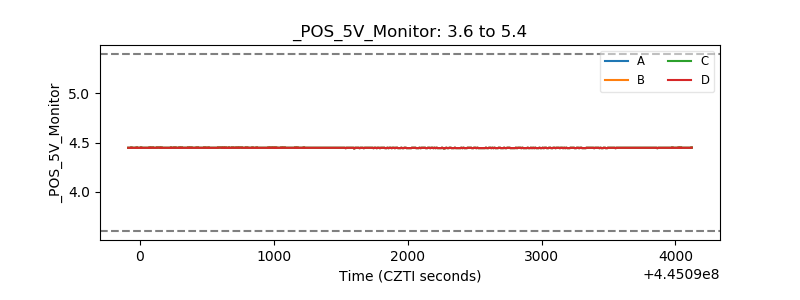 |
| _ROLL_ROT | 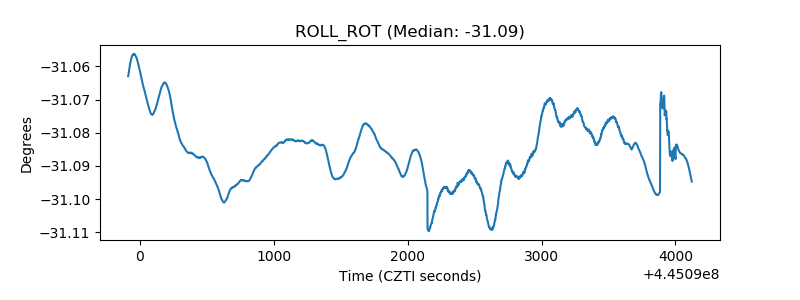 |
| _Roll_DEC | 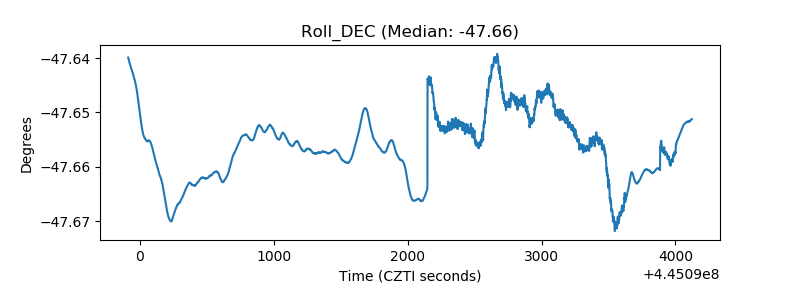 |
| _Roll_RA | 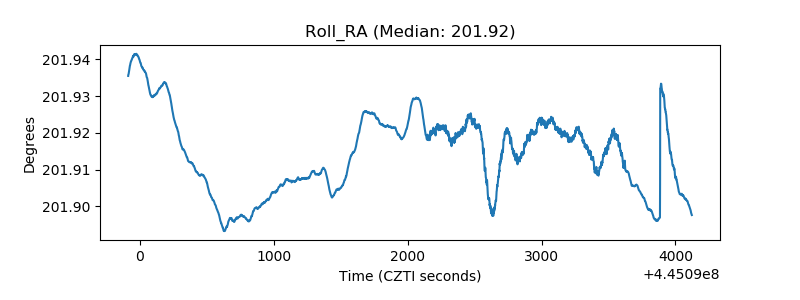 |
| Veto Counter | 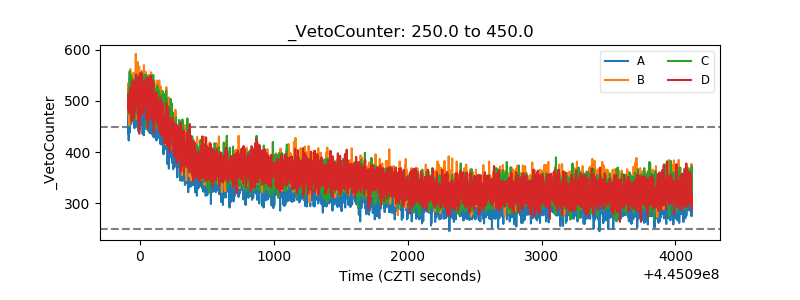 |