| Param | Original file | Final file |
|---|---|---|
| Filename | modeM0/AS1A13_049T07_9000006056_45396cztM0_level2.fits | modeM0/AS1A13_049T07_9000006056_45396cztM0_level2_quad_clean.evt |
| Size (bytes) | 473,578,560 | 98,303,040 |
| Size | 451.6 MB | 93.7 MB |
| Events in quadrant A | 5,245,242 | 658,122 |
| Events in quadrant B | 2,957,810 | 677,727 |
| Events in quadrant C | 3,162,586 | 646,893 |
| Events in quadrant D | 5,682,963 | 560,909 |
| Mode M0 | |||
|---|---|---|---|
| Quadrant | BADHDUFLAG | Total packets | Discarded packets |
| A | 0 | 19551 | 2 |
| B | 0 | 13203 | 1 |
| C | 0 | 13872 | 1 |
| D | 0 | 21195 | 1 |
| Mode M9 | |||
|---|---|---|---|
| Quadrant | BADHDUFLAG | Total packets | Discarded packets |
| A | 0 | 8 | 0 |
| B | 0 | 8 | 0 |
| C | 0 | 8 | 0 |
| D | 0 | 8 | 0 |
| Mode SS | |||
|---|---|---|---|
| Quadrant | BADHDUFLAG | Total packets | Discarded packets |
| A | 0 | 124 | 0 |
| B | 0 | 124 | 0 |
| C | 0 | 124 | 0 |
| D | 0 | 123 | 1 |
| Quadrant | Total seconds | Saturated seconds | Saturation percentage |
|---|---|---|---|
| A | 6207 | 130 | 2.094410% |
| B | 6207 | 56 | 0.902207% |
| C | 6207 | 97 | 1.562752% |
| D | 6207 | 611 | 9.843725% |
Noise dominated data is calculated using 1-second bins in cleaned event files. If a bin has >2000 counts, and if more than 50% of those come from <1% of pixels, then it is considered to be noise-dominated and hence unusable.
| Quadrant | # 1 sec bins | Bins with >0 counts | Bins with >2000 counts | High rate bins dominated by noise | Noise dominated (total time) | Noise dominated (detector-on time) | Marked lightcurve |
|---|---|---|---|---|---|---|---|
| A | 6942 | 6207 | 5 | 5 | 0.07% | 0.08% | 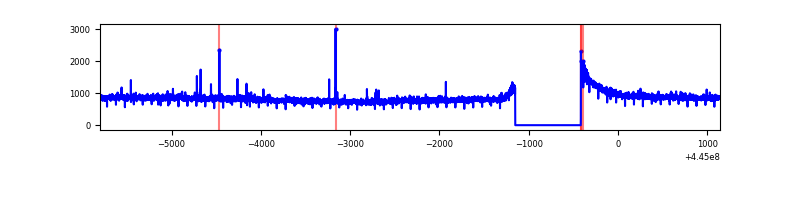 |
| B | 6942 | 6207 | 10 | 10 | 0.14% | 0.16% | 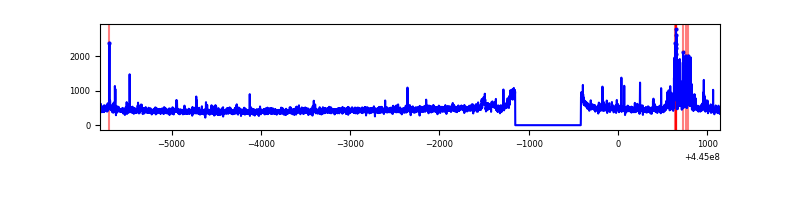 |
| C | 6942 | 6208 | 69 | 69 | 0.99% | 1.11% | 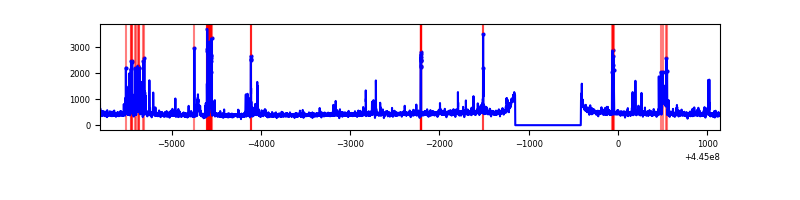 |
| D | 6942 | 6207 | 541 | 541 | 7.79% | 8.72% | 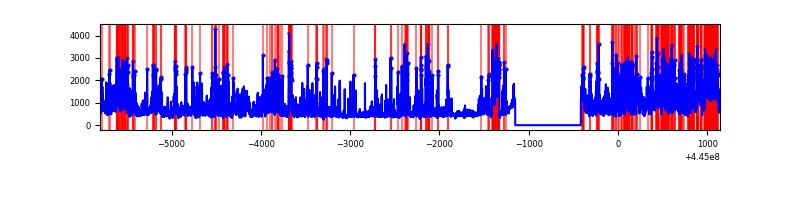 |
Top three noisy pixels from each quadrant. If the there are fewer than three noisy pixels in the level2.evt file, extra rows are filled as -1
| Pixel properties | Quadrant properties | ||||||
|---|---|---|---|---|---|---|---|
| Quadrant | DetID | PixID | Counts | Sigma | Mean | Median | Sigma |
| A | 10 | 83 | 2547243 | 17947.04 | 681 | 665 | 141.9 |
| A | 10 | 248 | 25457 | 174.72 | 681 | 665 | 141.9 |
| A | 9 | 191 | 16919 | 114.55 | 681 | 665 | 141.9 |
| B | 4 | 67 | 114753 | 843.91 | 681 | 662 | 135.2 |
| B | 0 | 186 | 25783 | 185.81 | 681 | 662 | 135.2 |
| B | 3 | 112 | 25204 | 181.53 | 681 | 662 | 135.2 |
| C | 14 | 254 | 253372 | 1592.63 | 669 | 671 | 158.7 |
| C | 0 | 239 | 149508 | 938.03 | 669 | 671 | 158.7 |
| C | 12 | 2 | 61431 | 382.93 | 669 | 671 | 158.7 |
| D | 13 | 249 | 1062997 | 6454.09 | 655 | 637 | 164.6 |
| D | 1 | 52 | 1020658 | 6196.88 | 655 | 637 | 164.6 |
| D | 2 | 249 | 642592 | 3900.03 | 655 | 637 | 164.6 |
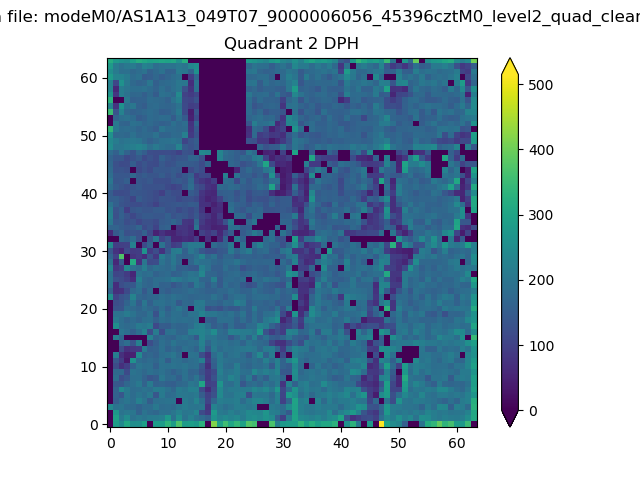
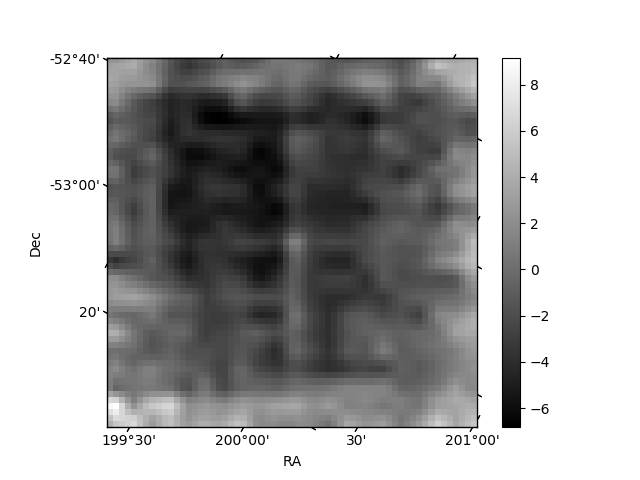
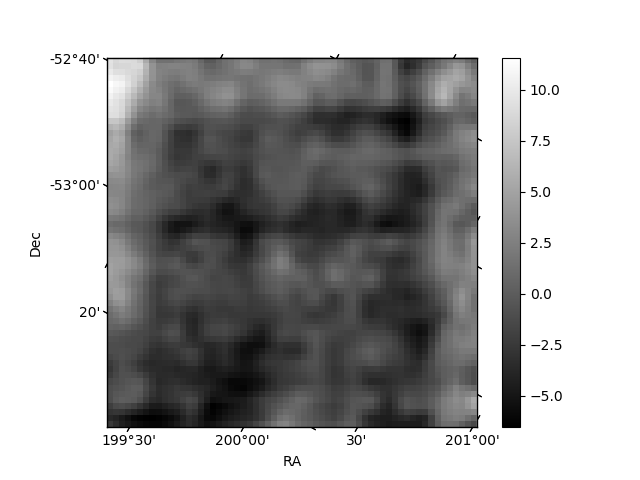
Histogram calculated using DETX and DETY for each event in the final _common_clean file
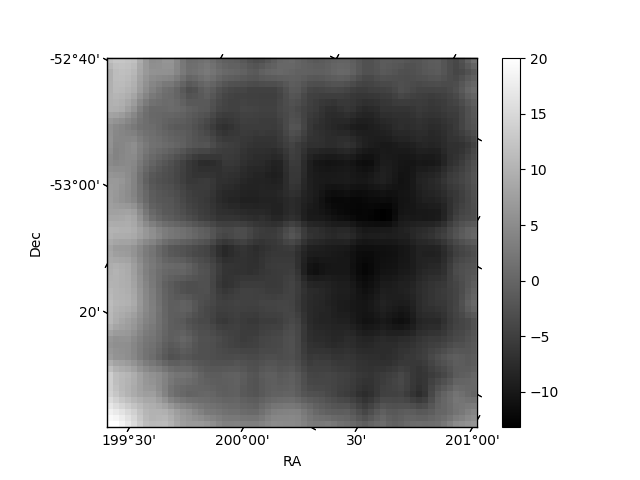
| Quadrant A | 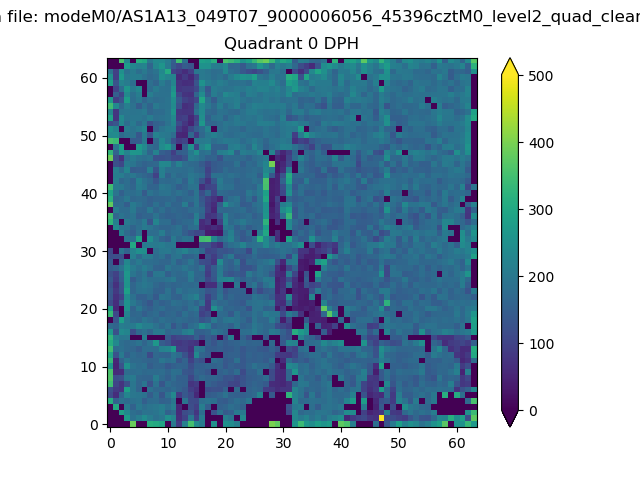 |
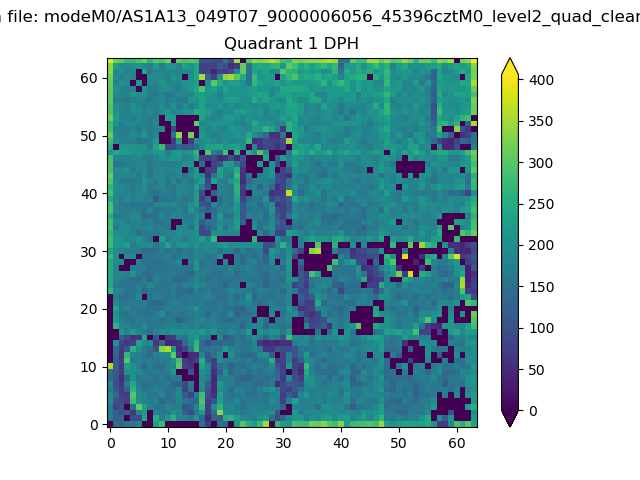 |
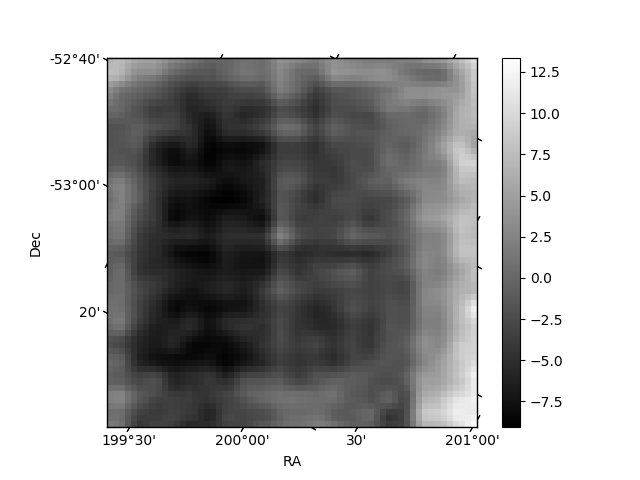
Quadrant B |
|---|---|---|---|
| Quadrant D | 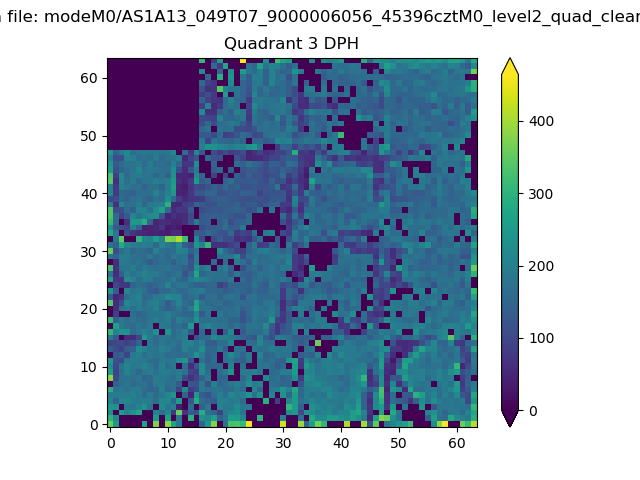 |
 |
Quadrant C |
| Plot type | Count rate plots | Images |
|---|---|---|
| Comparison with Poisson distribution Blue bars denote a histogram of data divided into 1 sec bins. Red curve is a Poisson curve with rate = median count rate of data. |
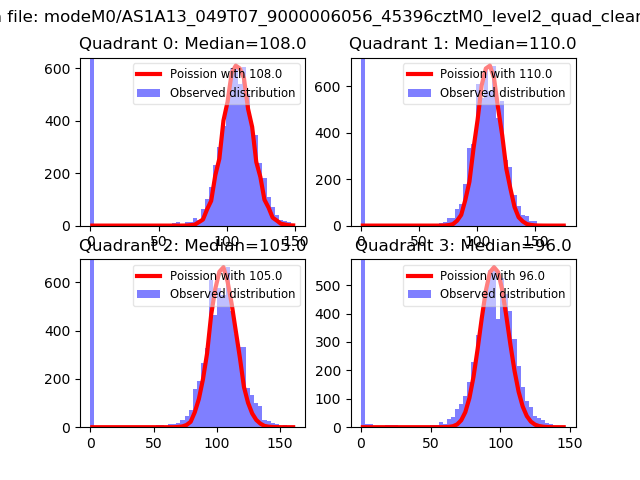 |
 |
| Quadrant-wise count rates Data is divided into 100 sec bins |
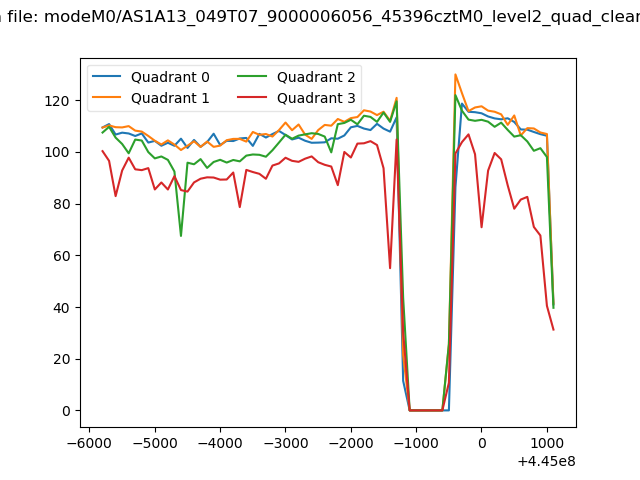 |
|
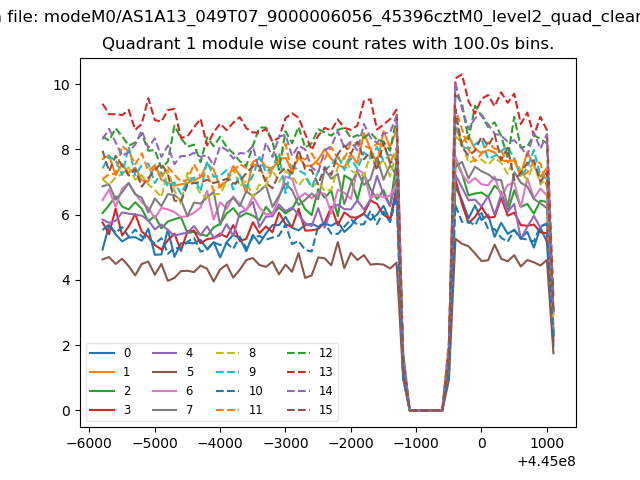
| Module-wise count rates for Quadrant A Data is divided into 100 sec bins |
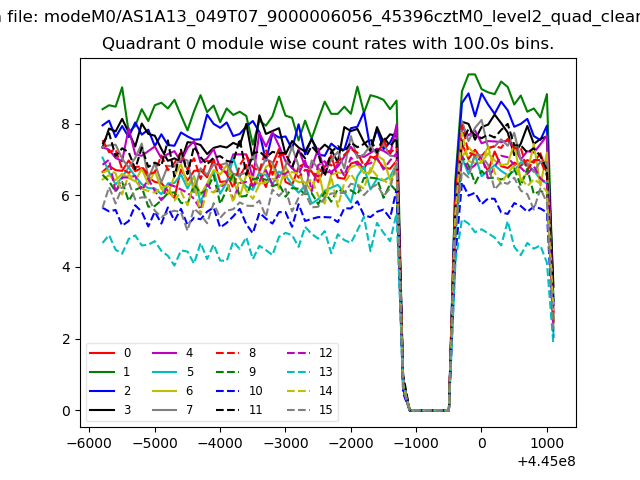 |
 |
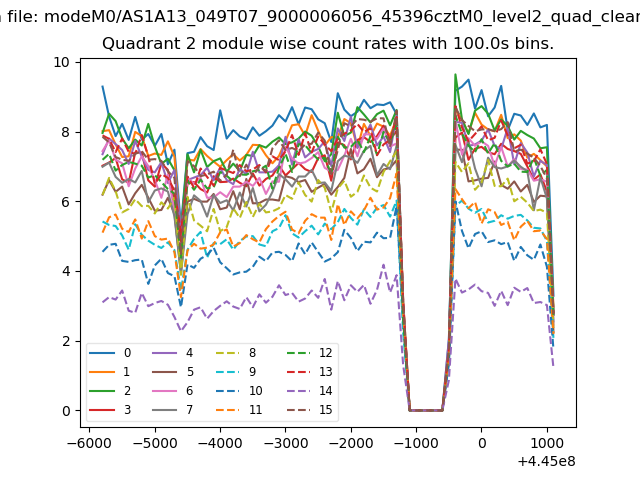
| Module-wise count rates for Quadrant B Data is divided into 100 sec bins |
 |
 |
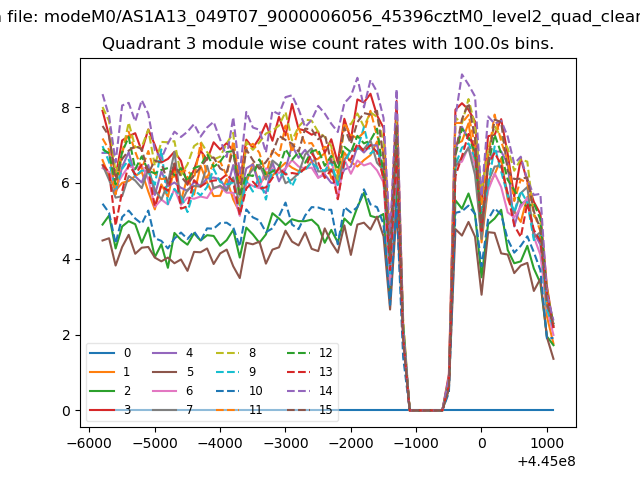
| Module-wise count rates for Quadrant C Data is divided into 100 sec bins |
 |
 |
| Module-wise count rates for Quadrant D Data is divided into 100 sec bins |
 |
 |
| Parameter | Plot |
|---|---|
| CZT HV Monitor | 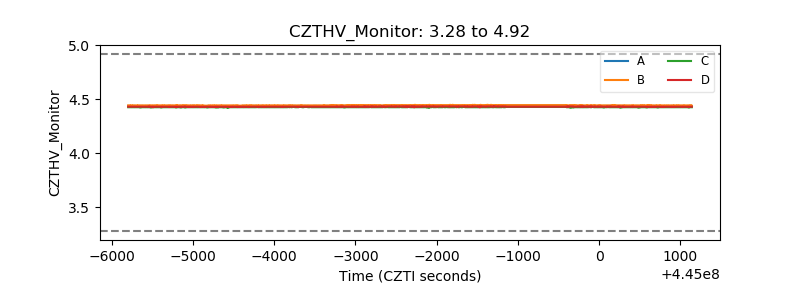 |
| D_VDD | 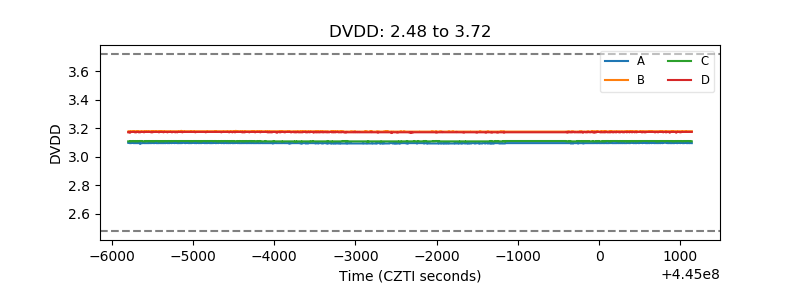 |
| Temperature 1 | 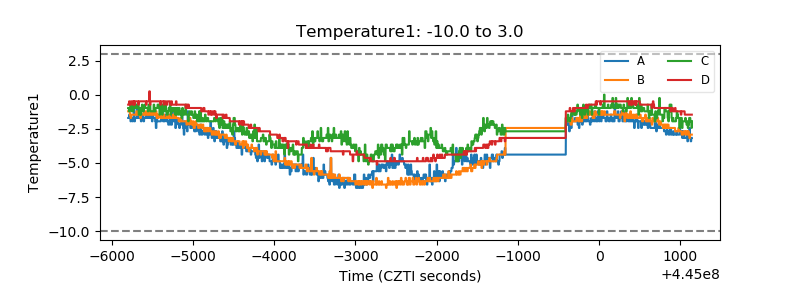 |
| Veto HV Monitor | 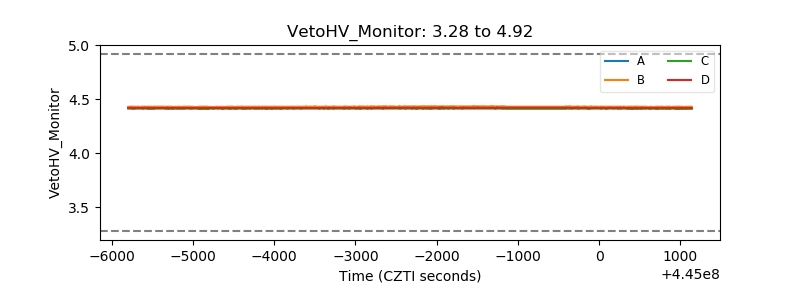 |
| Veto LLD | 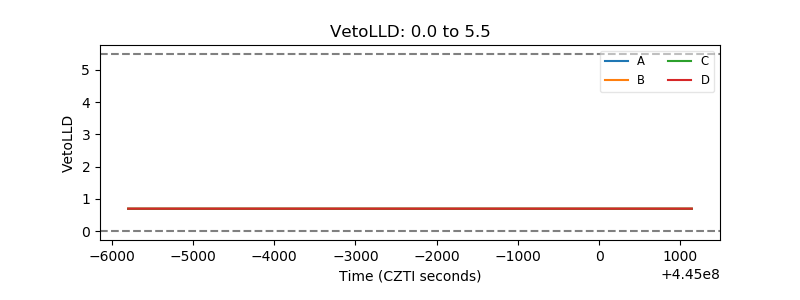 |
| Alpha Counter | 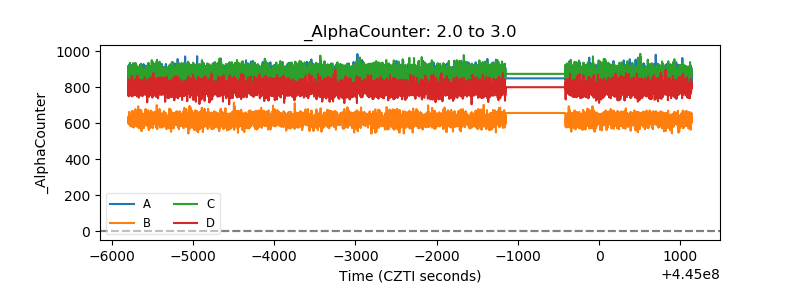 |
| _CPM_Rate | 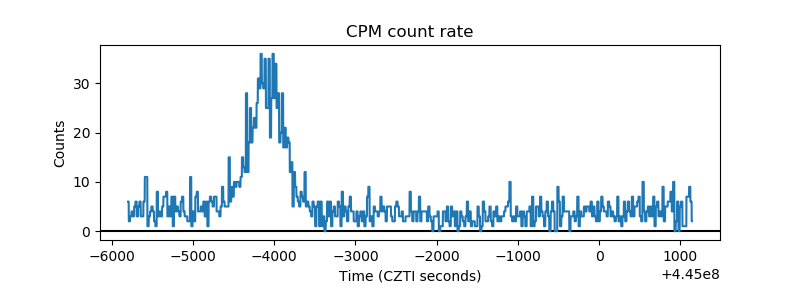 |
| CZT Counter | 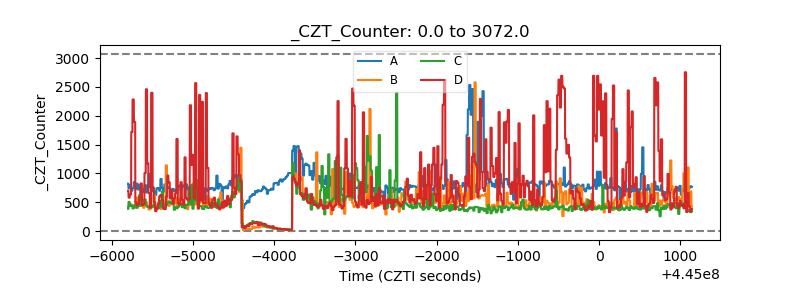 |
| +2.5 Volts monitor | 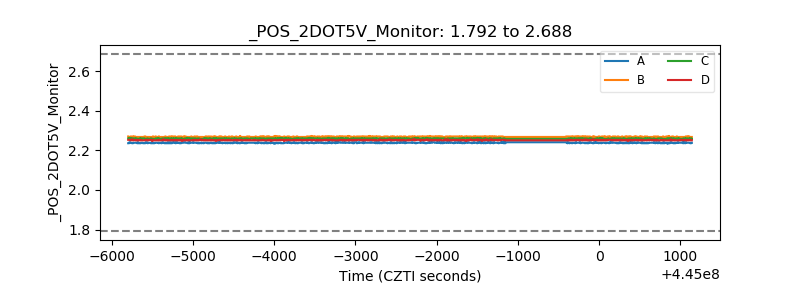 |
| +5 Volts monitor | 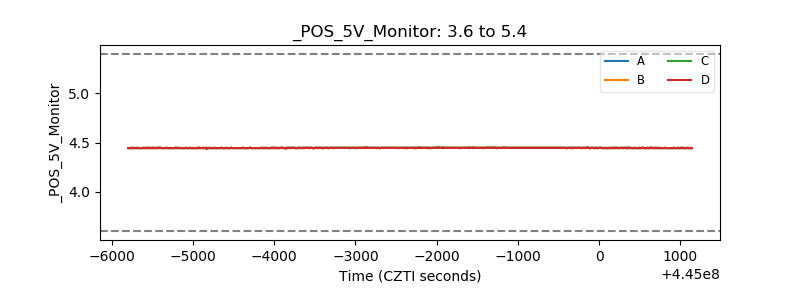 |
| _ROLL_ROT | 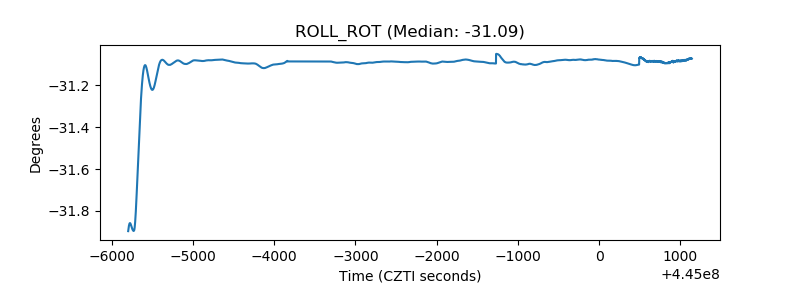 |
| _Roll_DEC | 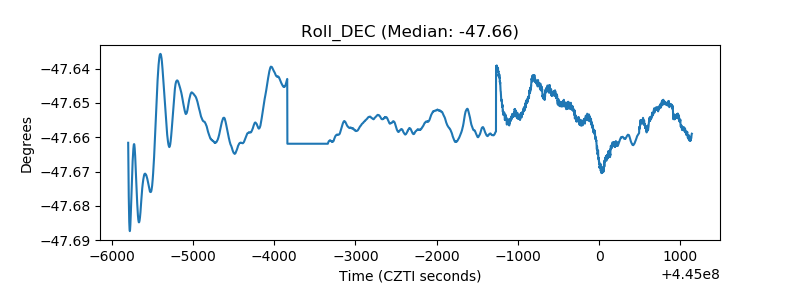 |
| _Roll_RA | 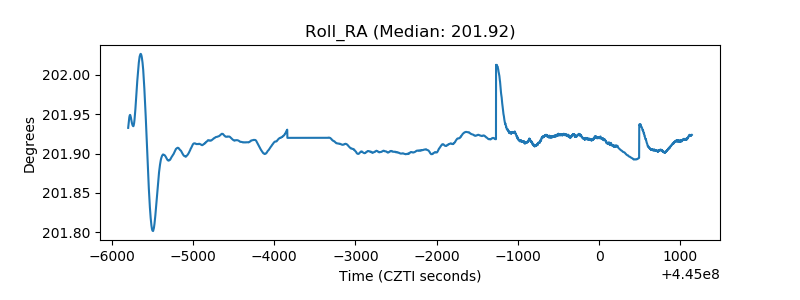 |
| Veto Counter | 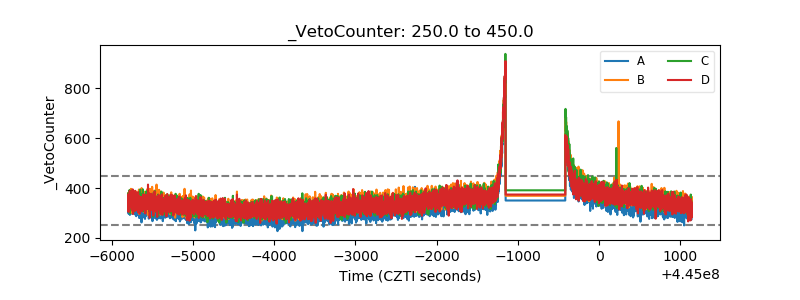 |