| Param | Original file | Final file |
|---|---|---|
| Filename | modeM0/AS1A13_049T07_9000006056_45399cztM0_level2.fits | modeM0/AS1A13_049T07_9000006056_45399cztM0_level2_quad_clean.evt |
| Size (bytes) | 476,161,920 | 94,109,760 |
| Size | 454.1 MB | 89.8 MB |
| Events in quadrant A | 4,936,957 | 640,862 |
| Events in quadrant B | 2,776,773 | 666,237 |
| Events in quadrant C | 2,893,254 | 629,472 |
| Events in quadrant D | 6,561,819 | 501,414 |
| Mode M0 | |||
|---|---|---|---|
| Quadrant | BADHDUFLAG | Total packets | Discarded packets |
| A | 0 | 18906 | 1 |
| B | 0 | 12466 | 1 |
| C | 0 | 12909 | 1 |
| D | 0 | 23605 | 1 |
| Mode M9 | |||
|---|---|---|---|
| Quadrant | BADHDUFLAG | Total packets | Discarded packets |
| A | 0 | 10 | 0 |
| B | 0 | 10 | 0 |
| C | 0 | 10 | 0 |
| D | 0 | 10 | 0 |
| Mode SS | |||
|---|---|---|---|
| Quadrant | BADHDUFLAG | Total packets | Discarded packets |
| A | 0 | 120 | 0 |
| B | 0 | 120 | 0 |
| C | 0 | 120 | 0 |
| D | 0 | 120 | 0 |
| Quadrant | Total seconds | Saturated seconds | Saturation percentage |
|---|---|---|---|
| A | 5887 | 158 | 2.683880% |
| B | 5888 | 61 | 1.036005% |
| C | 5888 | 114 | 1.936141% |
| D | 5888 | 1033 | 17.544158% |
Noise dominated data is calculated using 1-second bins in cleaned event files. If a bin has >2000 counts, and if more than 50% of those come from <1% of pixels, then it is considered to be noise-dominated and hence unusable.
| Quadrant | # 1 sec bins | Bins with >0 counts | Bins with >2000 counts | High rate bins dominated by noise | Noise dominated (total time) | Noise dominated (detector-on time) | Marked lightcurve |
|---|---|---|---|---|---|---|---|
| A | 6937 | 5887 | 16 | 16 | 0.23% | 0.27% | 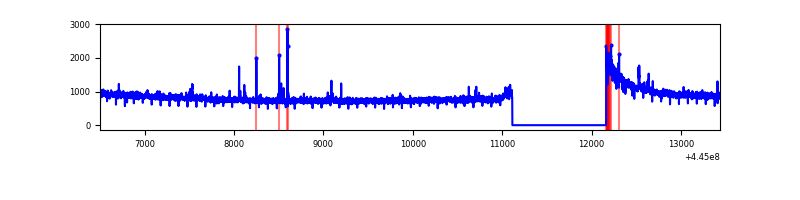 |
| B | 6938 | 5888 | 3 | 3 | 0.04% | 0.05% | 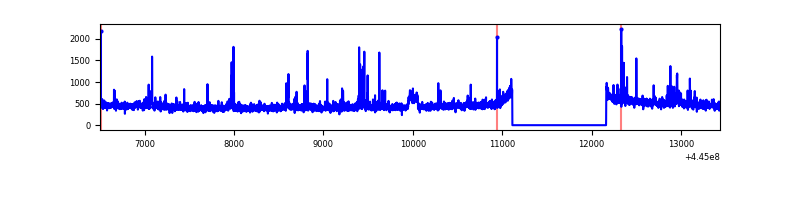 |
| C | 6938 | 5888 | 61 | 61 | 0.88% | 1.04% | 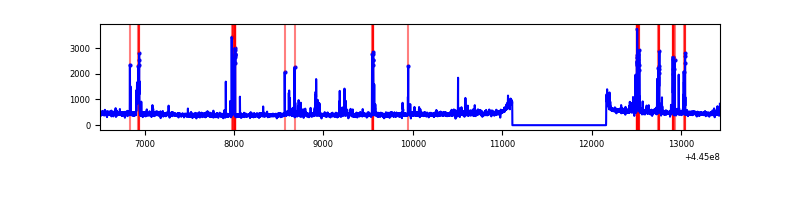 |
| D | 6938 | 5888 | 1004 | 1004 | 14.47% | 17.05% | 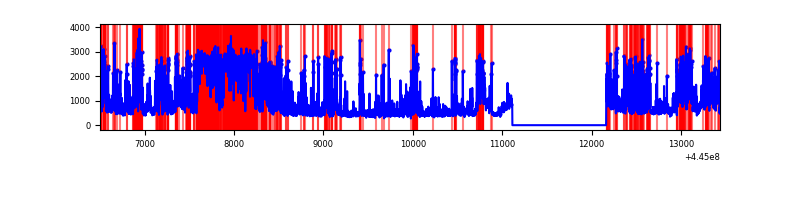 |
Top three noisy pixels from each quadrant. If the there are fewer than three noisy pixels in the level2.evt file, extra rows are filled as -1
| Pixel properties | Quadrant properties | ||||||
|---|---|---|---|---|---|---|---|
| Quadrant | DetID | PixID | Counts | Sigma | Mean | Median | Sigma |
| A | 10 | 83 | 2315232 | 16974.83 | 652 | 638 | 136.4 |
| A | 9 | 191 | 60420 | 438.43 | 652 | 638 | 136.4 |
| A | 13 | 248 | 18774 | 133.01 | 652 | 638 | 136.4 |
| B | 0 | 190 | 42187 | 319.48 | 655 | 635 | 130.1 |
| B | 4 | 67 | 39213 | 296.61 | 655 | 635 | 130.1 |
| B | 0 | 171 | 38366 | 290.1 | 655 | 635 | 130.1 |
| C | 12 | 2 | 107809 | 702.41 | 646 | 648 | 152.6 |
| C | 14 | 254 | 98022 | 638.26 | 646 | 648 | 152.6 |
| C | 0 | 207 | 87530 | 569.49 | 646 | 648 | 152.6 |
| D | 1 | 52 | 1411406 | 9219.31 | 603 | 585 | 153.0 |
| D | 13 | 249 | 1288817 | 8418.22 | 603 | 585 | 153.0 |
| D | 2 | 249 | 1169654 | 7639.53 | 603 | 585 | 153.0 |
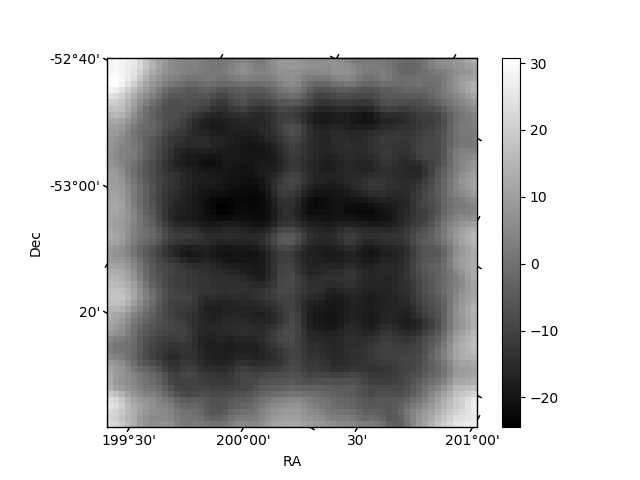
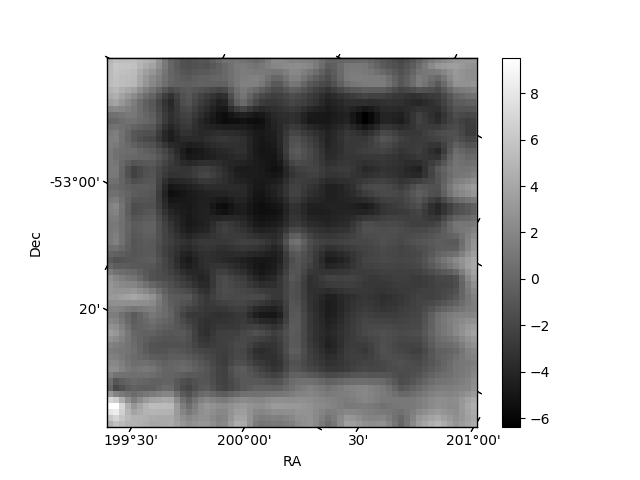
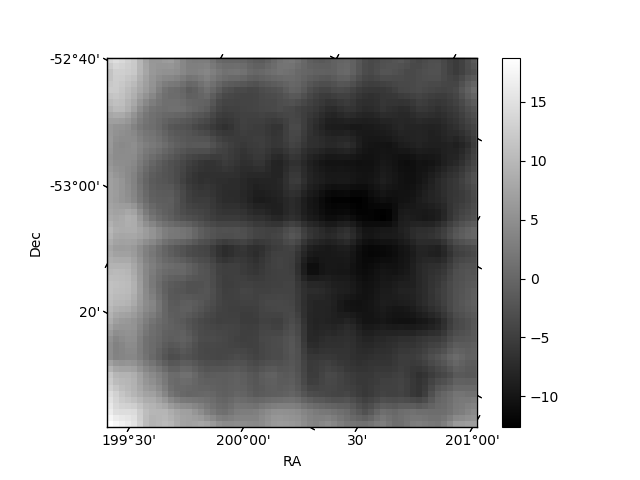
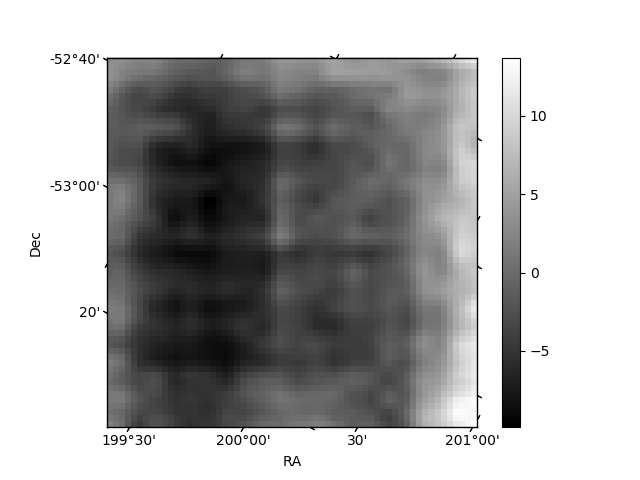
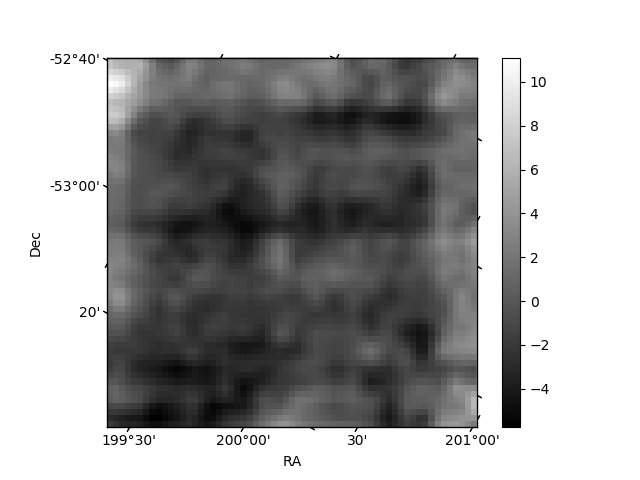
Histogram calculated using DETX and DETY for each event in the final _common_clean file
| Quadrant A | 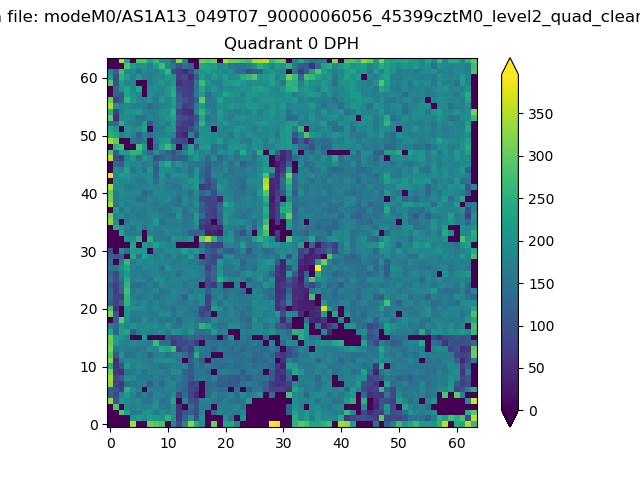 |
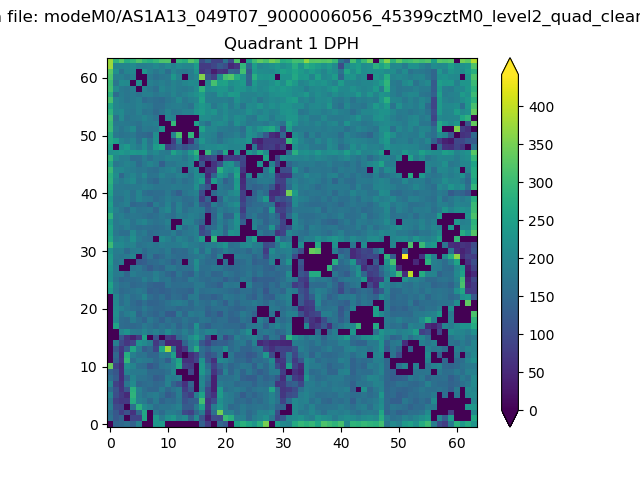 |
Quadrant B |
|---|---|---|---|
| Quadrant D | 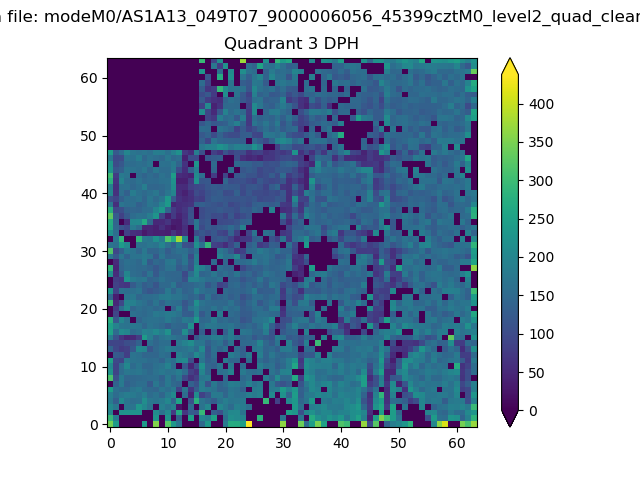 |
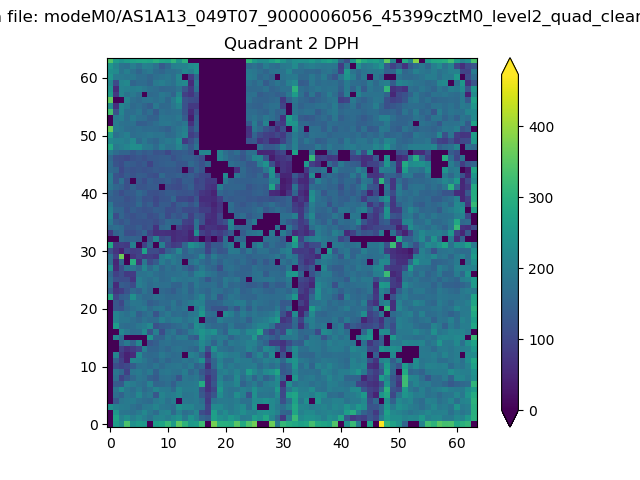 |
Quadrant C |
| Plot type | Count rate plots | Images |
|---|---|---|
| Comparison with Poisson distribution Blue bars denote a histogram of data divided into 1 sec bins. Red curve is a Poisson curve with rate = median count rate of data. |
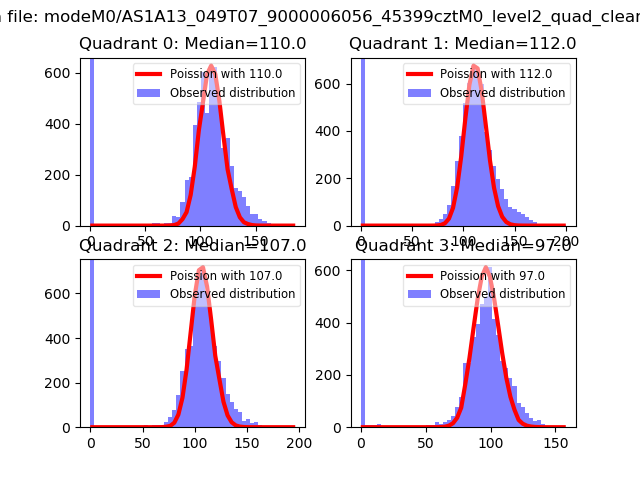 |
 |
| Quadrant-wise count rates Data is divided into 100 sec bins |
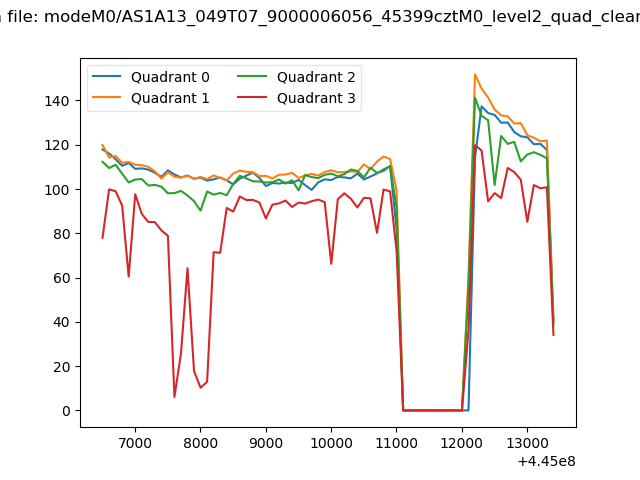 |
|
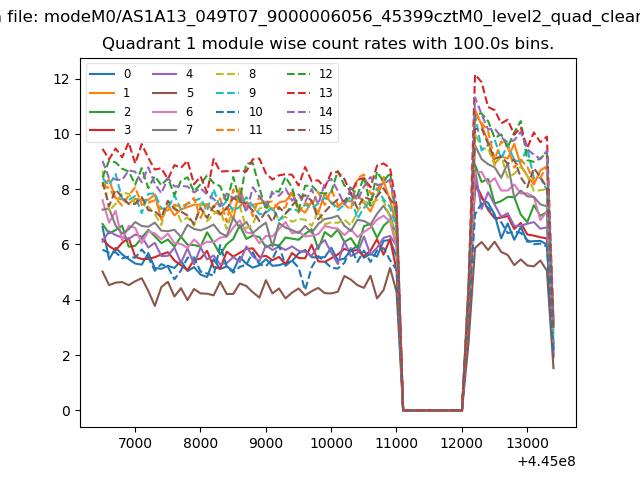
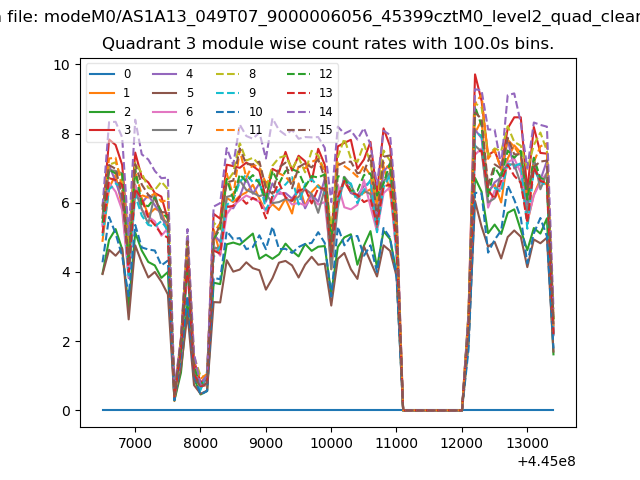
| Module-wise count rates for Quadrant A Data is divided into 100 sec bins |
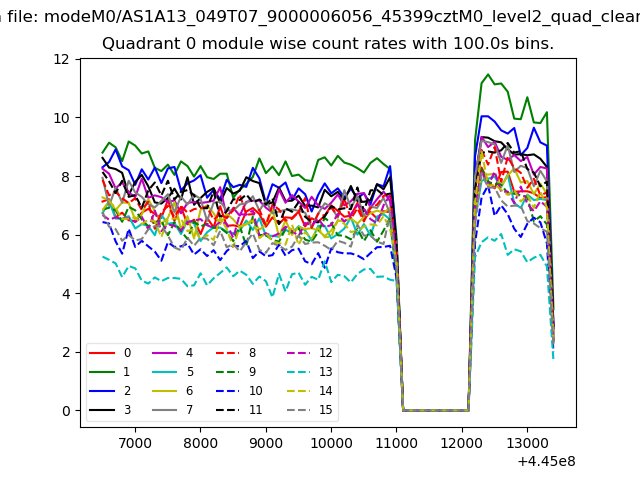 |
 |
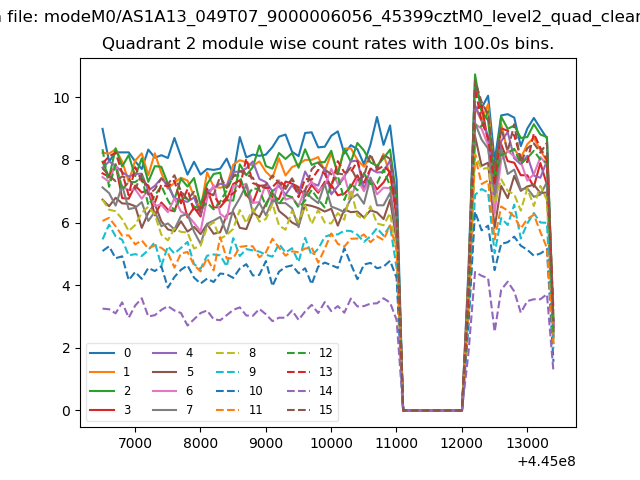
| Module-wise count rates for Quadrant B Data is divided into 100 sec bins |
 |
 |
| Module-wise count rates for Quadrant C Data is divided into 100 sec bins |
 |
 |
| Module-wise count rates for Quadrant D Data is divided into 100 sec bins |
 |
 |
| Parameter | Plot |
|---|---|
| CZT HV Monitor | 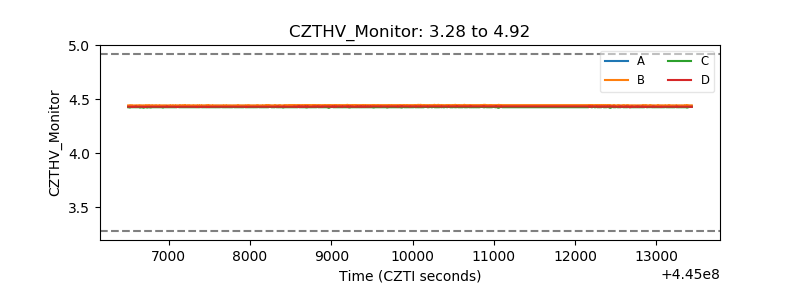 |
| D_VDD | 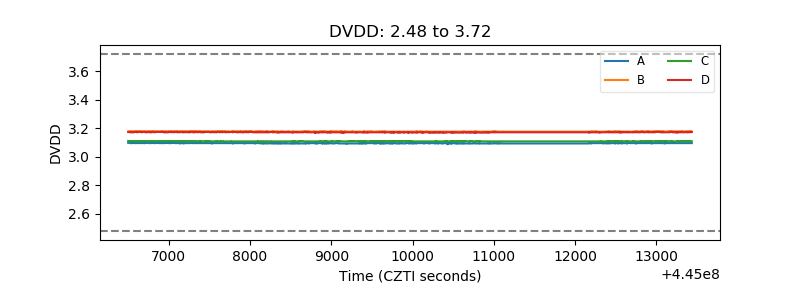 |
| Temperature 1 | 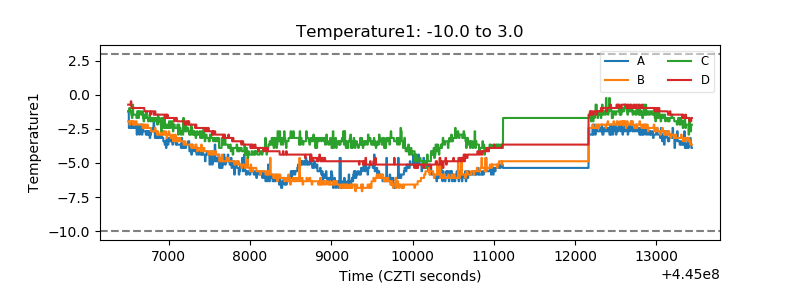 |
| Veto HV Monitor |  |
| Veto LLD | 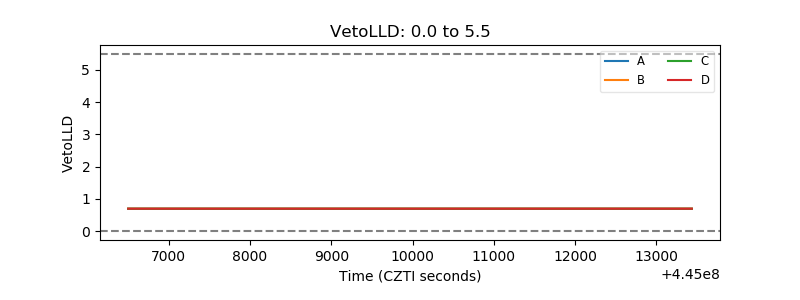 |
| Alpha Counter | 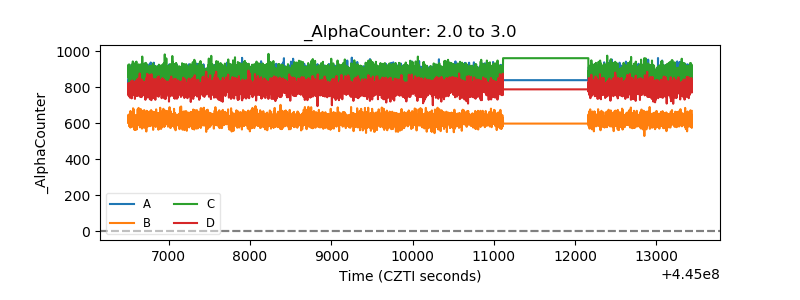 |
| _CPM_Rate | 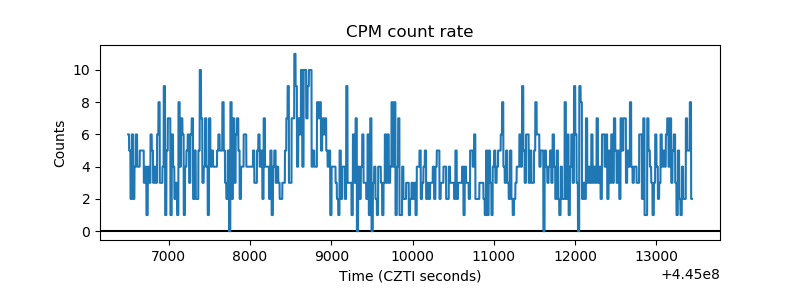 |
| CZT Counter | 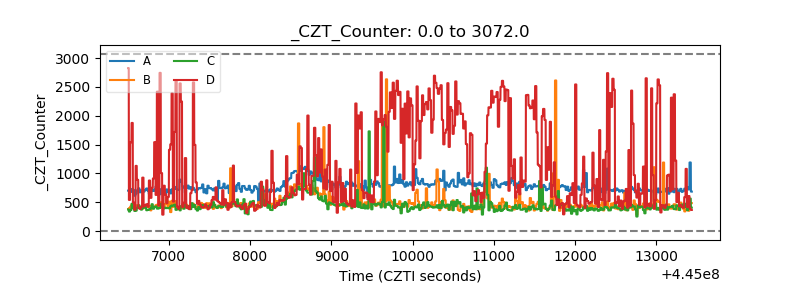 |
| +2.5 Volts monitor | 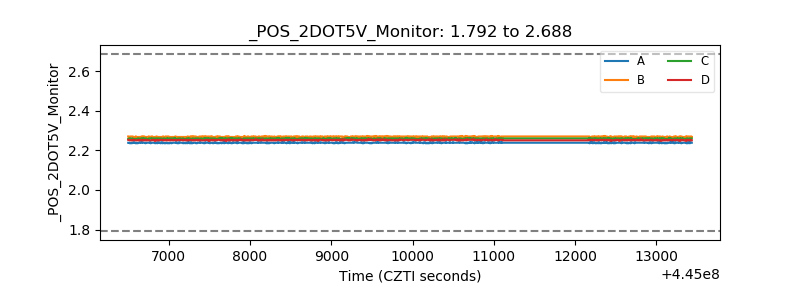 |
| +5 Volts monitor |  |
| _ROLL_ROT | 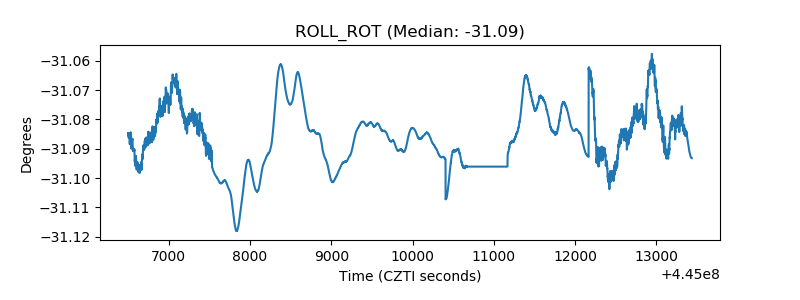 |
| _Roll_DEC | 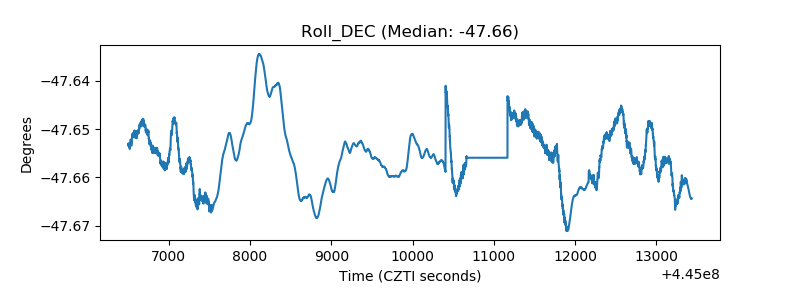 |
| _Roll_RA | 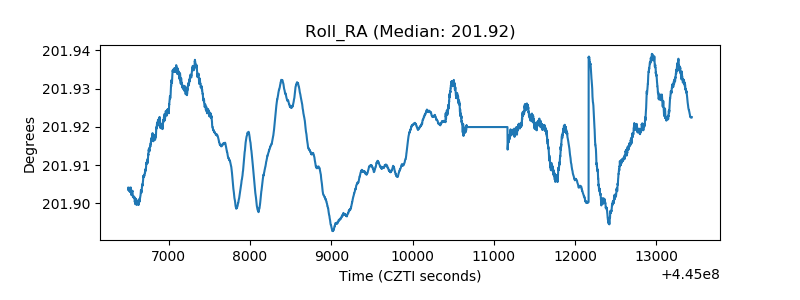 |
| Veto Counter | 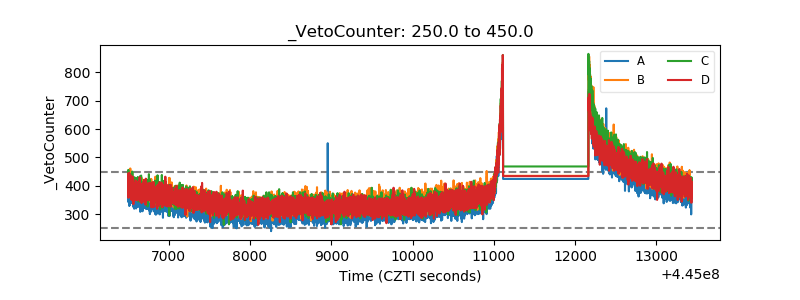 |