| Param | Original file | Final file |
|---|---|---|
| Filename | modeM0/AS1A13_049T07_9000006056_45403cztM0_level2.fits | modeM0/AS1A13_049T07_9000006056_45403cztM0_level2_quad_clean.evt |
| Size (bytes) | 454,069,440 | 108,622,080 |
| Size | 433.0 MB | 103.6 MB |
| Events in quadrant A | 5,322,574 | 724,662 |
| Events in quadrant B | 3,502,110 | 755,662 |
| Events in quadrant C | 2,984,463 | 726,285 |
| Events in quadrant D | 4,505,727 | 639,507 |
| Mode M0 | |||
|---|---|---|---|
| Quadrant | BADHDUFLAG | Total packets | Discarded packets |
| A | 0 | 20677 | 2 |
| B | 0 | 14804 | 2 |
| C | 0 | 13432 | 2 |
| D | 0 | 17845 | 2 |
| Mode M9 | |||
|---|---|---|---|
| Quadrant | BADHDUFLAG | Total packets | Discarded packets |
| A | 0 | 21 | 0 |
| B | 0 | 21 | 0 |
| C | 0 | 22 | 0 |
| D | 0 | 22 | 0 |
| Mode SS | |||
|---|---|---|---|
| Quadrant | BADHDUFLAG | Total packets | Discarded packets |
| A | 0 | 128 | 0 |
| B | 0 | 128 | 0 |
| C | 0 | 128 | 0 |
| D | 0 | 128 | 0 |
| Quadrant | Total seconds | Saturated seconds | Saturation percentage |
|---|---|---|---|
| A | 6352 | 156 | 2.455919% |
| B | 6352 | 121 | 1.904912% |
| C | 6352 | 33 | 0.519521% |
| D | 6352 | 246 | 3.872796% |
Noise dominated data is calculated using 1-second bins in cleaned event files. If a bin has >2000 counts, and if more than 50% of those come from <1% of pixels, then it is considered to be noise-dominated and hence unusable.
| Quadrant | # 1 sec bins | Bins with >0 counts | Bins with >2000 counts | High rate bins dominated by noise | Noise dominated (total time) | Noise dominated (detector-on time) | Marked lightcurve |
|---|---|---|---|---|---|---|---|
| A | 7522 | 6352 | 35 | 35 | 0.47% | 0.55% | 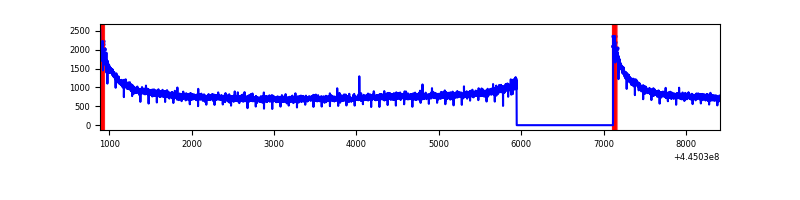 |
| B | 7522 | 6353 | 77 | 77 | 1.02% | 1.21% | 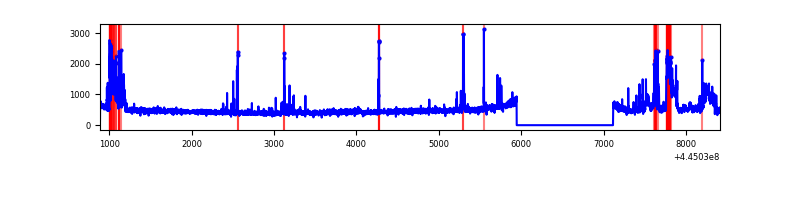 |
| C | 7522 | 6353 | 25 | 25 | 0.33% | 0.39% |  |
| D | 7522 | 6353 | 303 | 303 | 4.03% | 4.77% | 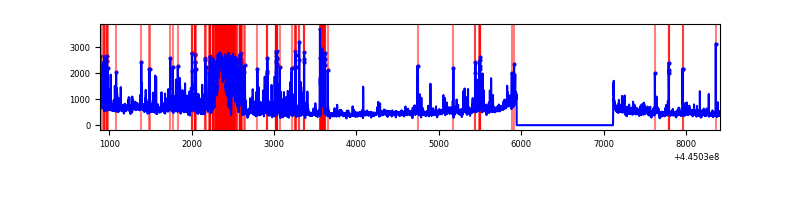 |
Top three noisy pixels from each quadrant. If the there are fewer than three noisy pixels in the level2.evt file, extra rows are filled as -1
| Pixel properties | Quadrant properties | ||||||
|---|---|---|---|---|---|---|---|
| Quadrant | DetID | PixID | Counts | Sigma | Mean | Median | Sigma |
| A | 10 | 83 | 2548478 | 17245.97 | 716 | 702 | 147.7 |
| A | 3 | 137 | 8036 | 49.64 | 716 | 702 | 147.7 |
| A | 13 | 254 | 7899 | 48.71 | 716 | 702 | 147.7 |
| B | 15 | 201 | 511070 | 3619.44 | 722 | 700 | 141.0 |
| B | 0 | 199 | 27607 | 190.82 | 722 | 700 | 141.0 |
| B | 5 | 255 | 23176 | 159.4 | 722 | 700 | 141.0 |
| C | 6 | 247 | 78650 | 462.11 | 714 | 718 | 168.6 |
| C | 11 | 16 | 35240 | 204.7 | 714 | 718 | 168.6 |
| C | 14 | 96 | 32431 | 188.05 | 714 | 718 | 168.6 |
| D | 13 | 249 | 619688 | 3550.86 | 695 | 673 | 174.3 |
| D | 1 | 52 | 400942 | 2296.07 | 695 | 673 | 174.3 |
| D | 11 | 241 | 372177 | 2131.06 | 695 | 673 | 174.3 |
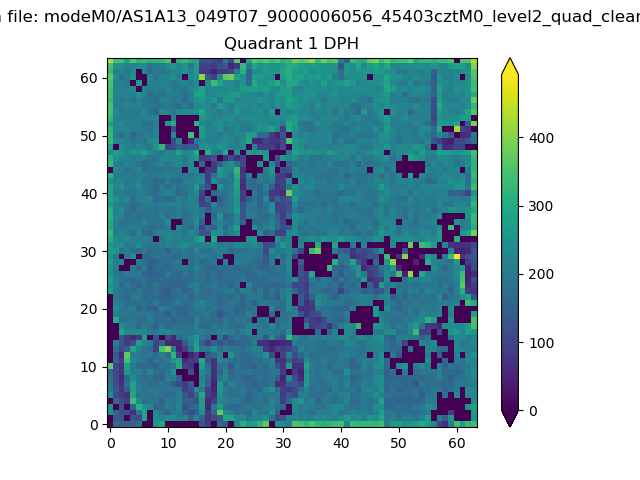
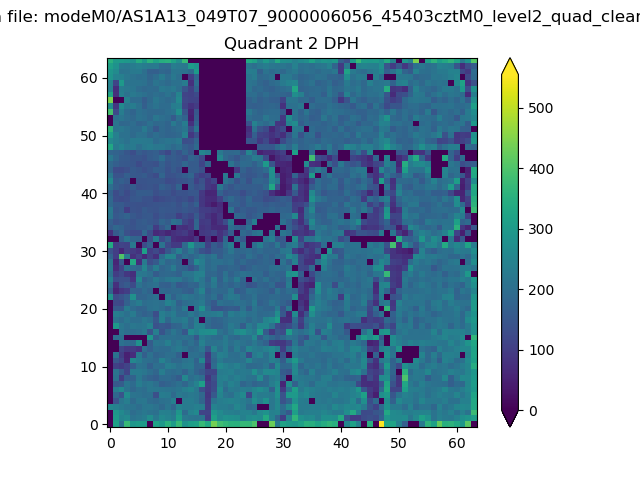
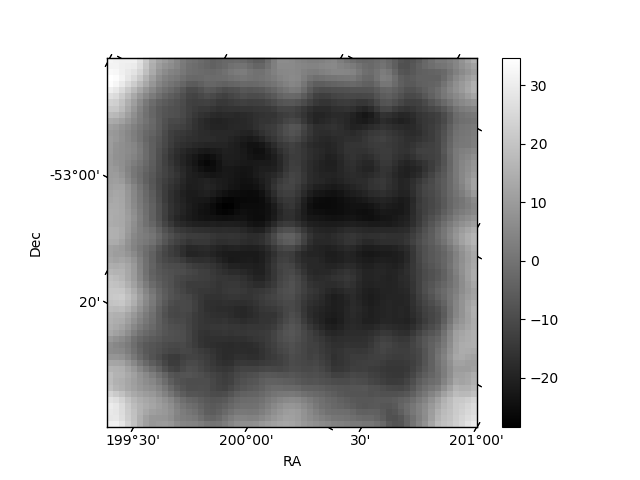
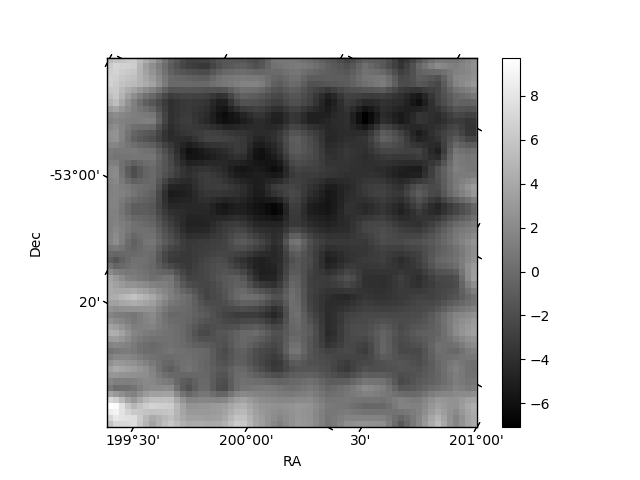
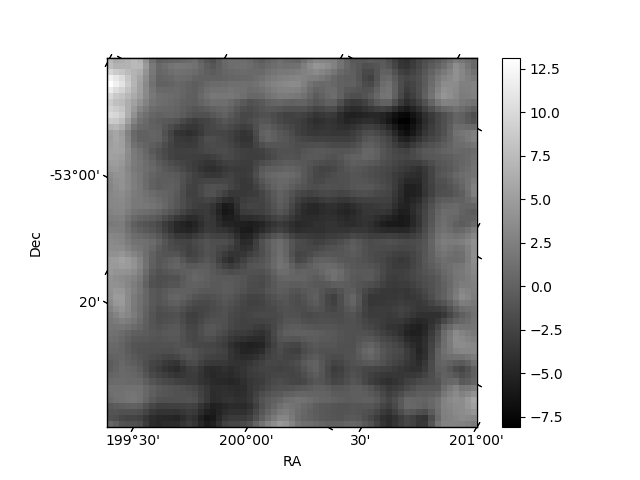
Histogram calculated using DETX and DETY for each event in the final _common_clean file
| Quadrant A | 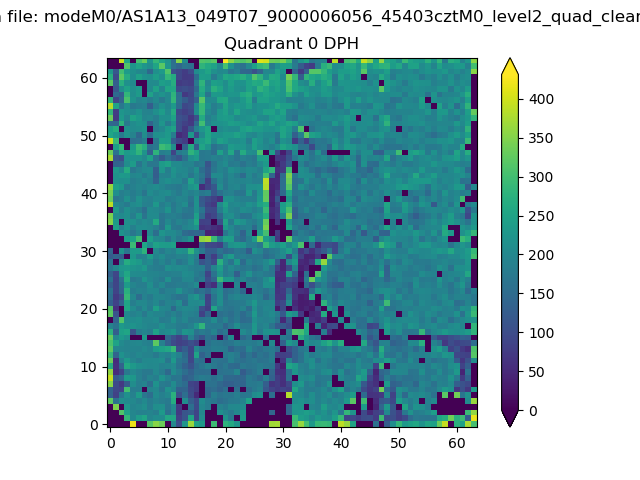 |
 |
Quadrant B |
|---|---|---|---|
| Quadrant D | 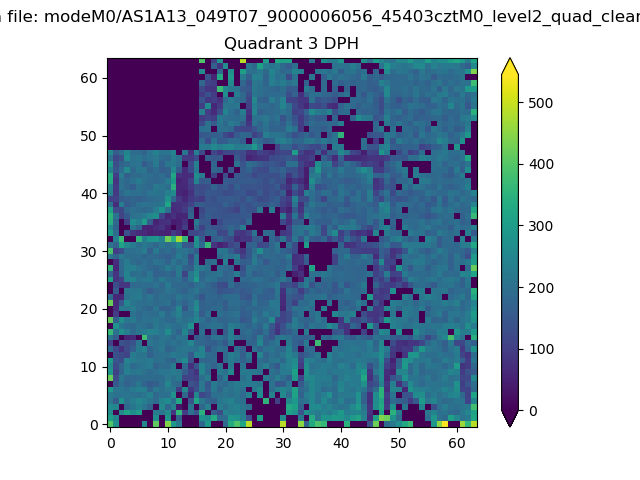 |
 |
Quadrant C |
| Plot type | Count rate plots | Images |
|---|---|---|
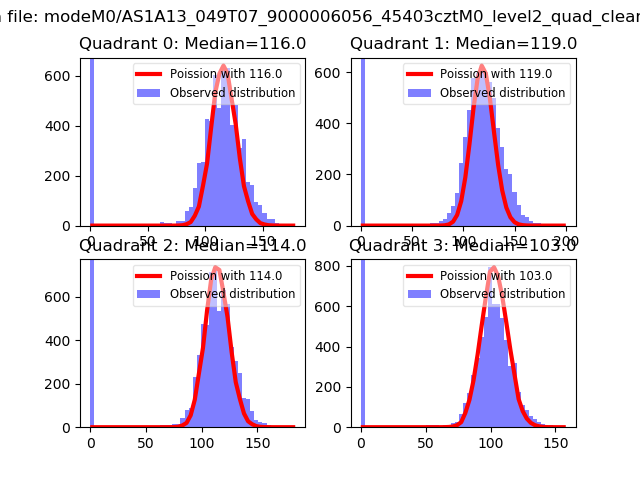
| Comparison with Poisson distribution Blue bars denote a histogram of data divided into 1 sec bins. Red curve is a Poisson curve with rate = median count rate of data. |
 |
 |
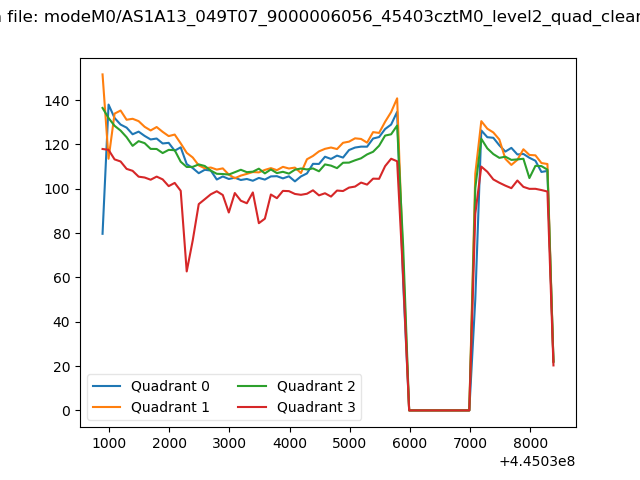
| Quadrant-wise count rates Data is divided into 100 sec bins |
 |
|
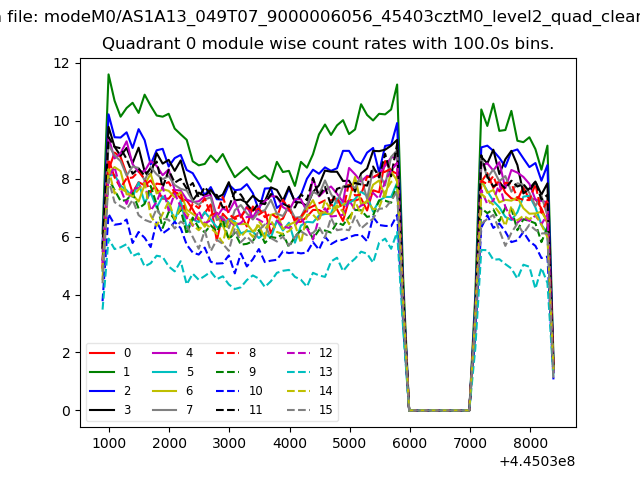
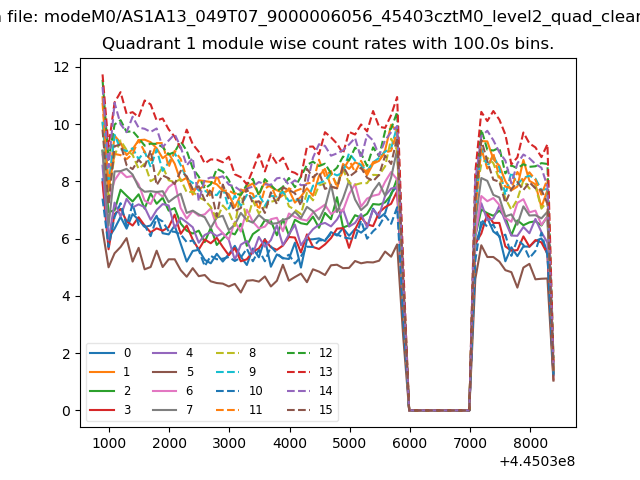
| Module-wise count rates for Quadrant A Data is divided into 100 sec bins |
 |
 |
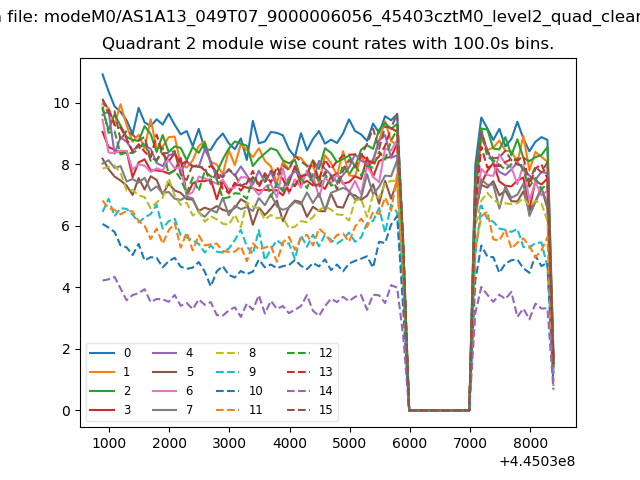
| Module-wise count rates for Quadrant B Data is divided into 100 sec bins |
 |
 |
| Module-wise count rates for Quadrant C Data is divided into 100 sec bins |
 |
 |
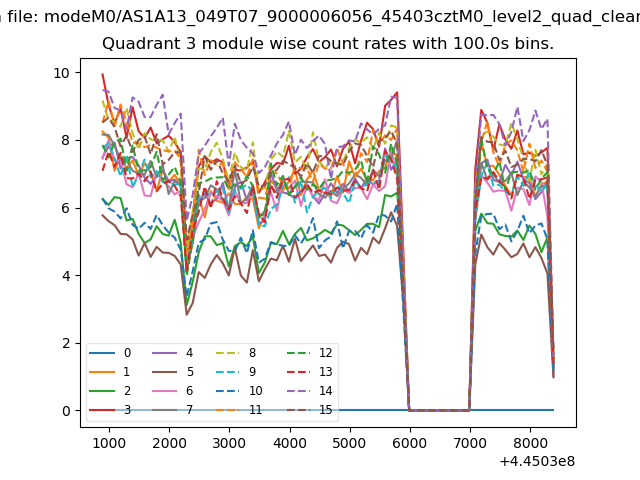
| Module-wise count rates for Quadrant D Data is divided into 100 sec bins |
 |
 |
| Parameter | Plot |
|---|---|
| CZT HV Monitor | 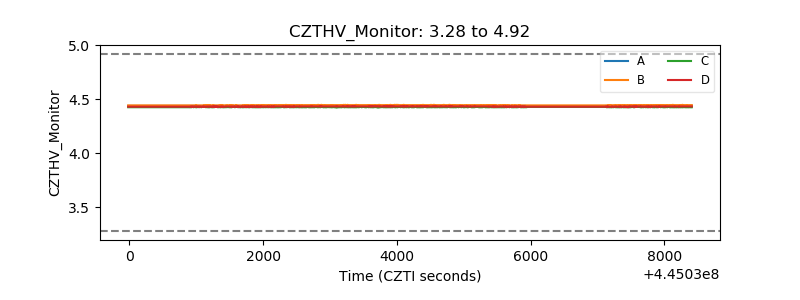 |
| D_VDD | 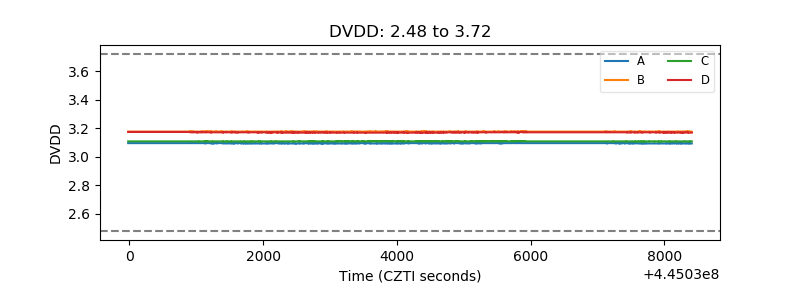 |
| Temperature 1 | 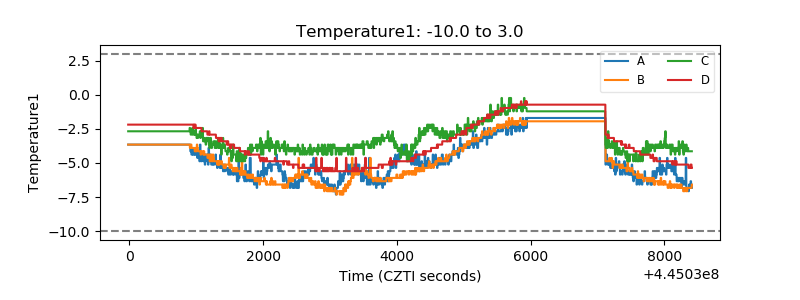 |
| Veto HV Monitor | 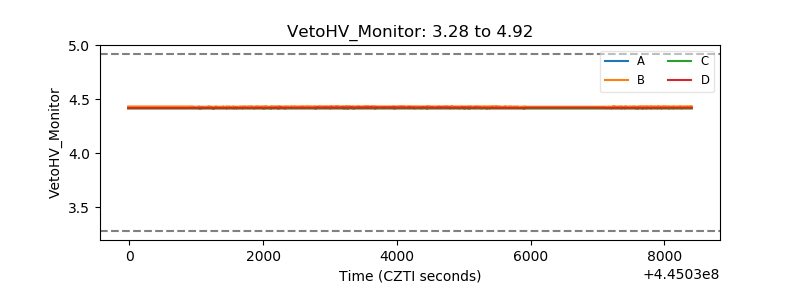 |
| Veto LLD | 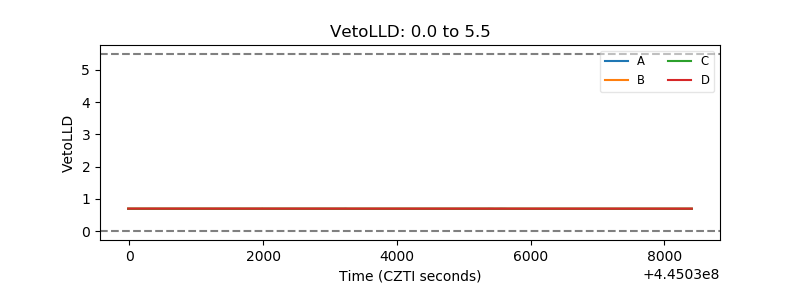 |
| Alpha Counter | 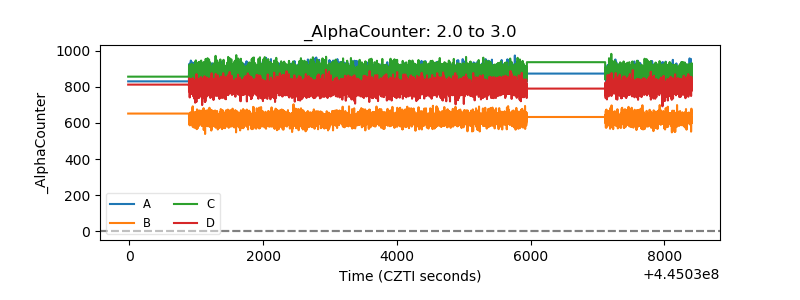 |
| _CPM_Rate | 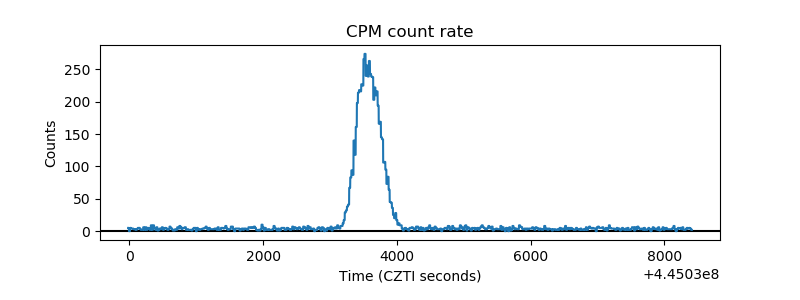 |
| CZT Counter | 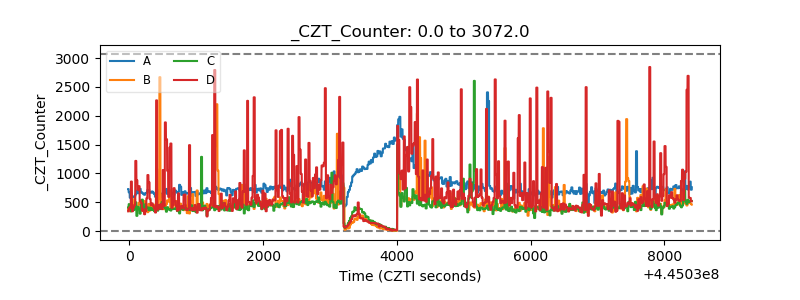 |
| +2.5 Volts monitor | 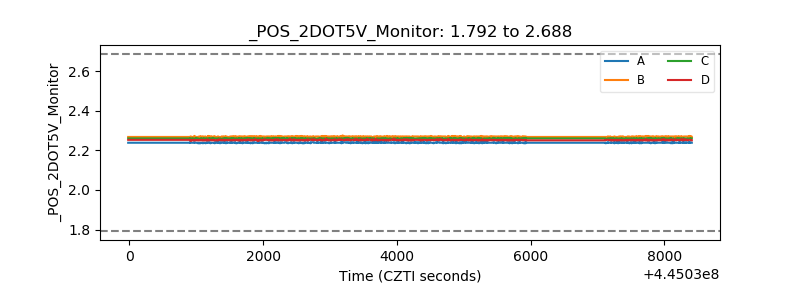 |
| +5 Volts monitor | 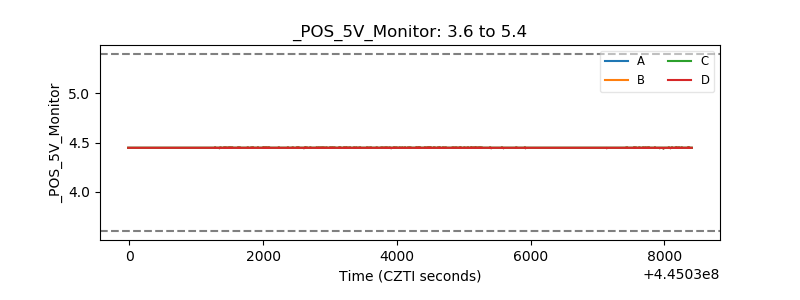 |
| _ROLL_ROT | 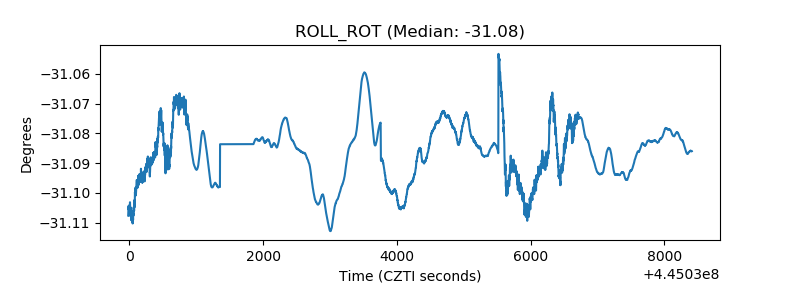 |
| _Roll_DEC | 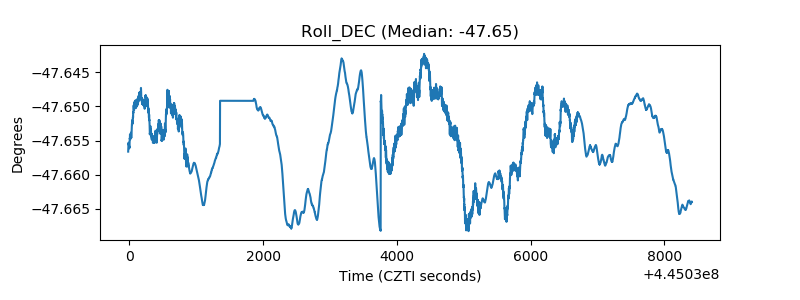 |
| _Roll_RA | 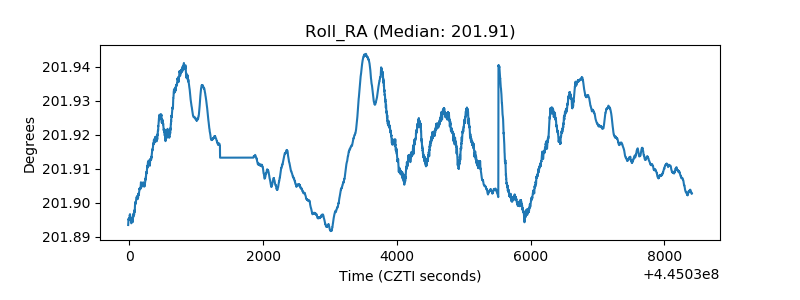 |
| Veto Counter | 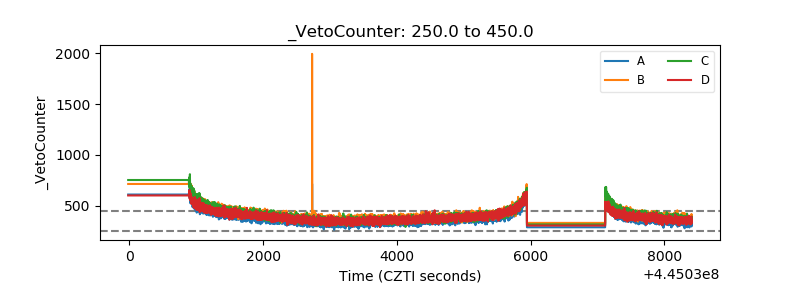 |