| Param | Original file | Final file |
|---|---|---|
| Filename | modeM0/AS1A13_049T07_9000006056_45404cztM0_level2.fits | modeM0/AS1A13_049T07_9000006056_45404cztM0_level2_quad_clean.evt |
| Size (bytes) | 438,068,160 | 112,127,040 |
| Size | 417.8 MB | 106.9 MB |
| Events in quadrant A | 5,555,234 | 741,118 |
| Events in quadrant B | 3,483,968 | 771,245 |
| Events in quadrant C | 3,247,647 | 739,746 |
| Events in quadrant D | 3,403,076 | 671,089 |
| Mode M0 | |||
|---|---|---|---|
| Quadrant | BADHDUFLAG | Total packets | Discarded packets |
| A | 0 | 21729 | 2 |
| B | 0 | 15118 | 2 |
| C | 0 | 14628 | 2 |
| D | 0 | 15008 | 2 |
| Mode M9 | |||
|---|---|---|---|
| Quadrant | BADHDUFLAG | Total packets | Discarded packets |
| A | 0 | 17 | 0 |
| B | 0 | 17 | 0 |
| C | 0 | 18 | 0 |
| D | 0 | 18 | 0 |
| Mode SS | |||
|---|---|---|---|
| Quadrant | BADHDUFLAG | Total packets | Discarded packets |
| A | 0 | 138 | 0 |
| B | 0 | 138 | 0 |
| C | 0 | 138 | 0 |
| D | 0 | 138 | 0 |
| Quadrant | Total seconds | Saturated seconds | Saturation percentage |
|---|---|---|---|
| A | 6771 | 158 | 2.333481% |
| B | 6771 | 79 | 1.166741% |
| C | 6771 | 50 | 0.738443% |
| D | 6771 | 35 | 0.516910% |
Noise dominated data is calculated using 1-second bins in cleaned event files. If a bin has >2000 counts, and if more than 50% of those come from <1% of pixels, then it is considered to be noise-dominated and hence unusable.
| Quadrant | # 1 sec bins | Bins with >0 counts | Bins with >2000 counts | High rate bins dominated by noise | Noise dominated (total time) | Noise dominated (detector-on time) | Marked lightcurve |
|---|---|---|---|---|---|---|---|
| A | 7691 | 6772 | 19 | 19 | 0.25% | 0.28% | 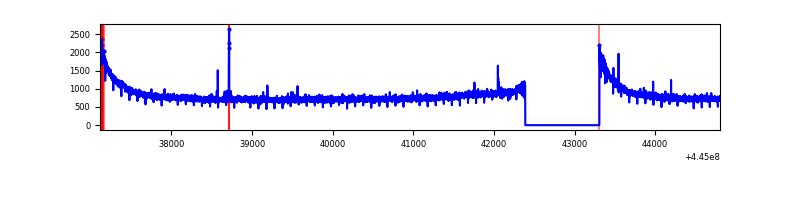 |
| B | 7691 | 6771 | 41 | 41 | 0.53% | 0.61% |  |
| C | 7691 | 6772 | 43 | 43 | 0.56% | 0.63% | 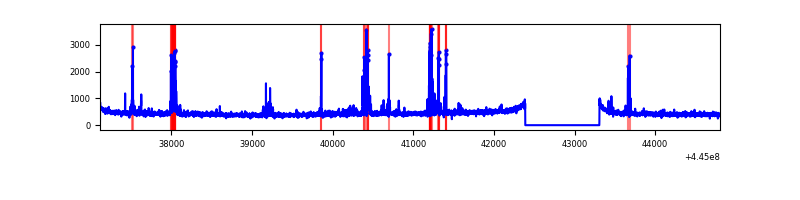 |
| D | 7691 | 6772 | 27 | 27 | 0.35% | 0.40% | 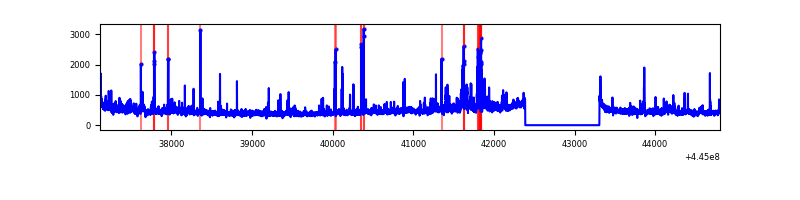 |
Top three noisy pixels from each quadrant. If the there are fewer than three noisy pixels in the level2.evt file, extra rows are filled as -1
| Pixel properties | Quadrant properties | ||||||
|---|---|---|---|---|---|---|---|
| Quadrant | DetID | PixID | Counts | Sigma | Mean | Median | Sigma |
| A | 10 | 83 | 2629767 | 16940.13 | 749 | 732 | 155.2 |
| A | 9 | 191 | 22374 | 139.45 | 749 | 732 | 155.2 |
| A | 3 | 137 | 8628 | 50.87 | 749 | 732 | 155.2 |
| B | 15 | 201 | 392480 | 2679.89 | 754 | 733 | 146.2 |
| B | 5 | 255 | 30533 | 203.86 | 754 | 733 | 146.2 |
| B | 0 | 171 | 28208 | 187.95 | 754 | 733 | 146.2 |
| C | 14 | 96 | 162772 | 921.13 | 744 | 749 | 175.9 |
| C | 6 | 247 | 80529 | 453.56 | 744 | 749 | 175.9 |
| C | 14 | 254 | 42704 | 238.52 | 744 | 749 | 175.9 |
| D | 11 | 241 | 203907 | 1106.25 | 730 | 708 | 183.7 |
| D | 1 | 52 | 121270 | 656.36 | 730 | 708 | 183.7 |
| D | 5 | 222 | 99622 | 538.5 | 730 | 708 | 183.7 |
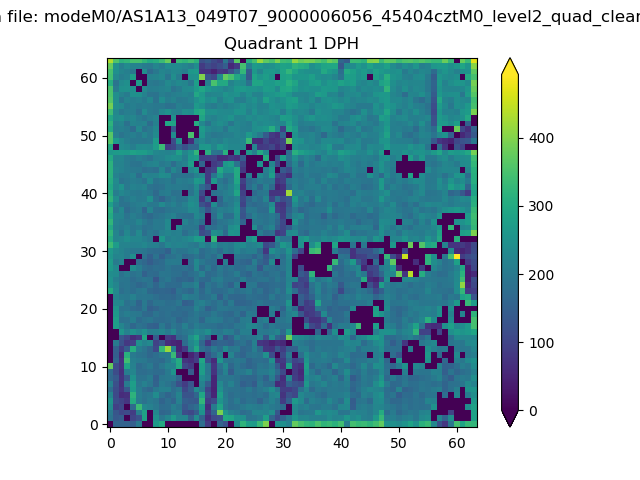
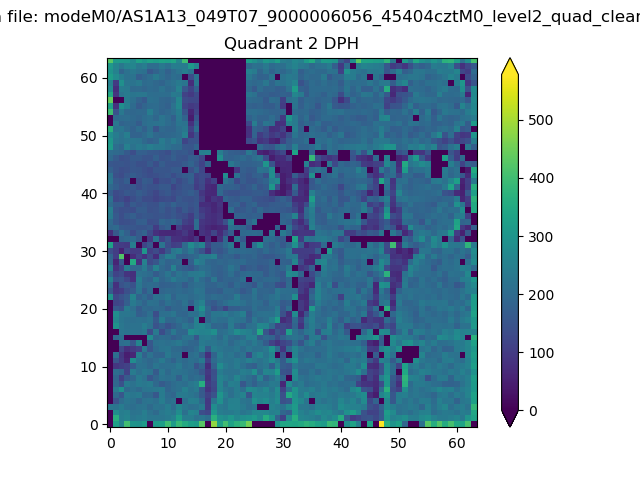
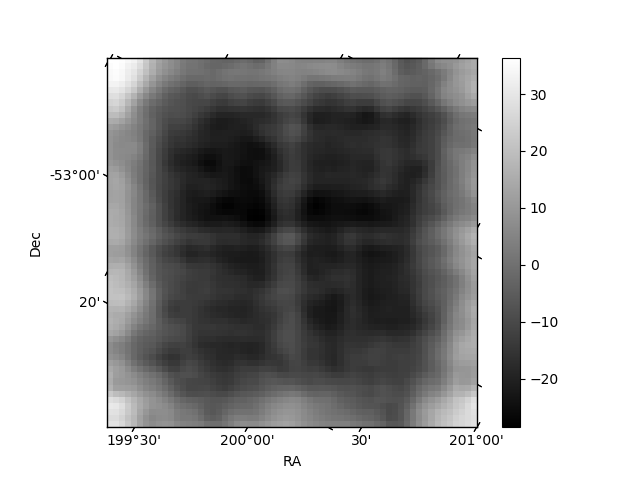
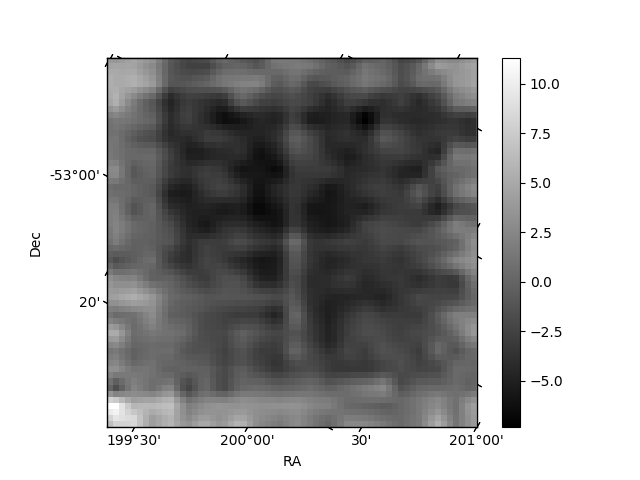
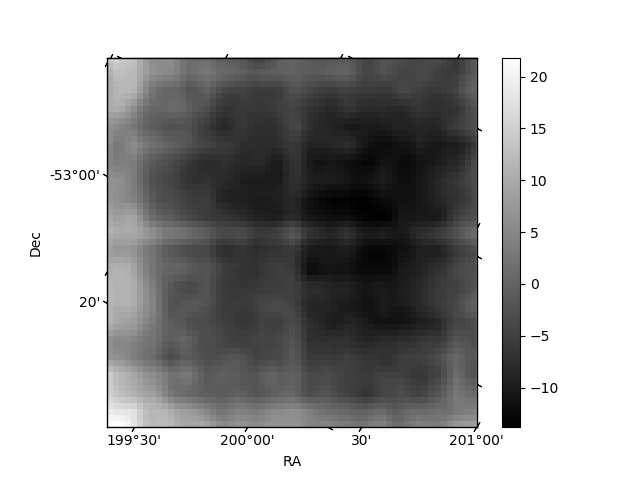
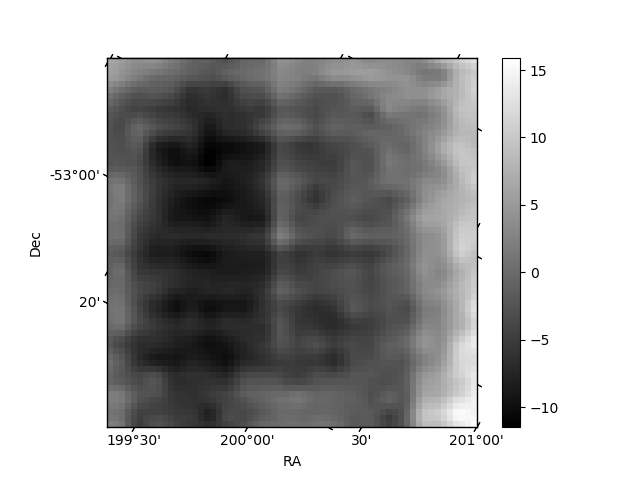
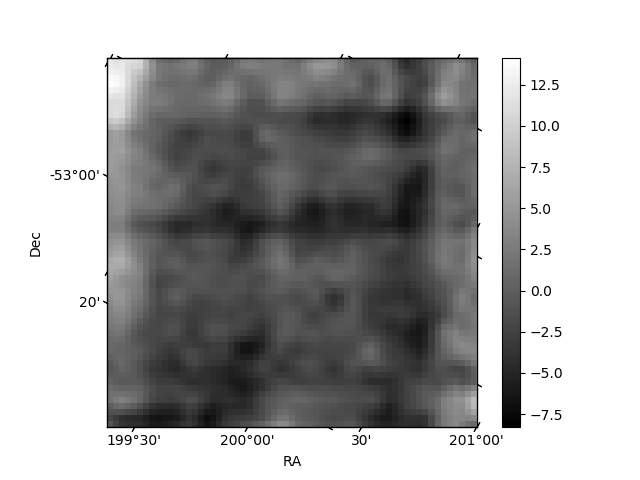
Histogram calculated using DETX and DETY for each event in the final _common_clean file
| Quadrant A | 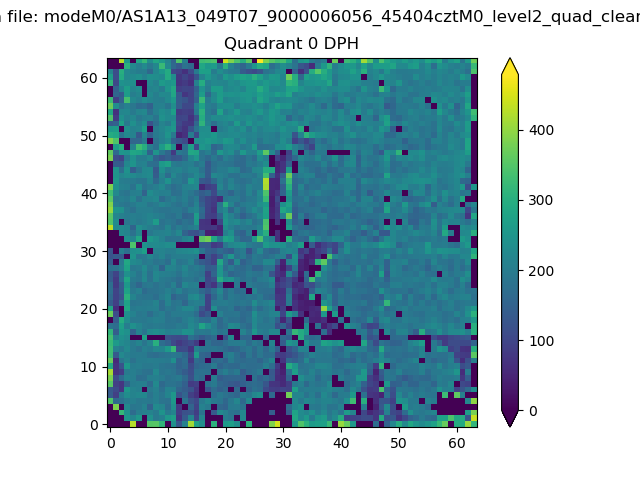 |
 |
Quadrant B |
|---|---|---|---|
| Quadrant D | 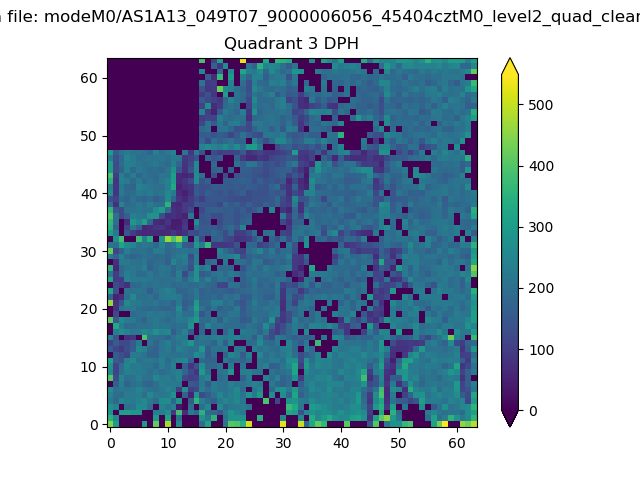 |
 |
Quadrant C |
| Plot type | Count rate plots | Images |
|---|---|---|
| Comparison with Poisson distribution Blue bars denote a histogram of data divided into 1 sec bins. Red curve is a Poisson curve with rate = median count rate of data. |
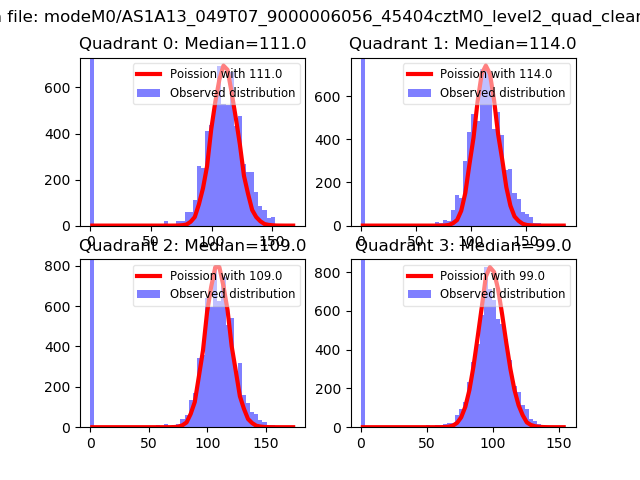 |
 |
| Quadrant-wise count rates Data is divided into 100 sec bins |
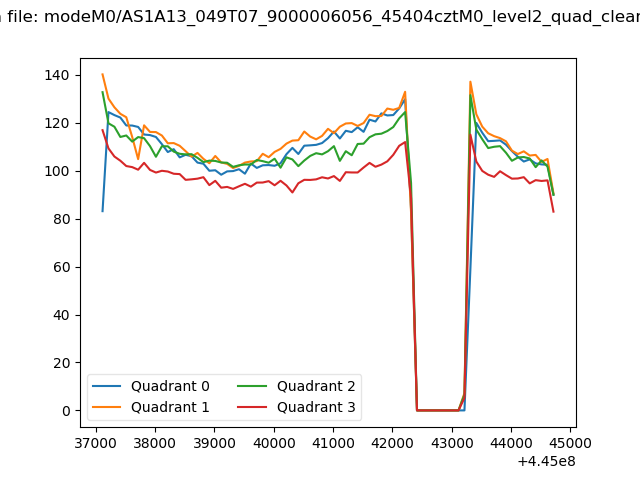 |
|
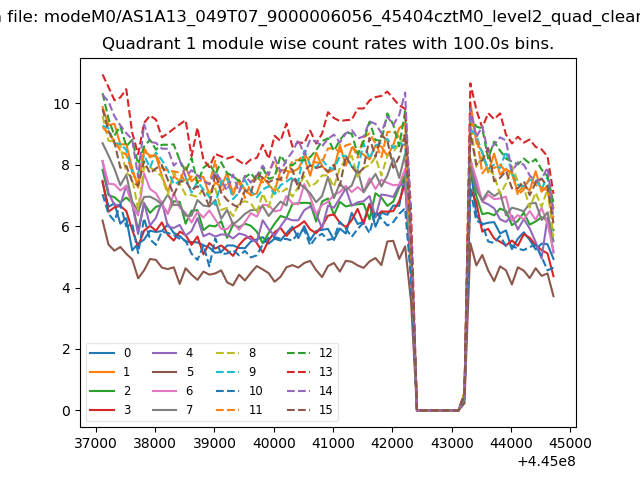
| Module-wise count rates for Quadrant A Data is divided into 100 sec bins |
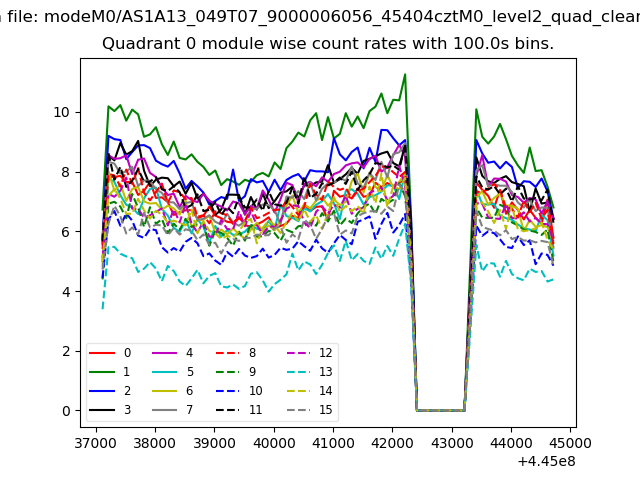 |
 |
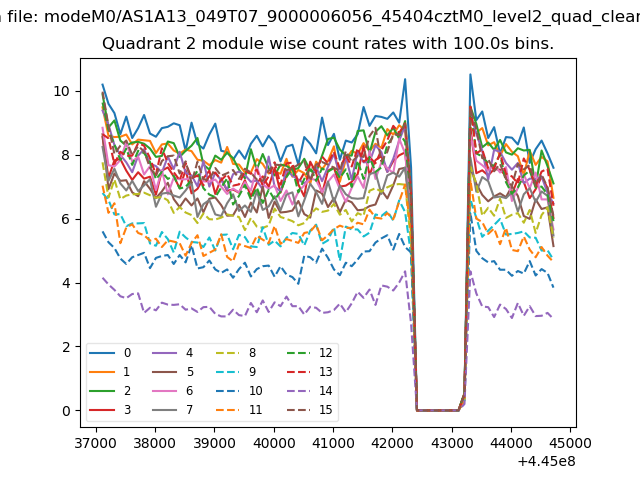
| Module-wise count rates for Quadrant B Data is divided into 100 sec bins |
 |
 |
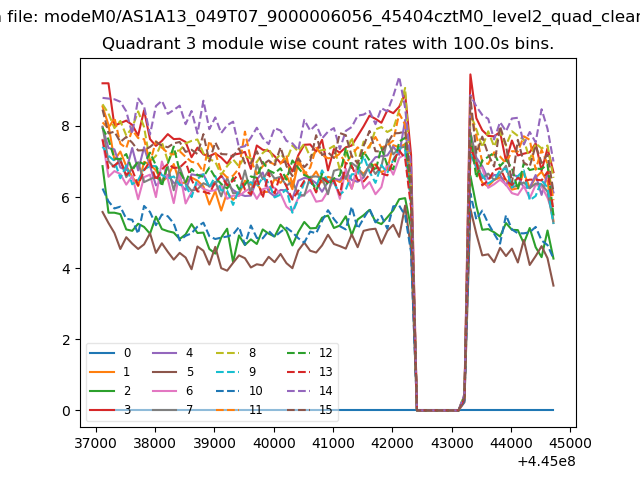
| Module-wise count rates for Quadrant C Data is divided into 100 sec bins |
 |
 |
| Module-wise count rates for Quadrant D Data is divided into 100 sec bins |
 |
 |
| Parameter | Plot |
|---|---|
| CZT HV Monitor | 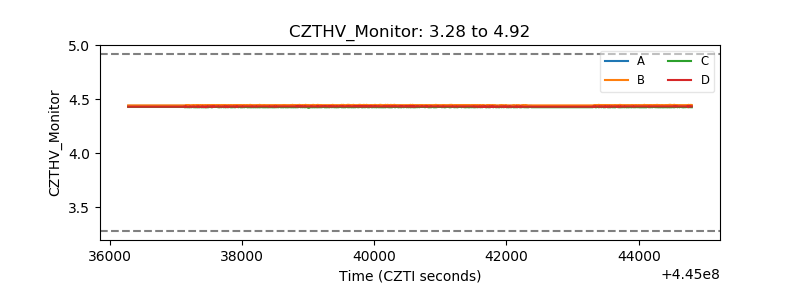 |
| D_VDD | 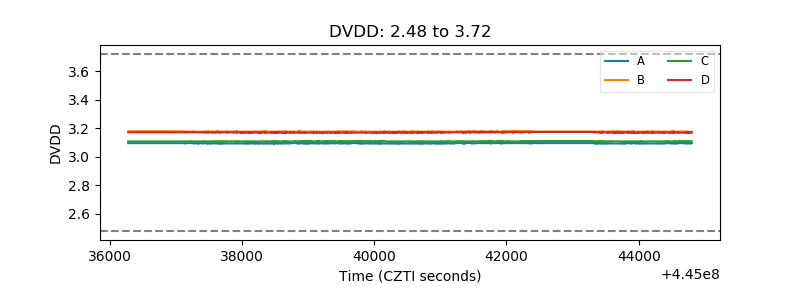 |
| Temperature 1 |  |
| Veto HV Monitor | 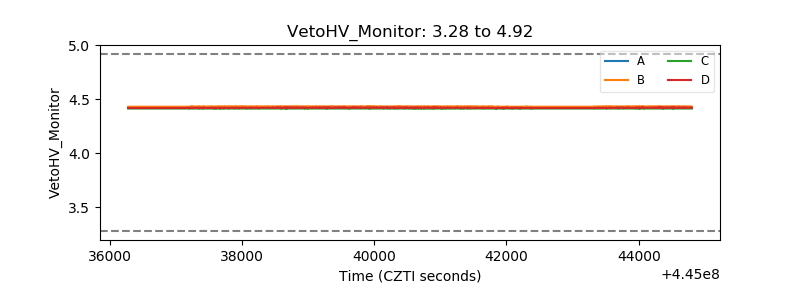 |
| Veto LLD | 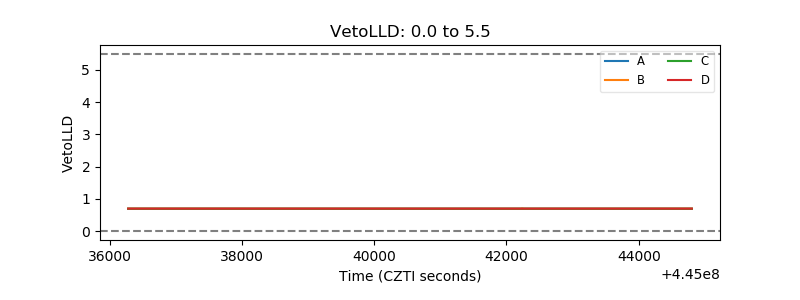 |
| Alpha Counter | 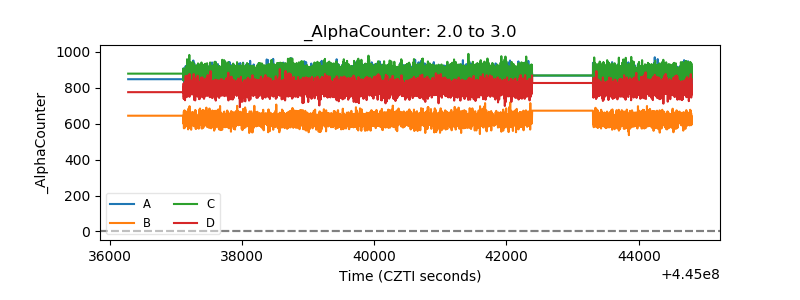 |
| _CPM_Rate | 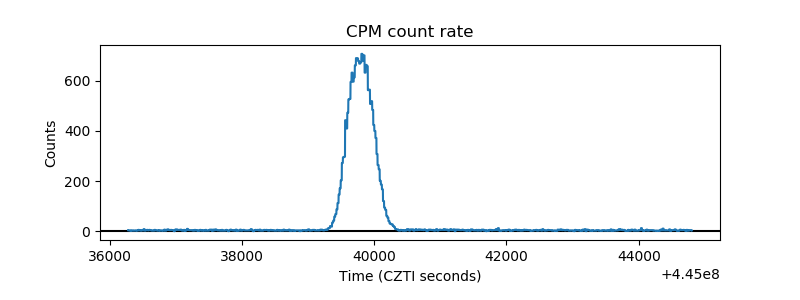 |
| CZT Counter | 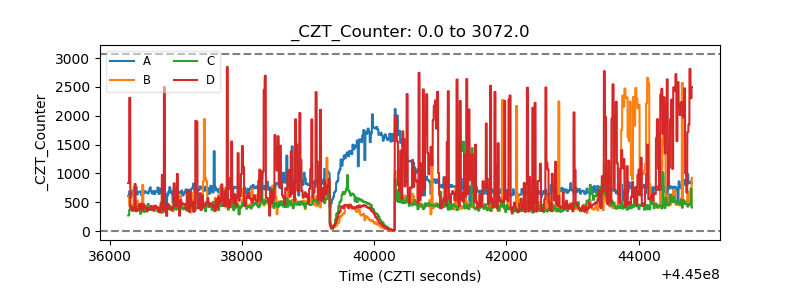 |
| +2.5 Volts monitor | 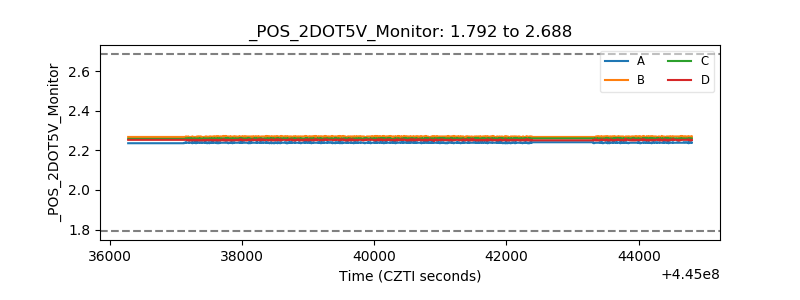 |
| +5 Volts monitor | 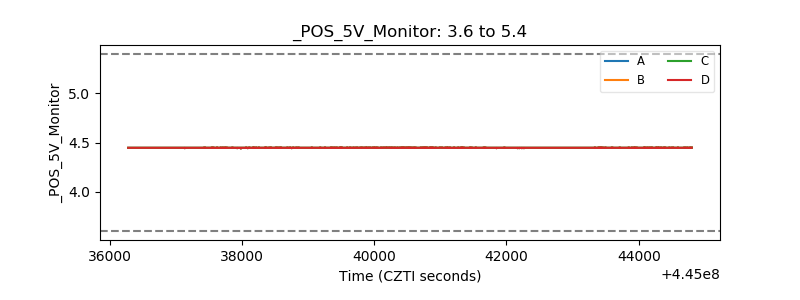 |
| _ROLL_ROT | 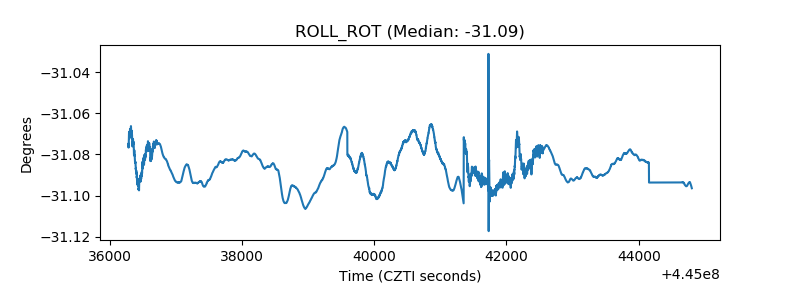 |
| _Roll_DEC | 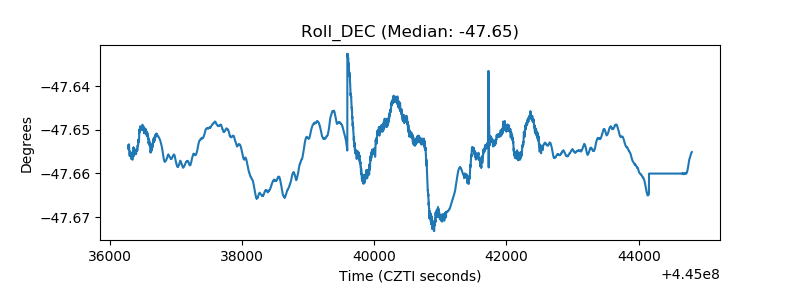 |
| _Roll_RA | 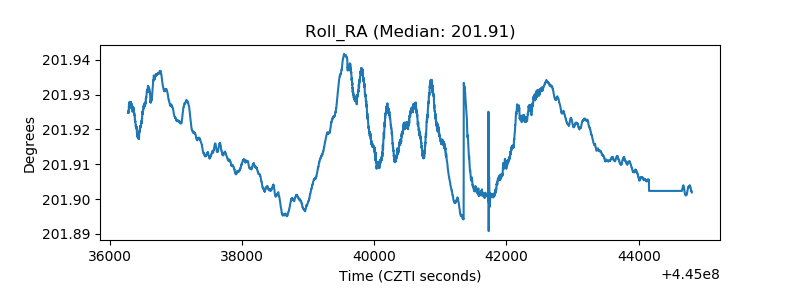 |
| Veto Counter | 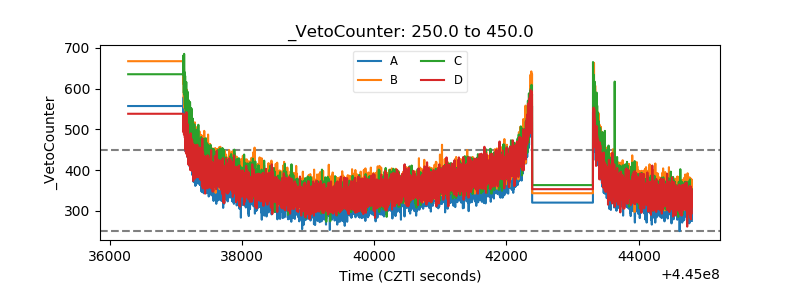 |