| Param | Original file | Final file |
|---|---|---|
| Filename | modeM0/AS1A13_049T07_9000006056_45405cztM0_level2.fits | modeM0/AS1A13_049T07_9000006056_45405cztM0_level2_quad_clean.evt |
| Size (bytes) | 453,864,960 | 115,963,200 |
| Size | 432.8 MB | 110.6 MB |
| Events in quadrant A | 5,798,836 | 764,565 |
| Events in quadrant B | 3,225,299 | 796,261 |
| Events in quadrant C | 3,171,083 | 764,458 |
| Events in quadrant D | 4,049,789 | 687,746 |
| Mode M0 | |||
|---|---|---|---|
| Quadrant | BADHDUFLAG | Total packets | Discarded packets |
| A | 0 | 22366 | 2 |
| B | 0 | 14722 | 2 |
| C | 0 | 14815 | 2 |
| D | 0 | 17128 | 2 |
| Mode M9 | |||
|---|---|---|---|
| Quadrant | BADHDUFLAG | Total packets | Discarded packets |
| A | 0 | 5 | 0 |
| B | 0 | 5 | 0 |
| C | 0 | 5 | 0 |
| D | 0 | 5 | 0 |
| Mode SS | |||
|---|---|---|---|
| Quadrant | BADHDUFLAG | Total packets | Discarded packets |
| A | 0 | 146 | 0 |
| B | 0 | 146 | 0 |
| C | 0 | 146 | 0 |
| D | 0 | 146 | 0 |
| Quadrant | Total seconds | Saturated seconds | Saturation percentage |
|---|---|---|---|
| A | 7153 | 119 | 1.663638% |
| B | 7153 | 29 | 0.405424% |
| C | 7154 | 16 | 0.223651% |
| D | 7154 | 84 | 1.174168% |
Noise dominated data is calculated using 1-second bins in cleaned event files. If a bin has >2000 counts, and if more than 50% of those come from <1% of pixels, then it is considered to be noise-dominated and hence unusable.
| Quadrant | # 1 sec bins | Bins with >0 counts | Bins with >2000 counts | High rate bins dominated by noise | Noise dominated (total time) | Noise dominated (detector-on time) | Marked lightcurve |
|---|---|---|---|---|---|---|---|
| A | 7678 | 7154 | 0 | 0 | 0.00% | 0.00% | 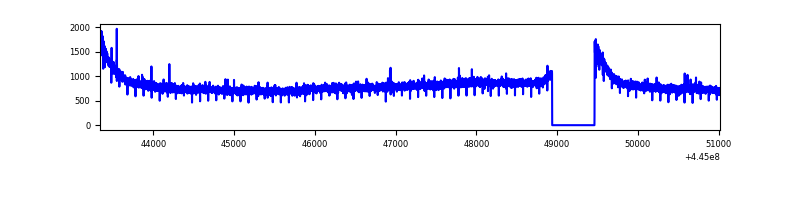 |
| B | 7678 | 7154 | 6 | 6 | 0.08% | 0.08% | 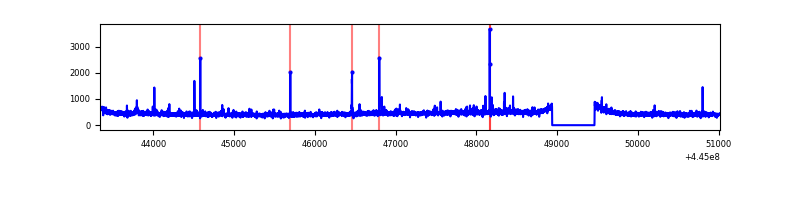 |
| C | 7679 | 7155 | 7 | 7 | 0.09% | 0.10% | 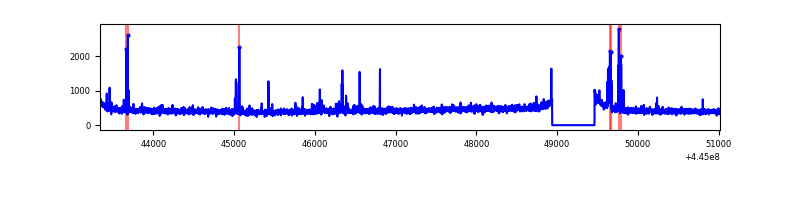 |
| D | 7679 | 7155 | 50 | 50 | 0.65% | 0.70% | 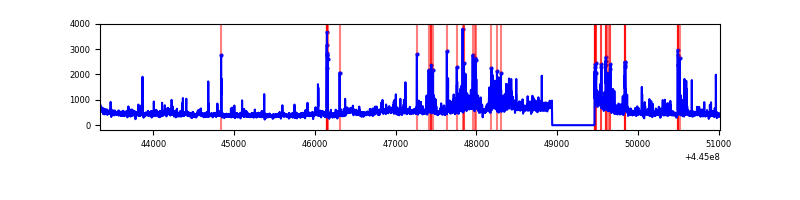 |
Top three noisy pixels from each quadrant. If the there are fewer than three noisy pixels in the level2.evt file, extra rows are filled as -1
| Pixel properties | Quadrant properties | ||||||
|---|---|---|---|---|---|---|---|
| Quadrant | DetID | PixID | Counts | Sigma | Mean | Median | Sigma |
| A | 10 | 83 | 2744129 | 16725.33 | 786 | 768 | 164.0 |
| A | 3 | 137 | 9134 | 51.0 | 786 | 768 | 164.0 |
| A | 0 | 243 | 8542 | 47.4 | 786 | 768 | 164.0 |
| B | 0 | 171 | 37782 | 237.52 | 792 | 766 | 155.8 |
| B | 12 | 111 | 20278 | 125.2 | 792 | 766 | 155.8 |
| B | 11 | 111 | 18374 | 112.98 | 792 | 766 | 155.8 |
| C | 0 | 239 | 37362 | 199.78 | 780 | 784 | 183.1 |
| C | 14 | 254 | 36105 | 192.92 | 780 | 784 | 183.1 |
| C | 14 | 96 | 20859 | 109.65 | 780 | 784 | 183.1 |
| D | 11 | 241 | 447897 | 2349.53 | 764 | 742 | 190.3 |
| D | 5 | 222 | 180654 | 945.33 | 764 | 742 | 190.3 |
| D | 1 | 52 | 157238 | 822.29 | 764 | 742 | 190.3 |
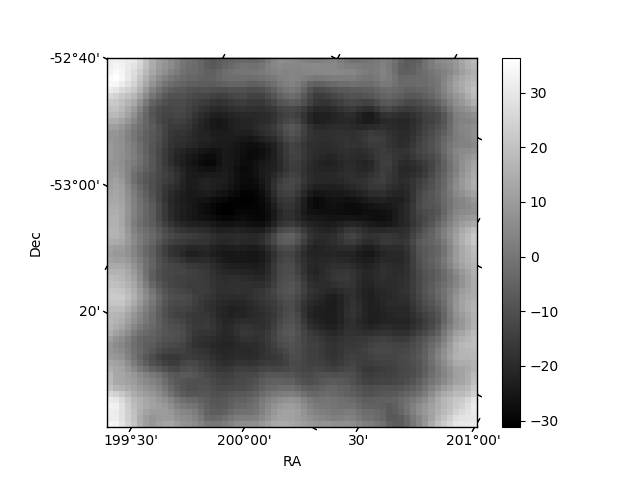
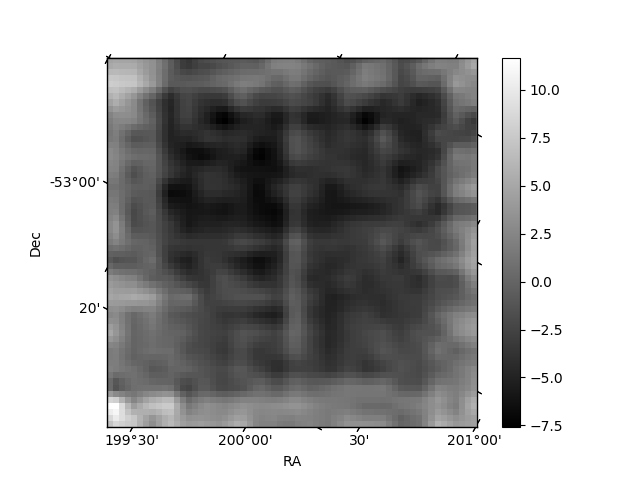
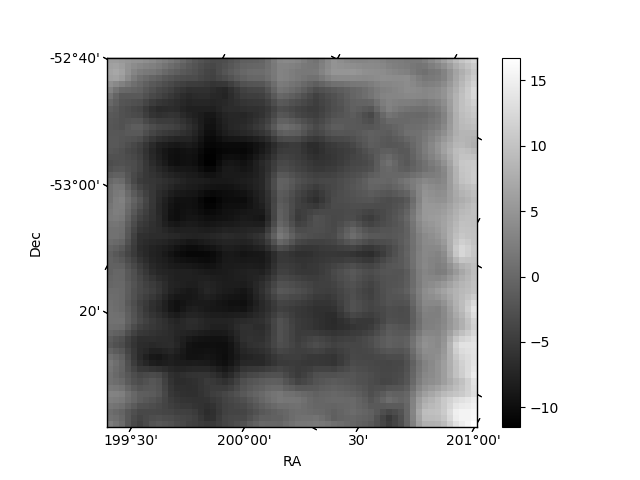
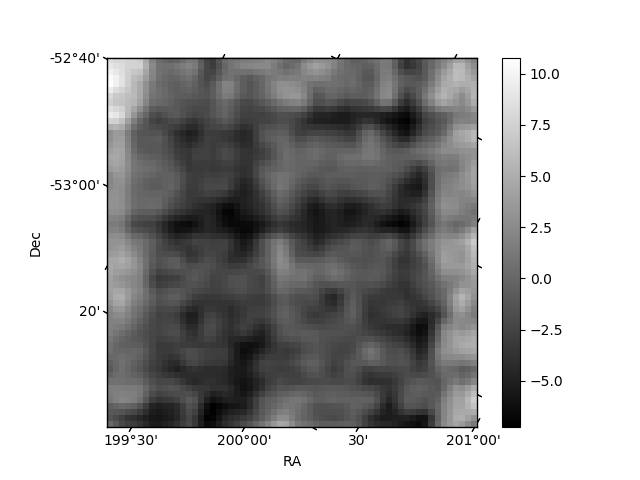
Histogram calculated using DETX and DETY for each event in the final _common_clean file
| Quadrant A | 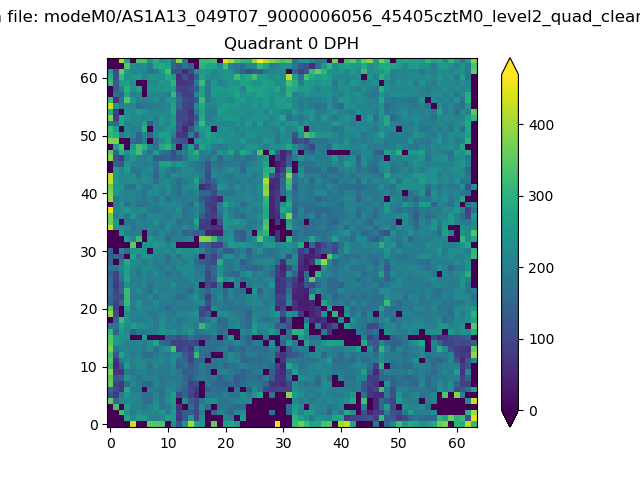 |
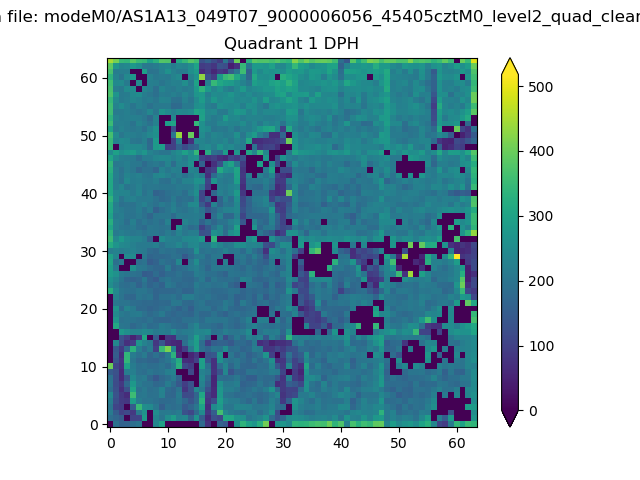 |
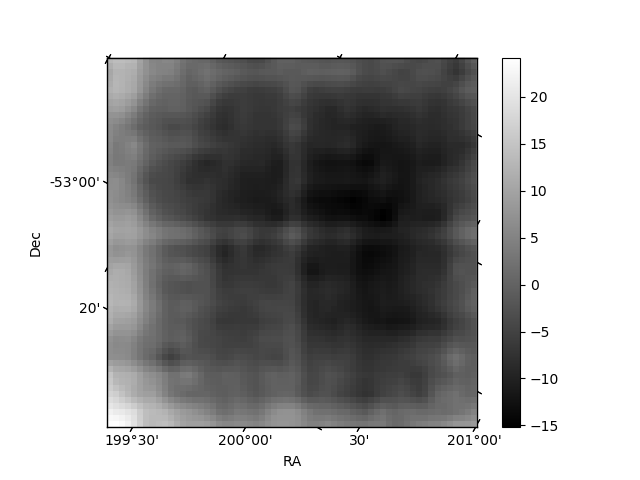
Quadrant B |
|---|---|---|---|
| Quadrant D | 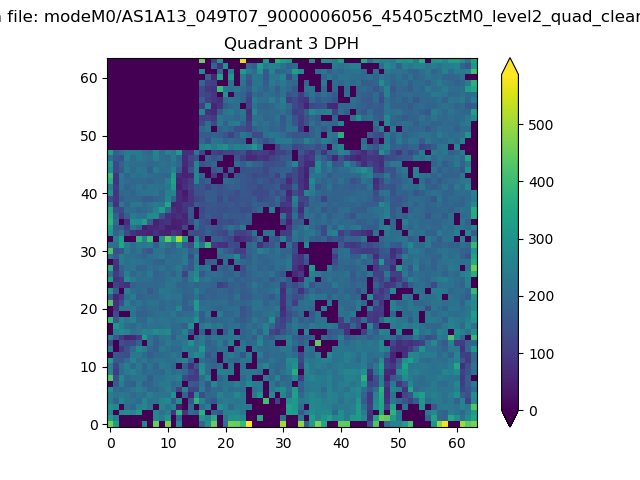 |
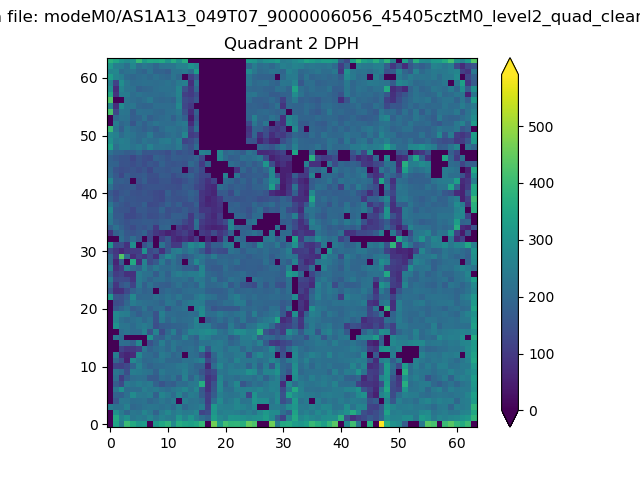 |
Quadrant C |
| Plot type | Count rate plots | Images |
|---|---|---|
| Comparison with Poisson distribution Blue bars denote a histogram of data divided into 1 sec bins. Red curve is a Poisson curve with rate = median count rate of data. |
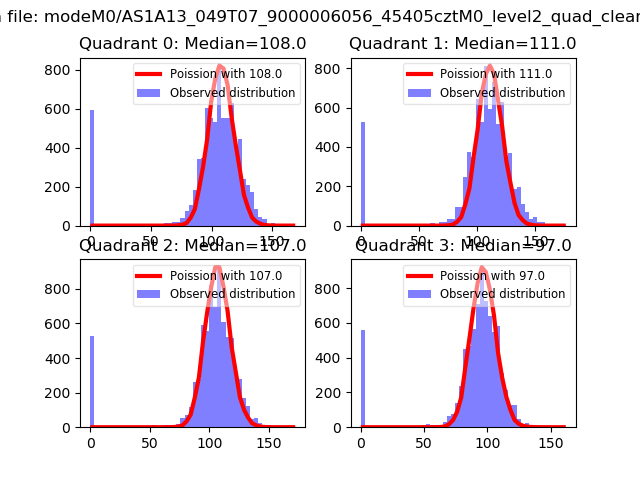 |
 |
| Quadrant-wise count rates Data is divided into 100 sec bins |
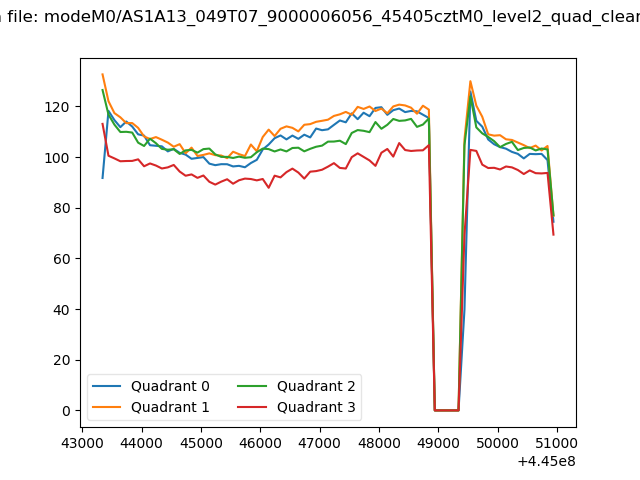 |
|
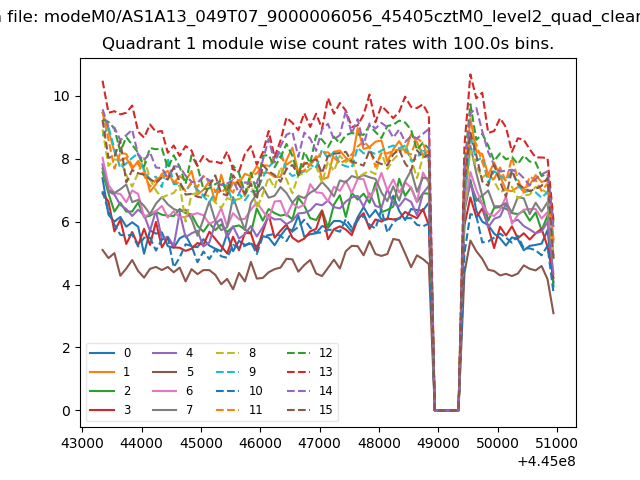
| Module-wise count rates for Quadrant A Data is divided into 100 sec bins |
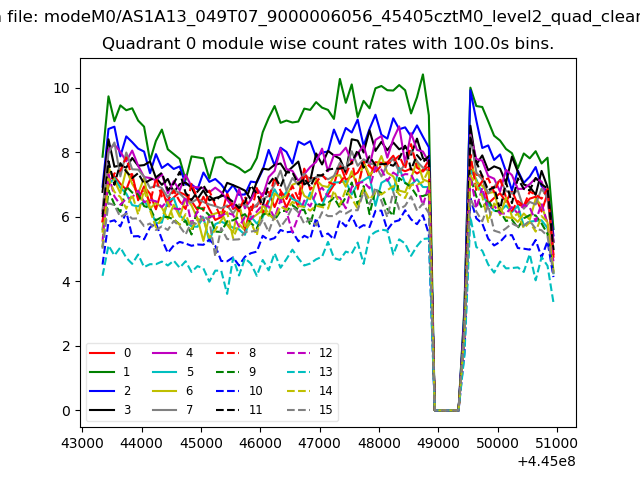 |
 |
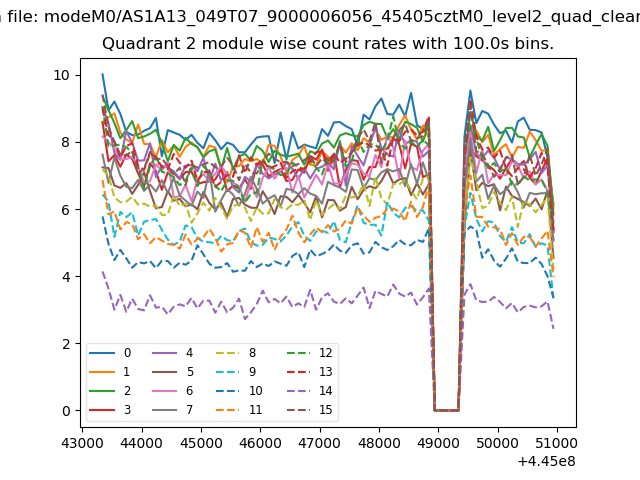
| Module-wise count rates for Quadrant B Data is divided into 100 sec bins |
 |
 |
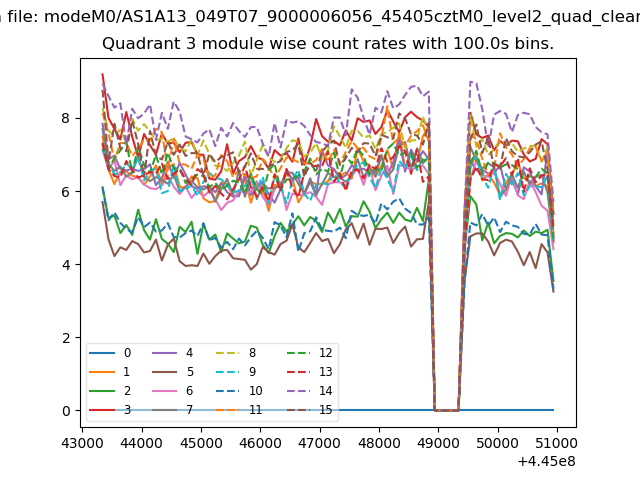
| Module-wise count rates for Quadrant C Data is divided into 100 sec bins |
 |
 |
| Module-wise count rates for Quadrant D Data is divided into 100 sec bins |
 |
 |
| Parameter | Plot |
|---|---|
| CZT HV Monitor | 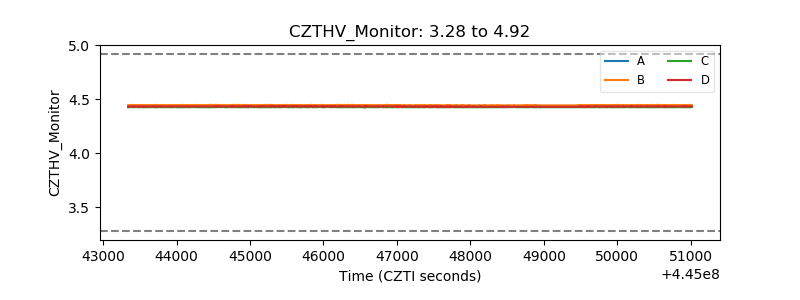 |
| D_VDD | 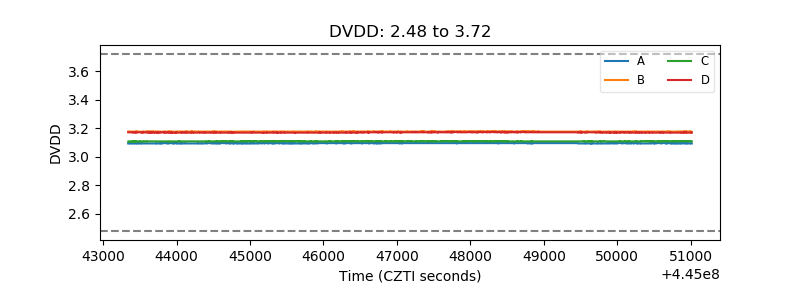 |
| Temperature 1 | 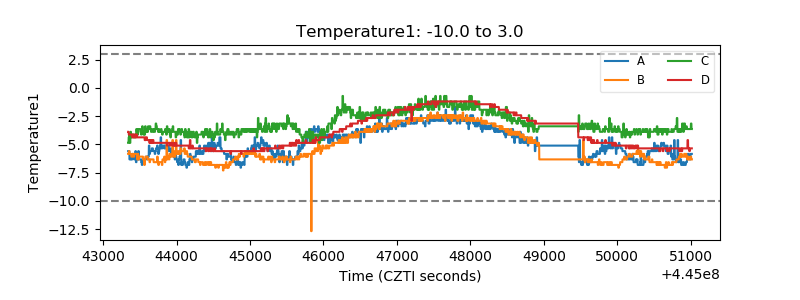 |
| Veto HV Monitor | 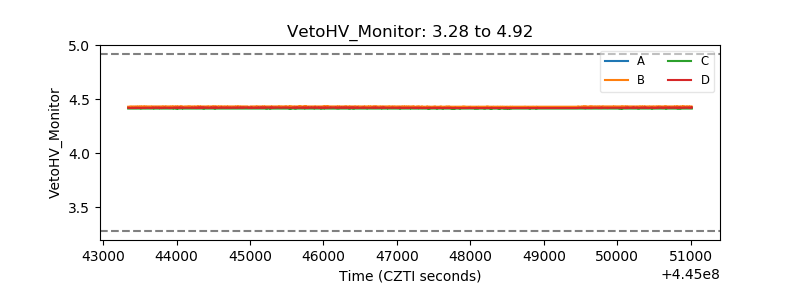 |
| Veto LLD | 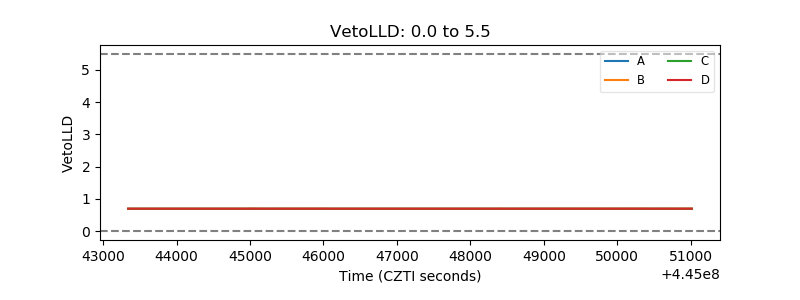 |
| Alpha Counter | 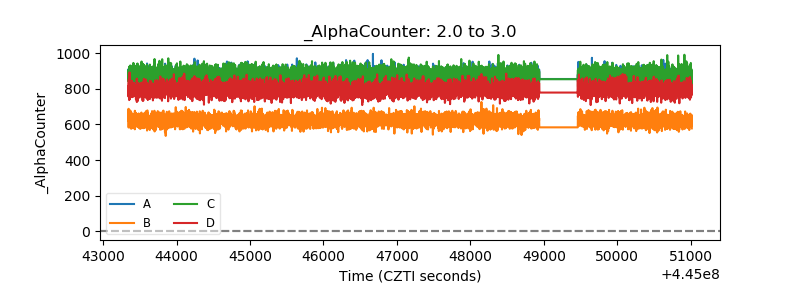 |
| _CPM_Rate | 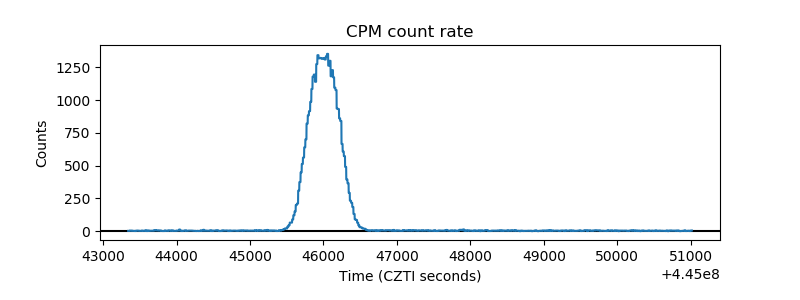 |
| CZT Counter | 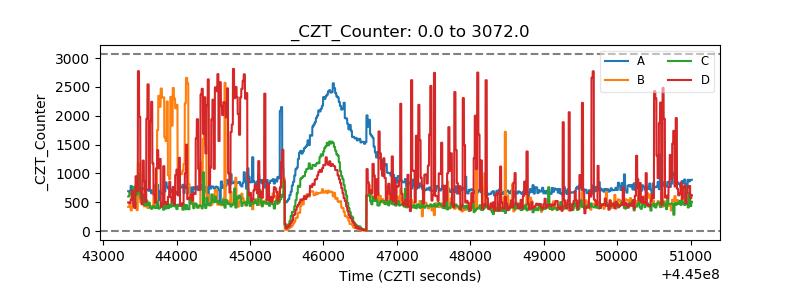 |
| +2.5 Volts monitor | 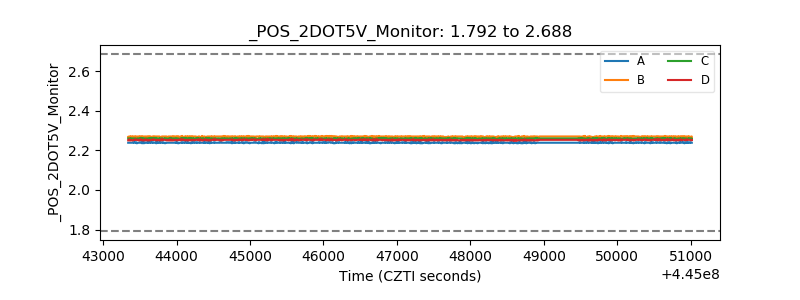 |
| +5 Volts monitor | 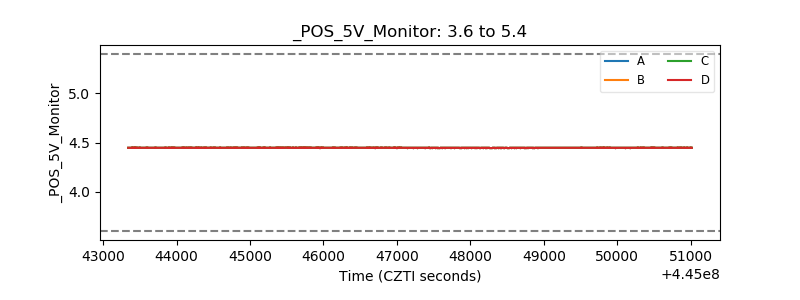 |
| _ROLL_ROT | 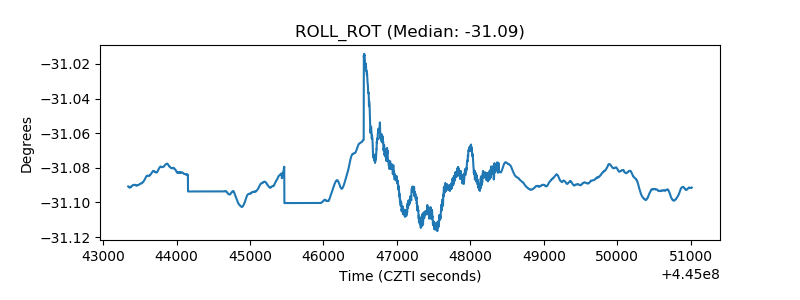 |
| _Roll_DEC | 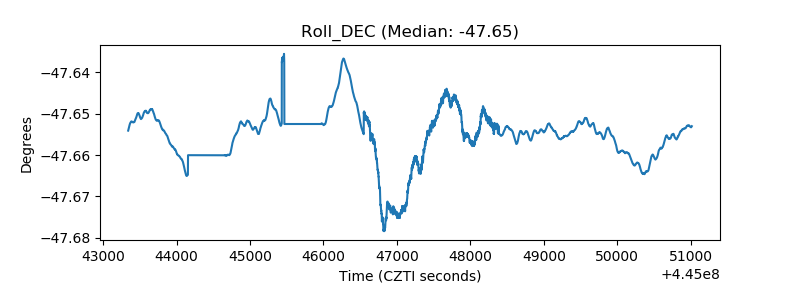 |
| _Roll_RA | 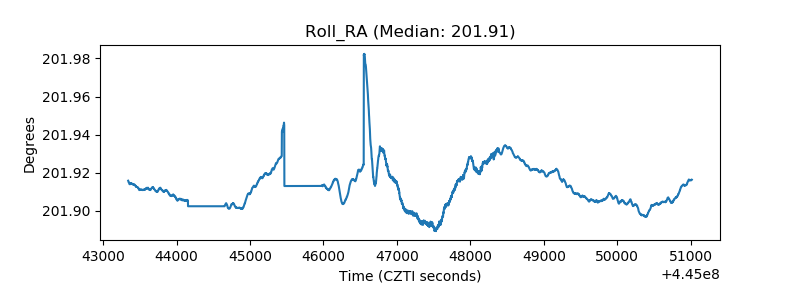 |
| Veto Counter | 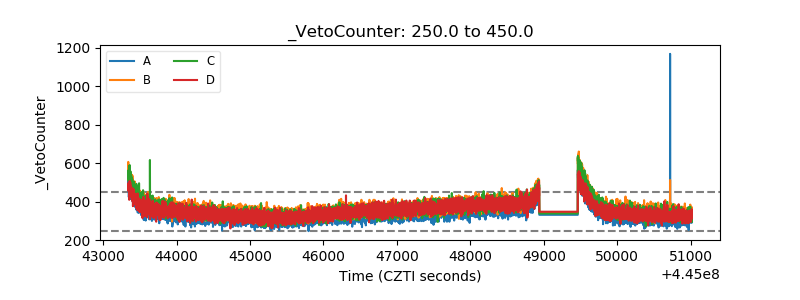 |