| Param | Original file | Final file |
|---|---|---|
| Filename | modeM0/AS1A13_049T07_9000006056_45406cztM0_level2.fits | modeM0/AS1A13_049T07_9000006056_45406cztM0_level2_quad_clean.evt |
| Size (bytes) | 556,894,080 | 134,801,280 |
| Size | 531.1 MB | 128.6 MB |
| Events in quadrant A | 6,782,709 | 891,893 |
| Events in quadrant B | 3,871,447 | 927,166 |
| Events in quadrant C | 3,821,745 | 889,578 |
| Events in quadrant D | 5,488,074 | 790,095 |
| Mode M0 | |||
|---|---|---|---|
| Quadrant | BADHDUFLAG | Total packets | Discarded packets |
| A | 0 | 26402 | 1 |
| B | 0 | 17539 | 1 |
| C | 0 | 17629 | 1 |
| D | 0 | 22148 | 1 |
| Mode M9 | |||
|---|---|---|---|
| Quadrant | BADHDUFLAG | Total packets | Discarded packets |
| A | 0 | 5 | 0 |
| B | 0 | 5 | 0 |
| C | 0 | 5 | 0 |
| D | 0 | 5 | 0 |
| Mode SS | |||
|---|---|---|---|
| Quadrant | BADHDUFLAG | Total packets | Discarded packets |
| A | 0 | 170 | 0 |
| B | 0 | 170 | 0 |
| C | 0 | 170 | 0 |
| D | 0 | 170 | 0 |
| Quadrant | Total seconds | Saturated seconds | Saturation percentage |
|---|---|---|---|
| A | 8388 | 199 | 2.372437% |
| B | 8388 | 48 | 0.572246% |
| C | 8389 | 17 | 0.202646% |
| D | 8389 | 227 | 2.705924% |
Noise dominated data is calculated using 1-second bins in cleaned event files. If a bin has >2000 counts, and if more than 50% of those come from <1% of pixels, then it is considered to be noise-dominated and hence unusable.
| Quadrant | # 1 sec bins | Bins with >0 counts | Bins with >2000 counts | High rate bins dominated by noise | Noise dominated (total time) | Noise dominated (detector-on time) | Marked lightcurve |
|---|---|---|---|---|---|---|---|
| A | 8913 | 8389 | 66 | 66 | 0.74% | 0.79% | 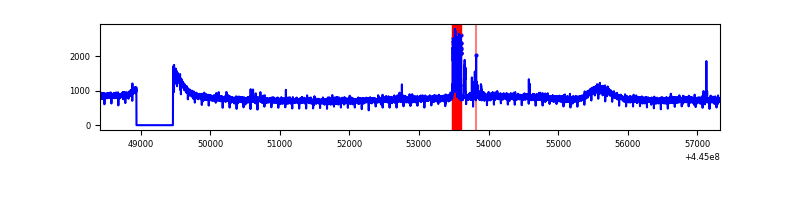 |
| B | 8913 | 8389 | 0 | 0 | 0.00% | 0.00% | 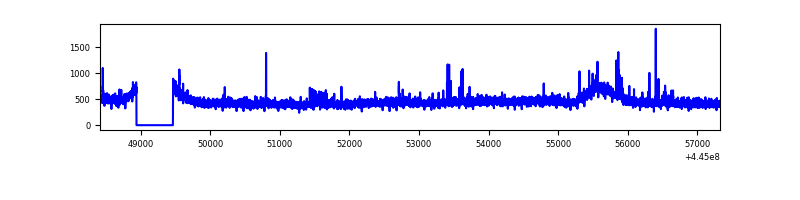 |
| C | 8914 | 8390 | 5 | 5 | 0.06% | 0.06% | 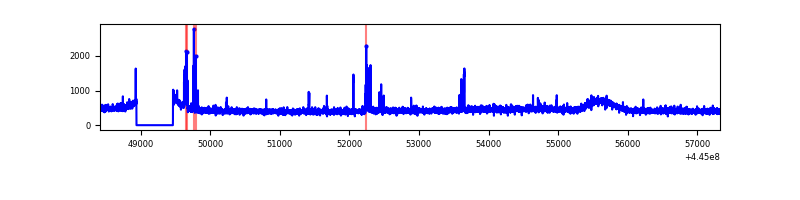 |
| D | 8914 | 8390 | 190 | 190 | 2.13% | 2.26% | 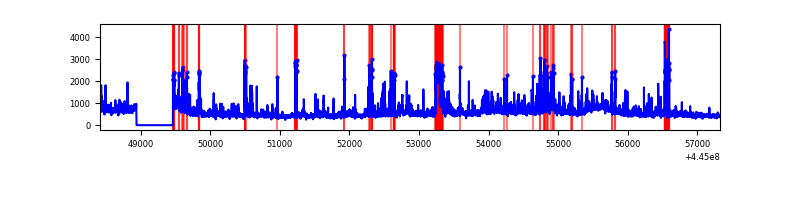 |
Top three noisy pixels from each quadrant. If the there are fewer than three noisy pixels in the level2.evt file, extra rows are filled as -1
| Pixel properties | Quadrant properties | ||||||
|---|---|---|---|---|---|---|---|
| Quadrant | DetID | PixID | Counts | Sigma | Mean | Median | Sigma |
| A | 10 | 83 | 2906829 | 14764.43 | 947 | 926 | 196.8 |
| A | 15 | 174 | 188543 | 953.25 | 947 | 926 | 196.8 |
| A | 9 | 191 | 11522 | 53.84 | 947 | 926 | 196.8 |
| B | 0 | 155 | 31442 | 161.07 | 955 | 925 | 189.5 |
| B | 12 | 111 | 24676 | 125.36 | 955 | 925 | 189.5 |
| B | 11 | 111 | 22546 | 114.12 | 955 | 925 | 189.5 |
| C | 11 | 16 | 38439 | 168.6 | 942 | 949 | 222.4 |
| C | 0 | 239 | 29694 | 129.27 | 942 | 949 | 222.4 |
| C | 3 | 233 | 26022 | 112.76 | 942 | 949 | 222.4 |
| D | 11 | 241 | 621444 | 2660.86 | 919 | 889 | 233.2 |
| D | 13 | 249 | 514125 | 2200.69 | 919 | 889 | 233.2 |
| D | 1 | 52 | 392135 | 1677.62 | 919 | 889 | 233.2 |
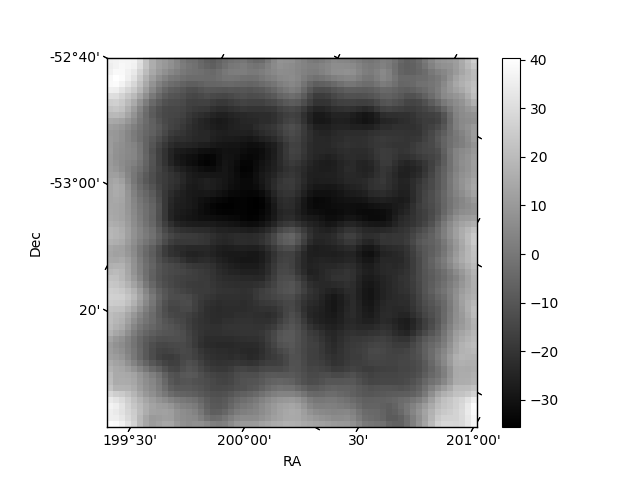
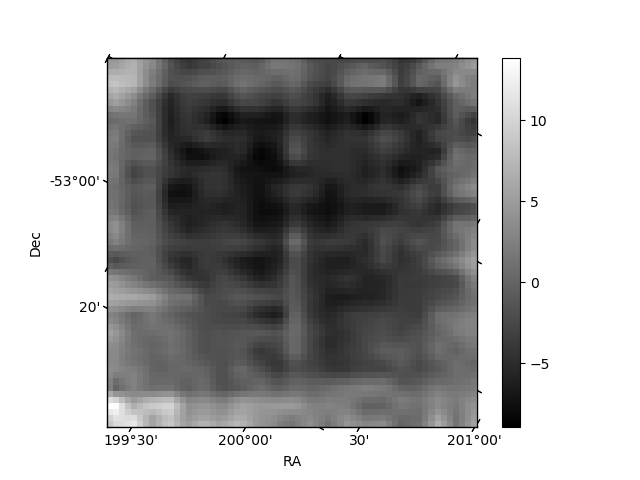
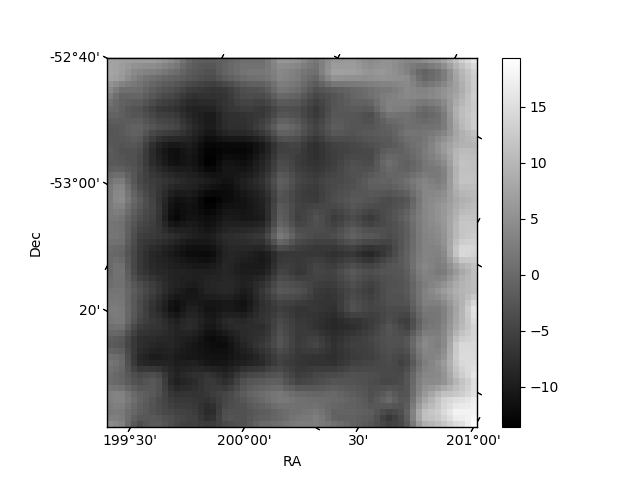
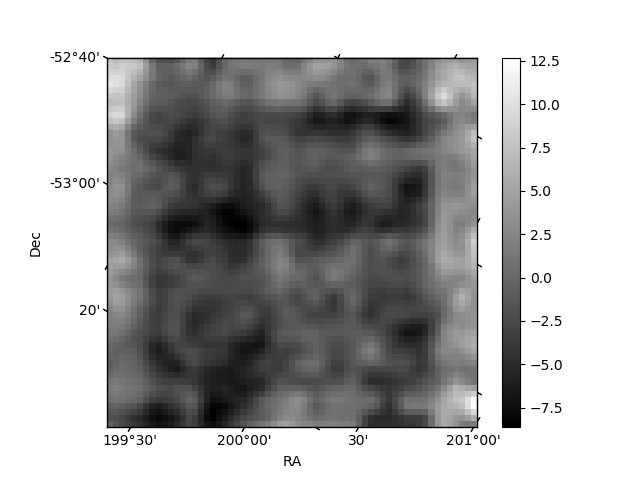
Histogram calculated using DETX and DETY for each event in the final _common_clean file
| Quadrant A | 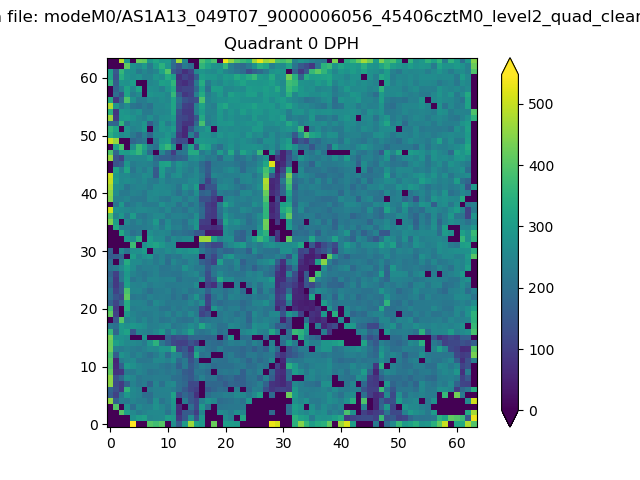 |
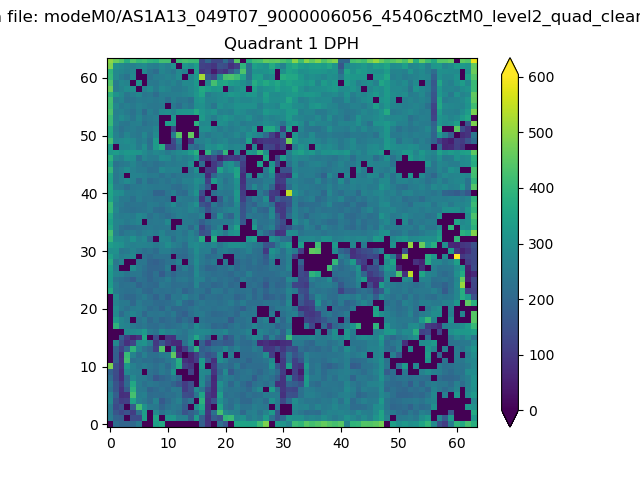 |
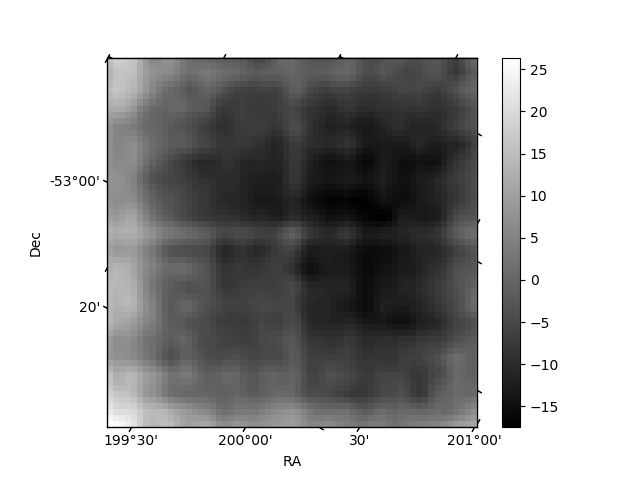
Quadrant B |
|---|---|---|---|
| Quadrant D | 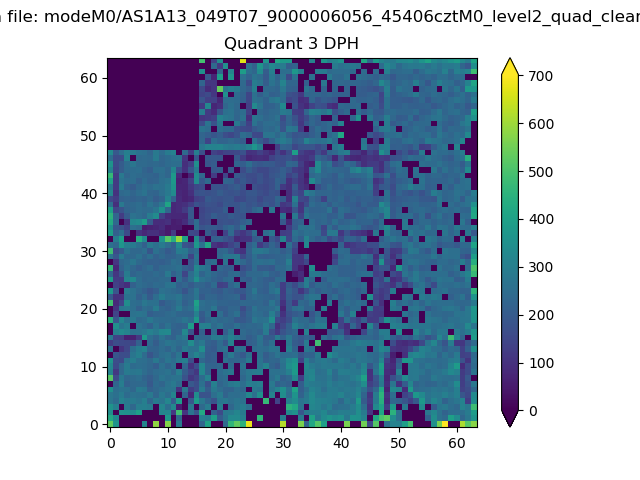 |
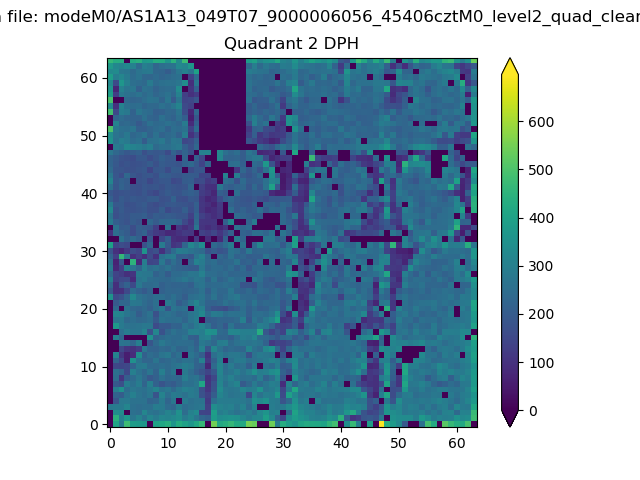 |
Quadrant C |
| Plot type | Count rate plots | Images |
|---|---|---|
| Comparison with Poisson distribution Blue bars denote a histogram of data divided into 1 sec bins. Red curve is a Poisson curve with rate = median count rate of data. |
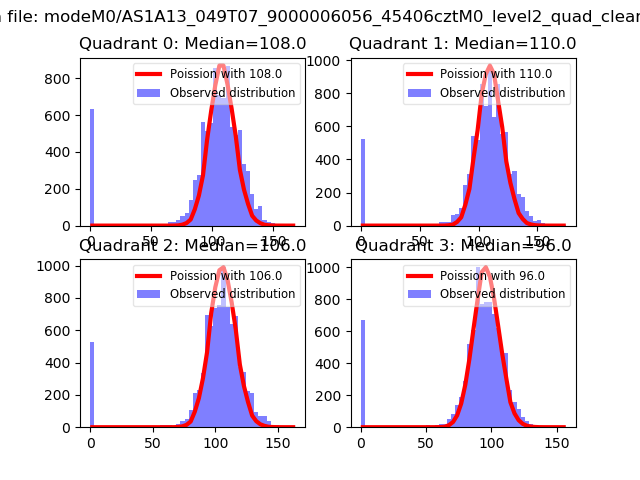 |
 |
| Quadrant-wise count rates Data is divided into 100 sec bins |
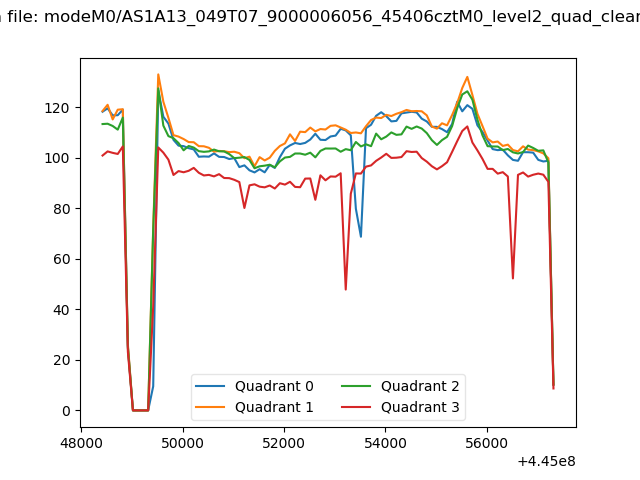 |
|
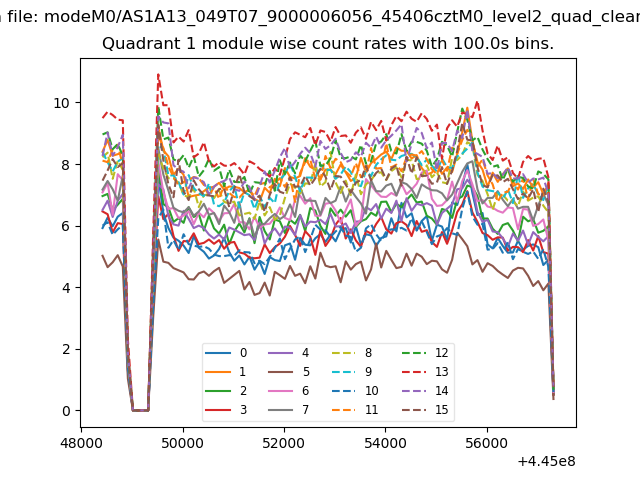
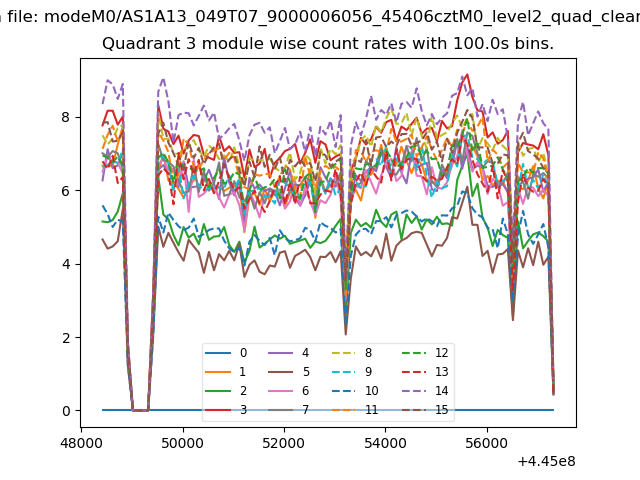
| Module-wise count rates for Quadrant A Data is divided into 100 sec bins |
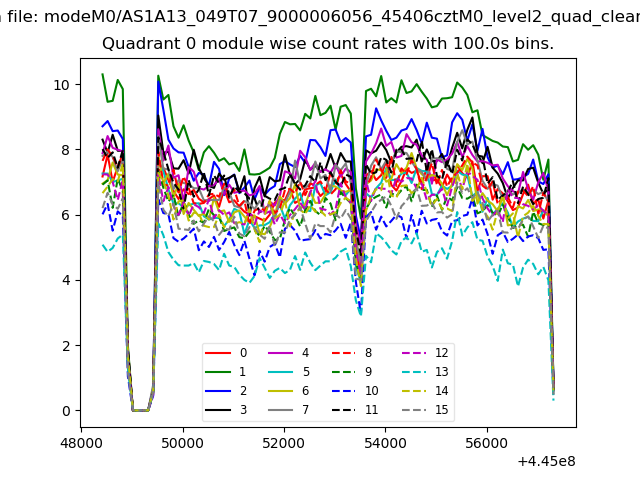 |
 |
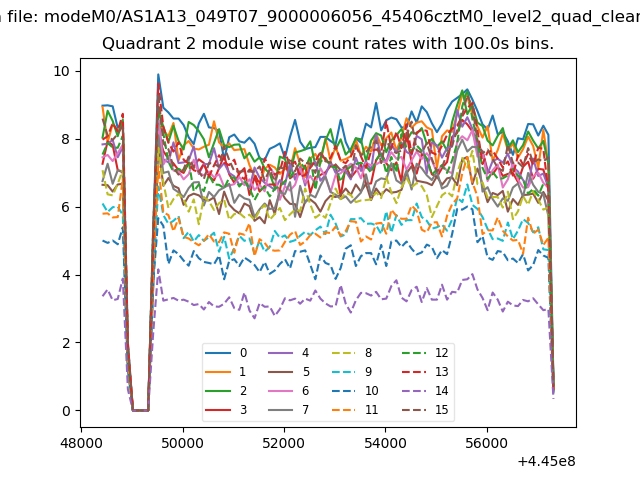
| Module-wise count rates for Quadrant B Data is divided into 100 sec bins |
 |
 |
| Module-wise count rates for Quadrant C Data is divided into 100 sec bins |
 |
 |
| Module-wise count rates for Quadrant D Data is divided into 100 sec bins |
 |
 |
| Parameter | Plot |
|---|---|
| CZT HV Monitor | 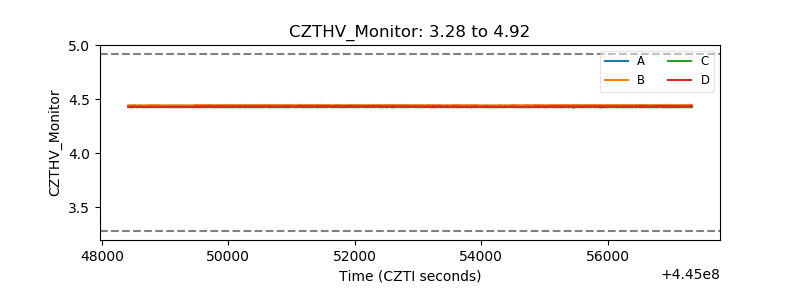 |
| D_VDD | 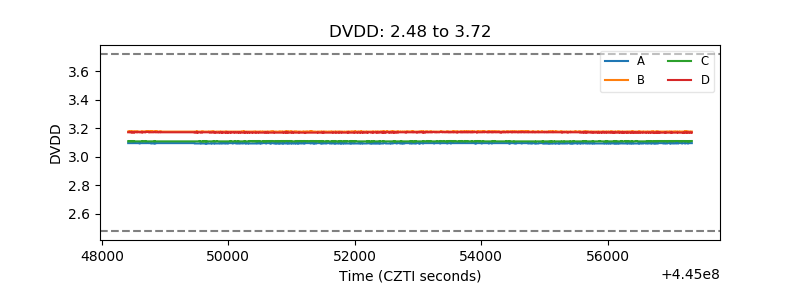 |
| Temperature 1 | 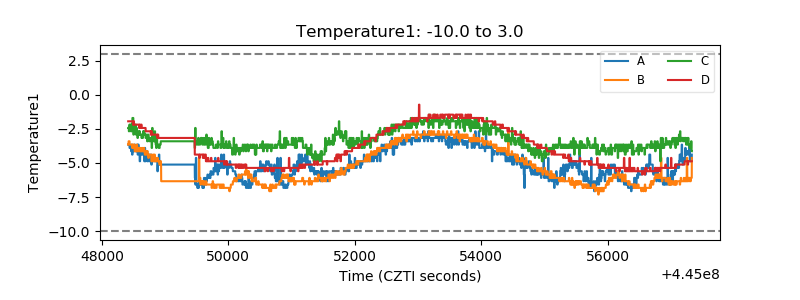 |
| Veto HV Monitor | 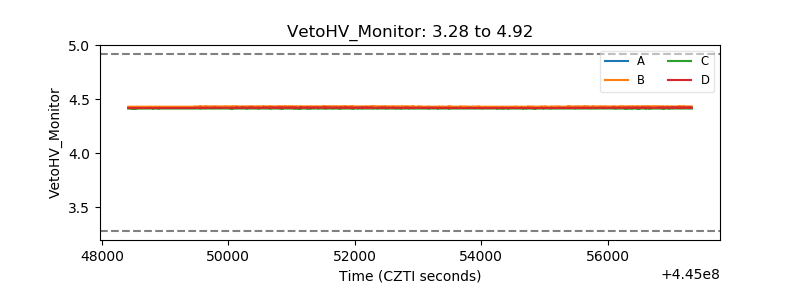 |
| Veto LLD | 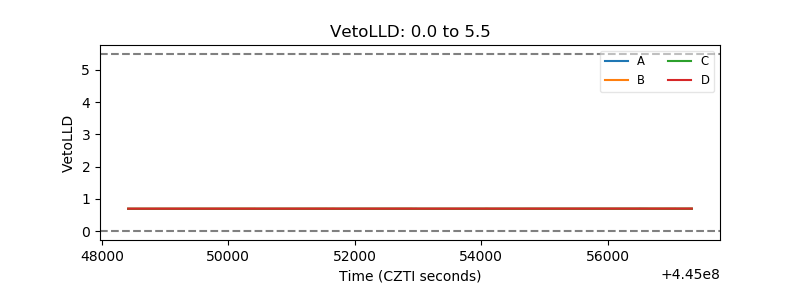 |
| Alpha Counter | 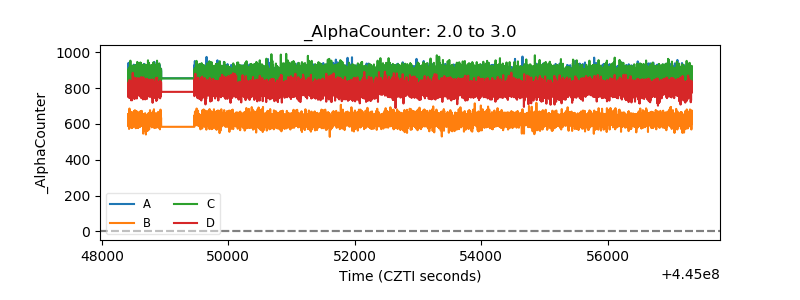 |
| _CPM_Rate | 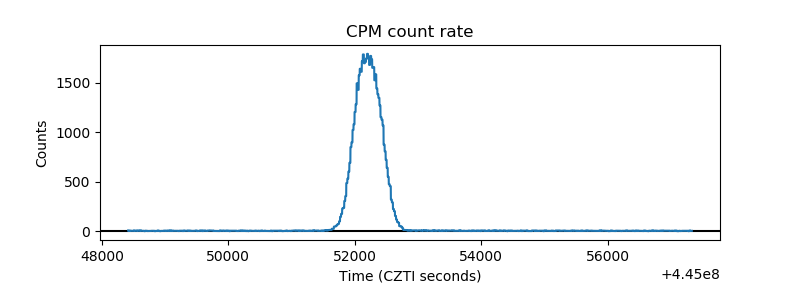 |
| CZT Counter | 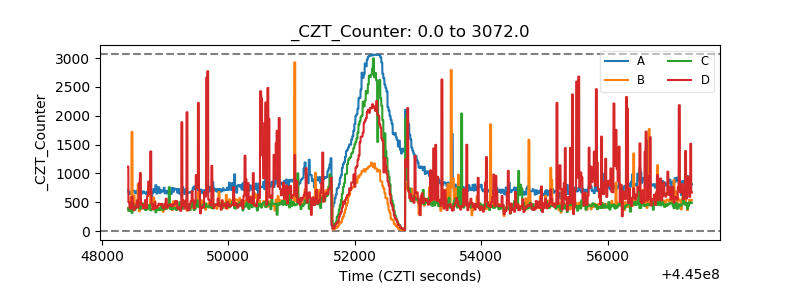 |
| +2.5 Volts monitor | 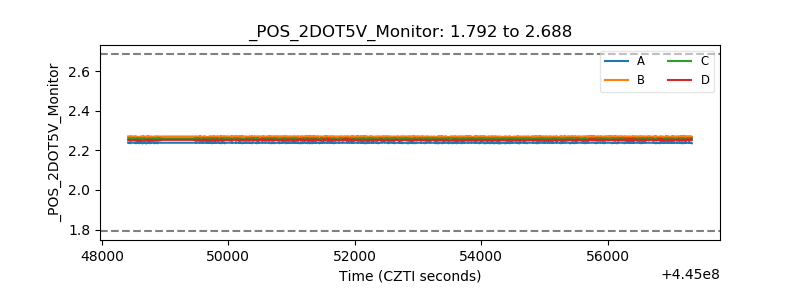 |
| +5 Volts monitor | 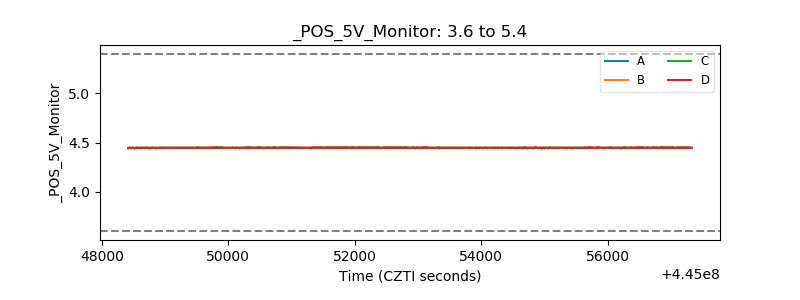 |
| _ROLL_ROT | 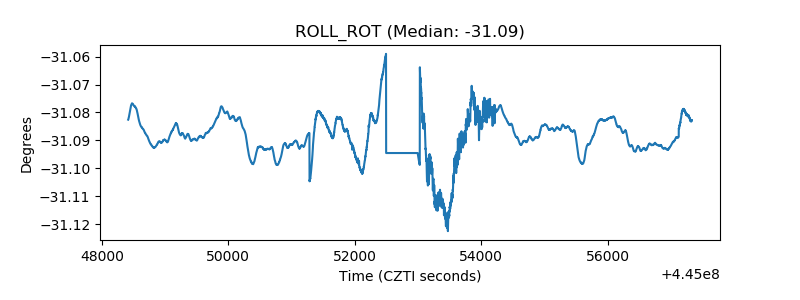 |
| _Roll_DEC | 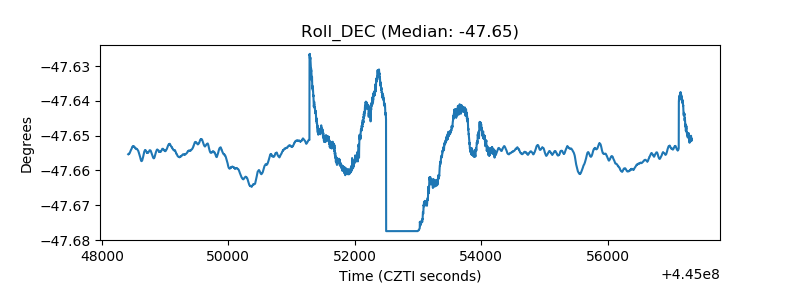 |
| _Roll_RA | 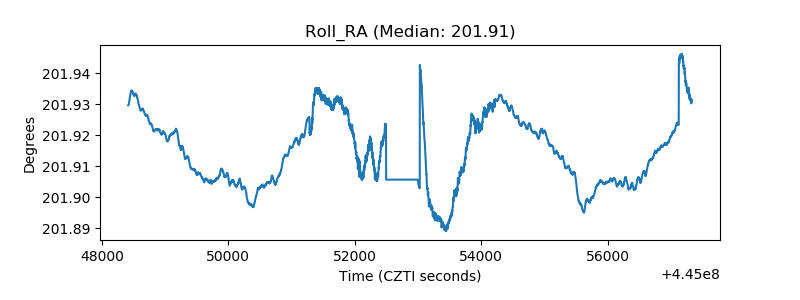 |
| Veto Counter | 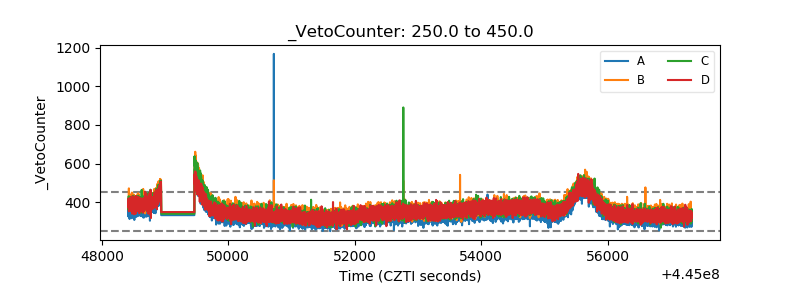 |