| Param | Original file | Final file |
|---|---|---|
| Filename | modeM0/AS1A13_049T07_9000006056_45407cztM0_level2.fits | modeM0/AS1A13_049T07_9000006056_45407cztM0_level2_quad_clean.evt |
| Size (bytes) | 568,177,920 | 139,803,840 |
| Size | 541.9 MB | 133.3 MB |
| Events in quadrant A | 6,722,389 | 931,505 |
| Events in quadrant B | 3,951,771 | 963,404 |
| Events in quadrant C | 3,868,110 | 922,054 |
| Events in quadrant D | 5,816,386 | 813,009 |
| Mode M0 | |||
|---|---|---|---|
| Quadrant | BADHDUFLAG | Total packets | Discarded packets |
| A | 0 | 26396 | 0 |
| B | 0 | 18089 | 0 |
| C | 0 | 18057 | 0 |
| D | 0 | 23220 | 0 |
| Mode SS | |||
|---|---|---|---|
| Quadrant | BADHDUFLAG | Total packets | Discarded packets |
| A | 0 | 174 | 0 |
| B | 0 | 174 | 0 |
| C | 0 | 174 | 0 |
| D | 0 | 174 | 0 |
| Quadrant | Total seconds | Saturated seconds | Saturation percentage |
|---|---|---|---|
| A | 8685 | 75 | 0.863558% |
| B | 8684 | 62 | 0.713957% |
| C | 8685 | 24 | 0.276339% |
| D | 8685 | 276 | 3.177893% |
Noise dominated data is calculated using 1-second bins in cleaned event files. If a bin has >2000 counts, and if more than 50% of those come from <1% of pixels, then it is considered to be noise-dominated and hence unusable.
| Quadrant | # 1 sec bins | Bins with >0 counts | Bins with >2000 counts | High rate bins dominated by noise | Noise dominated (total time) | Noise dominated (detector-on time) | Marked lightcurve |
|---|---|---|---|---|---|---|---|
| A | 8685 | 8685 | 0 | 0 | 0.00% | 0.00% | 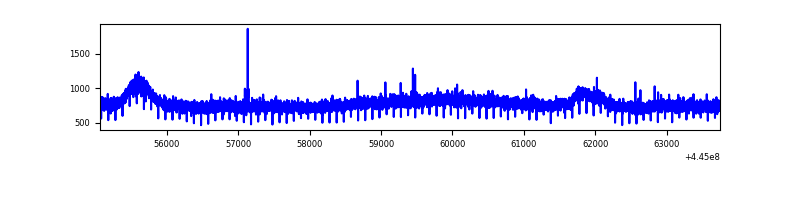 |
| B | 8684 | 8684 | 0 | 0 | 0.00% | 0.00% | 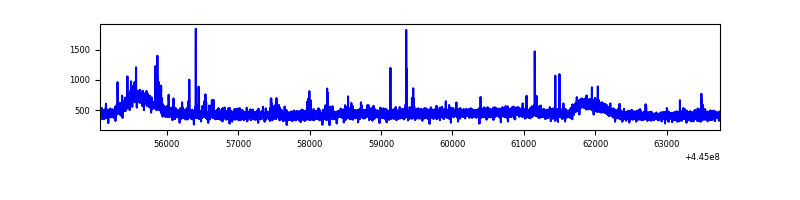 |
| C | 8685 | 8685 | 12 | 12 | 0.14% | 0.14% | 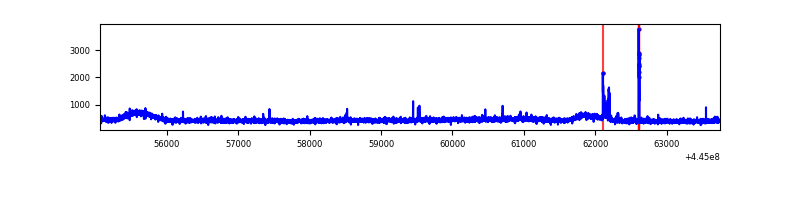 |
| D | 8685 | 8685 | 267 | 267 | 3.07% | 3.07% | 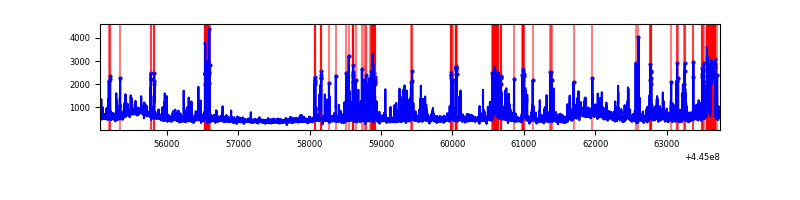 |
Top three noisy pixels from each quadrant. If the there are fewer than three noisy pixels in the level2.evt file, extra rows are filled as -1
| Pixel properties | Quadrant properties | ||||||
|---|---|---|---|---|---|---|---|
| Quadrant | DetID | PixID | Counts | Sigma | Mean | Median | Sigma |
| A | 10 | 83 | 2912179 | 14282.66 | 977 | 954 | 203.8 |
| A | 9 | 191 | 16209 | 74.84 | 977 | 954 | 203.8 |
| A | 2 | 79 | 11777 | 53.1 | 977 | 954 | 203.8 |
| B | 12 | 111 | 24957 | 124.43 | 977 | 946 | 193.0 |
| B | 4 | 170 | 24614 | 122.65 | 977 | 946 | 193.0 |
| B | 11 | 111 | 23235 | 115.5 | 977 | 946 | 193.0 |
| C | 10 | 20 | 44167 | 190.86 | 960 | 963 | 226.4 |
| C | 1 | 3 | 35364 | 151.97 | 960 | 963 | 226.4 |
| C | 3 | 233 | 30269 | 129.46 | 960 | 963 | 226.4 |
| D | 1 | 52 | 531608 | 2243.83 | 936 | 904 | 236.5 |
| D | 2 | 249 | 482967 | 2038.18 | 936 | 904 | 236.5 |
| D | 11 | 241 | 462040 | 1949.7 | 936 | 904 | 236.5 |
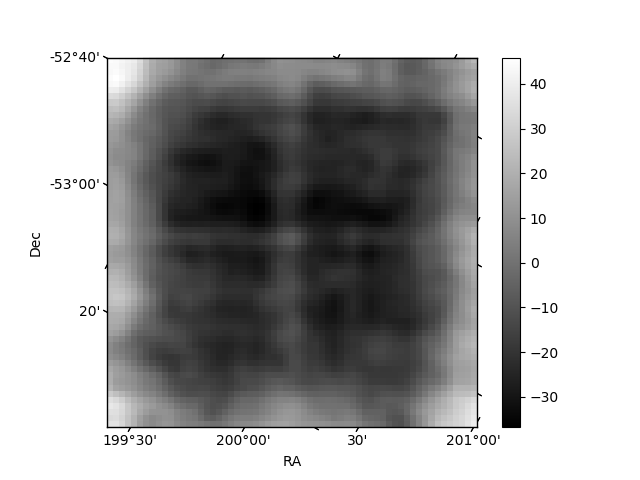
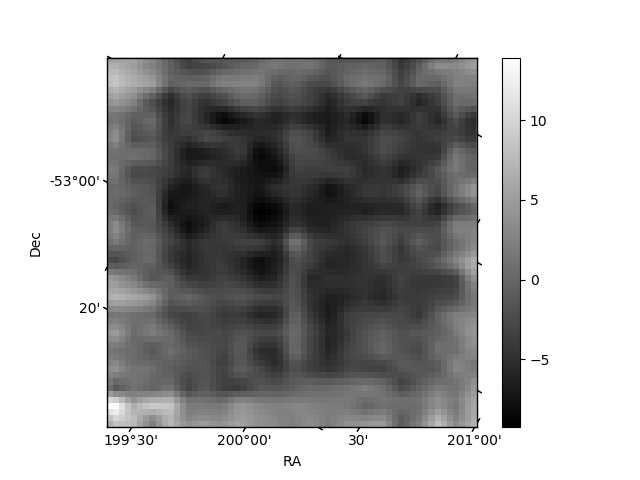
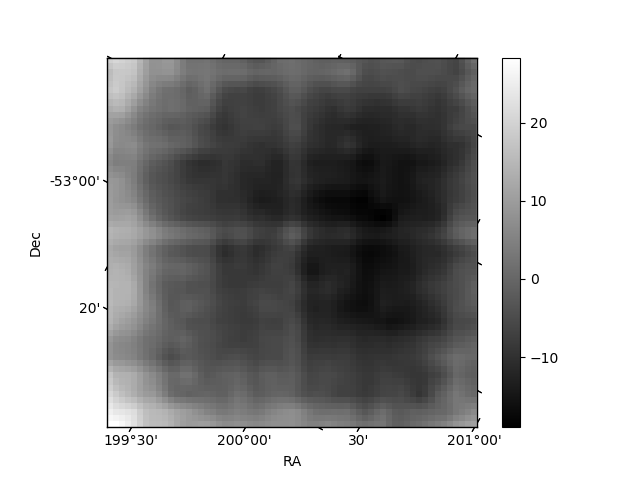
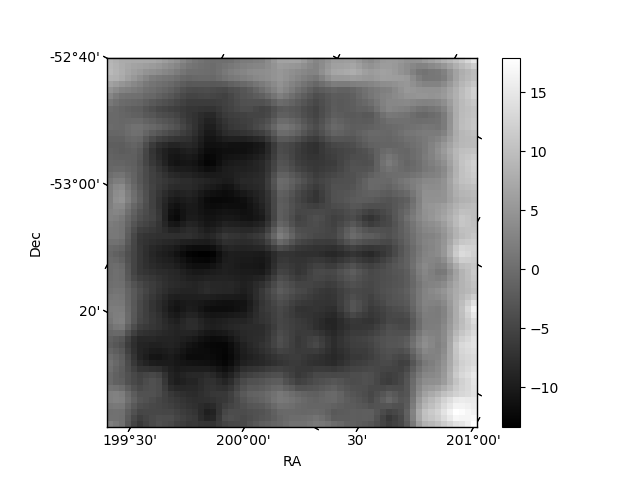
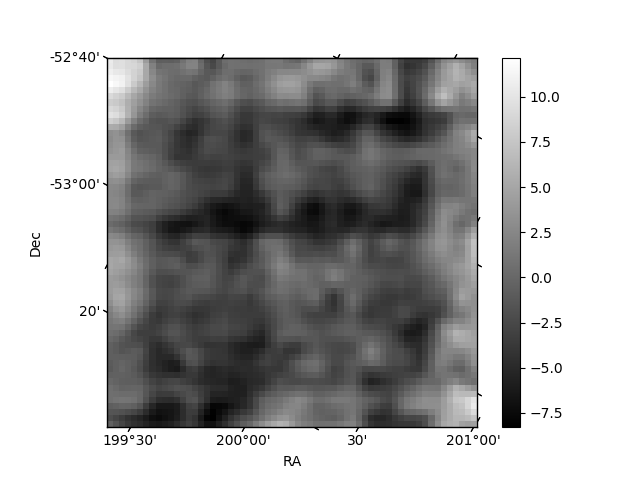
Histogram calculated using DETX and DETY for each event in the final _common_clean file
| Quadrant A | 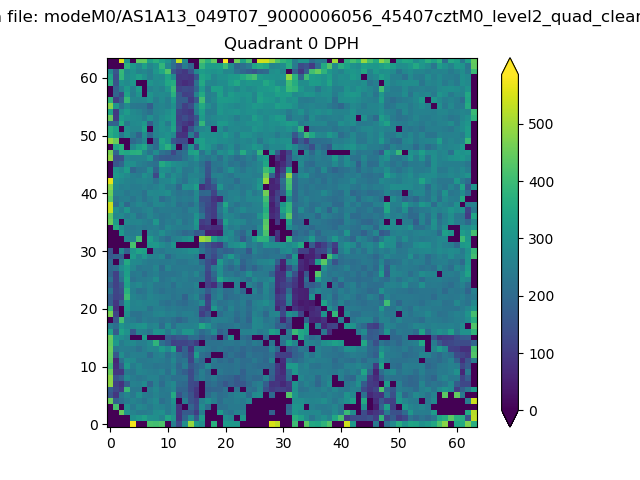 |
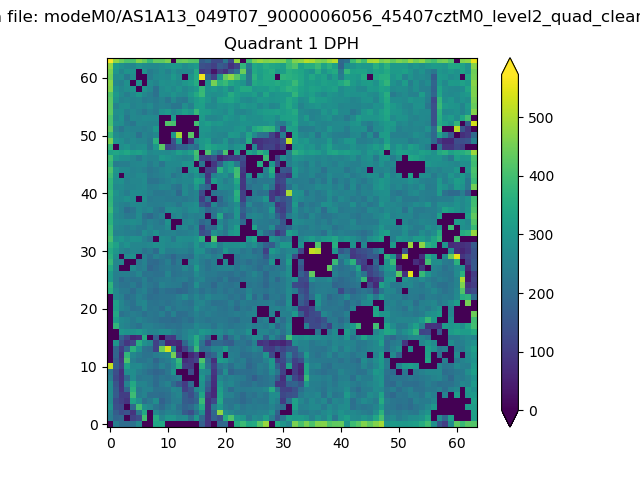 |
Quadrant B |
|---|---|---|---|
| Quadrant D | 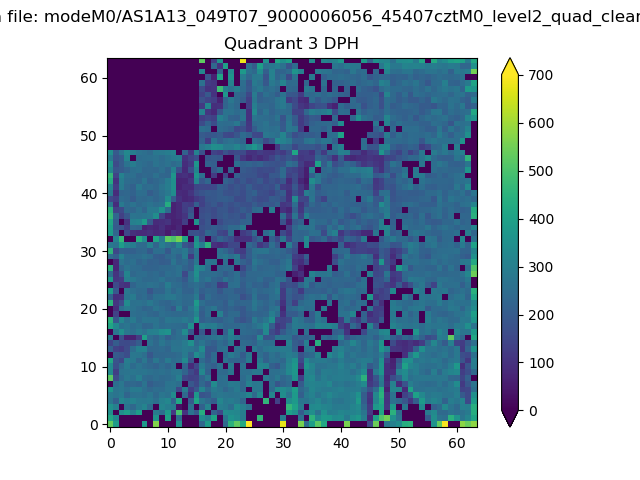 |
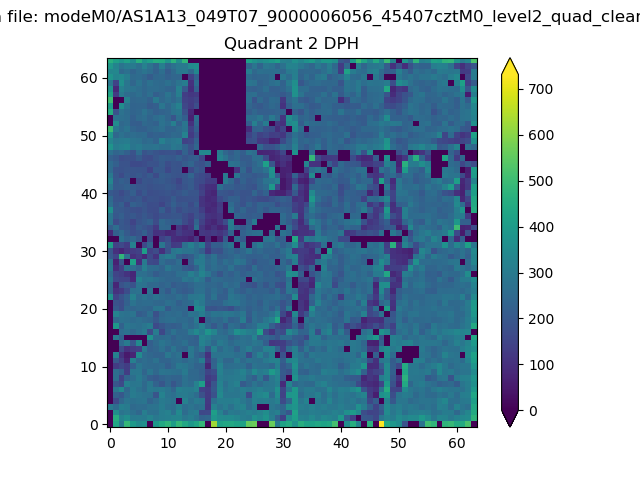 |
Quadrant C |
| Plot type | Count rate plots | Images |
|---|---|---|
| Comparison with Poisson distribution Blue bars denote a histogram of data divided into 1 sec bins. Red curve is a Poisson curve with rate = median count rate of data. |
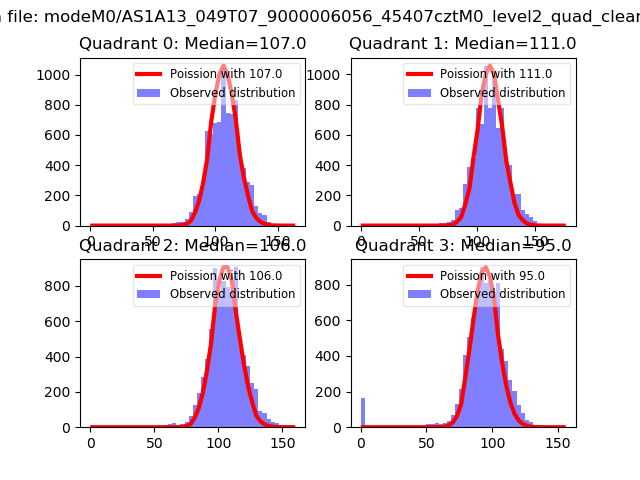 |
 |
| Quadrant-wise count rates Data is divided into 100 sec bins |
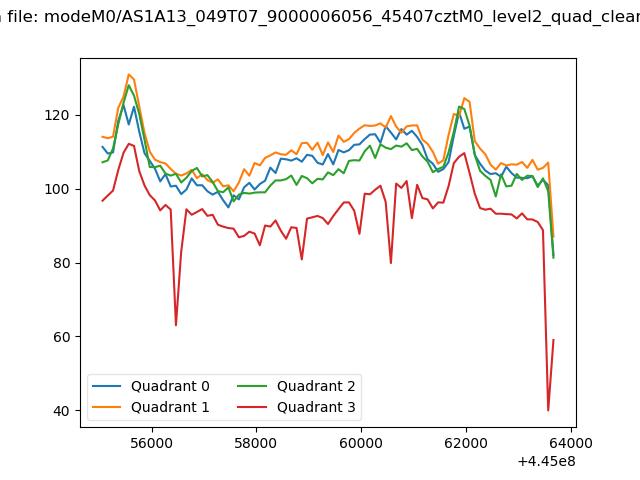 |
|
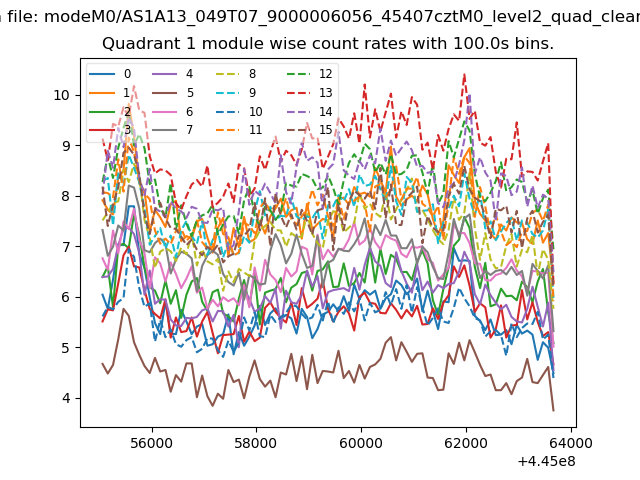
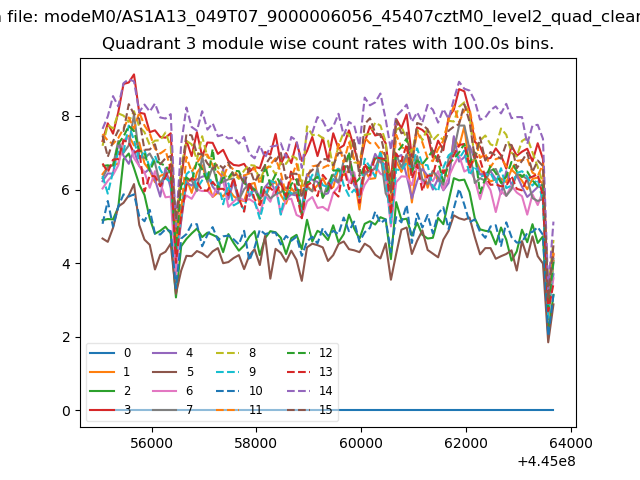
| Module-wise count rates for Quadrant A Data is divided into 100 sec bins |
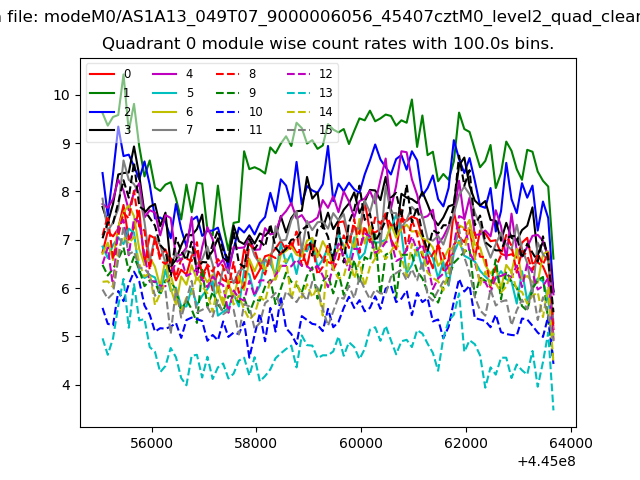 |
 |
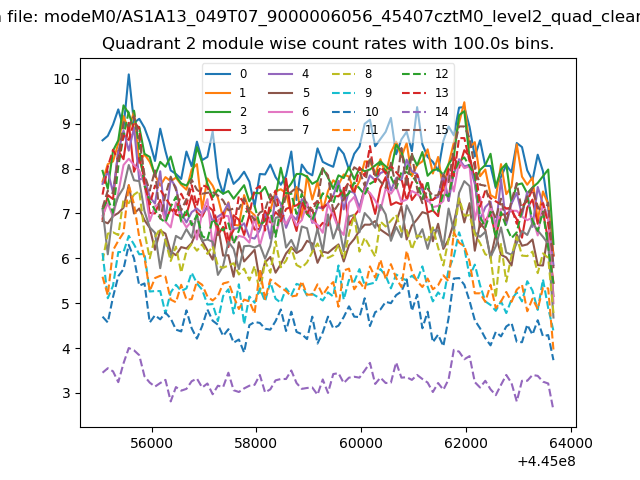
| Module-wise count rates for Quadrant B Data is divided into 100 sec bins |
 |
 |
| Module-wise count rates for Quadrant C Data is divided into 100 sec bins |
 |
 |
| Module-wise count rates for Quadrant D Data is divided into 100 sec bins |
 |
 |
| Parameter | Plot |
|---|---|
| CZT HV Monitor | 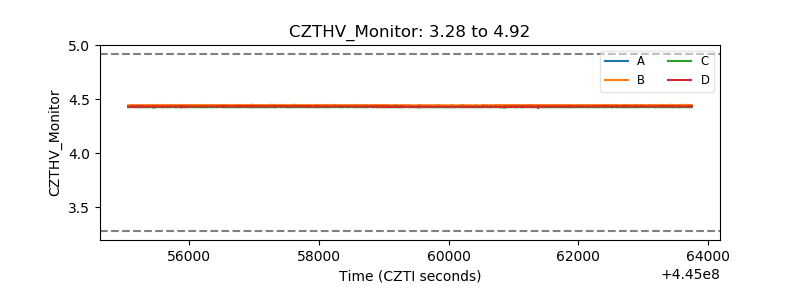 |
| D_VDD |  |
| Temperature 1 | 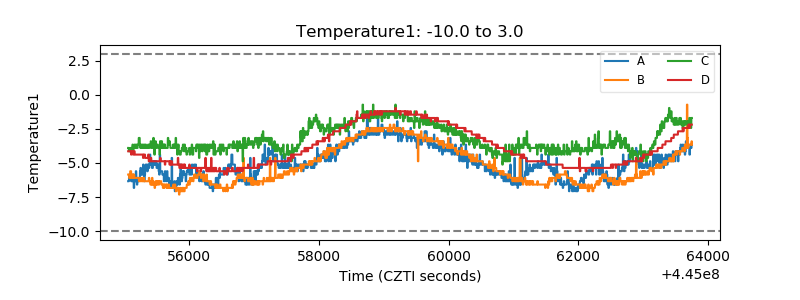 |
| Veto HV Monitor | 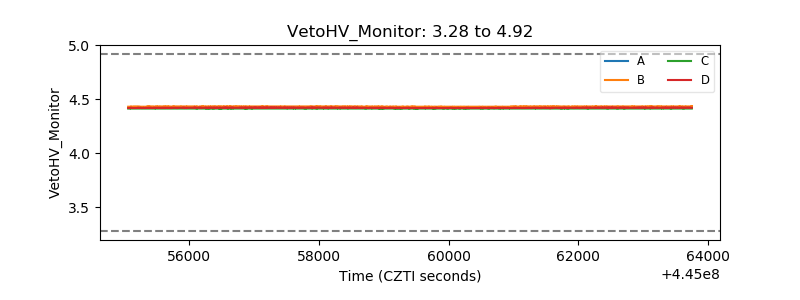 |
| Veto LLD | 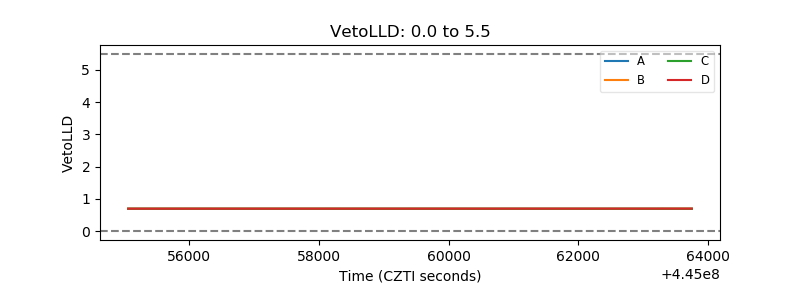 |
| Alpha Counter | 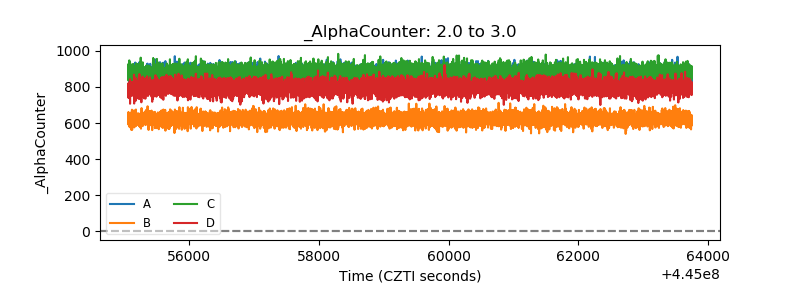 |
| _CPM_Rate | 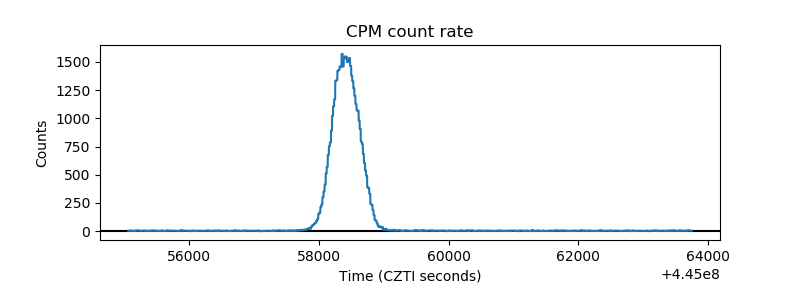 |
| CZT Counter | 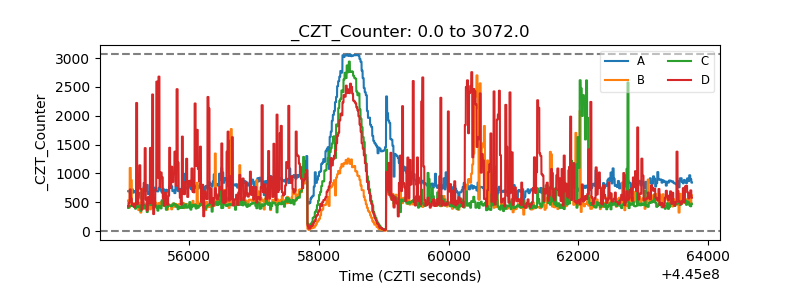 |
| +2.5 Volts monitor | 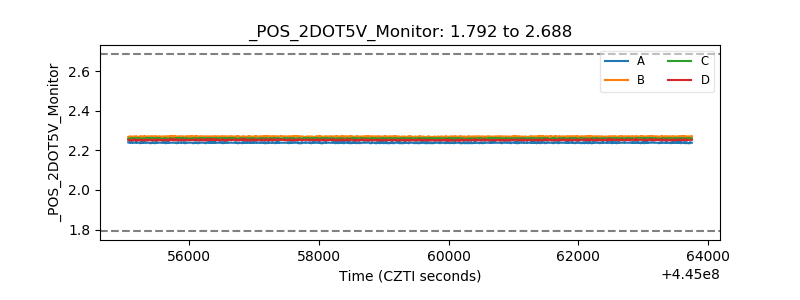 |
| +5 Volts monitor |  |
| _ROLL_ROT | 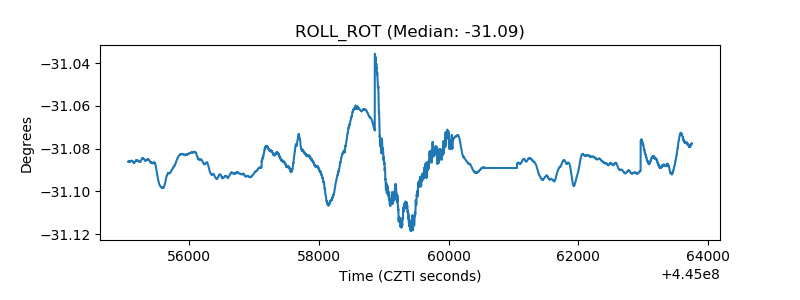 |
| _Roll_DEC | 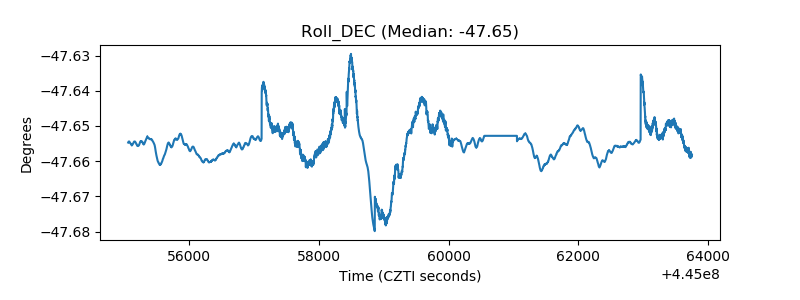 |
| _Roll_RA | 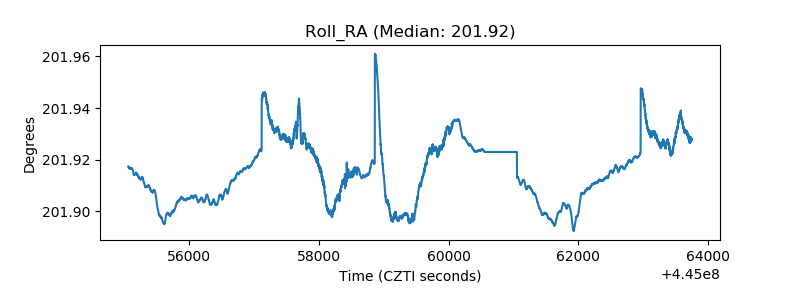 |
| Veto Counter | 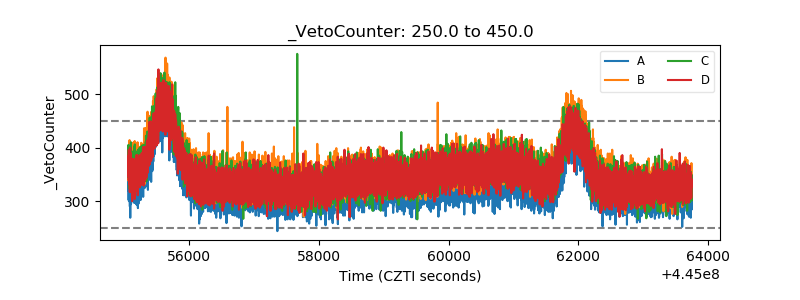 |