| Param | Original file | Final file |
|---|---|---|
| Filename | modeM0/AS1A13_049T07_9000006056_45410cztM0_level2.fits | modeM0/AS1A13_049T07_9000006056_45410cztM0_level2_quad_clean.evt |
| Size (bytes) | 738,527,040 | 155,390,400 |
| Size | 704.3 MB | 148.2 MB |
| Events in quadrant A | 8,037,173 | 1,025,349 |
| Events in quadrant B | 4,798,529 | 1,071,935 |
| Events in quadrant C | 4,468,583 | 1,031,062 |
| Events in quadrant D | 9,259,017 | 883,050 |
| Mode M0 | |||
|---|---|---|---|
| Quadrant | BADHDUFLAG | Total packets | Discarded packets |
| A | 0 | 30532 | 2 |
| B | 0 | 21244 | 1 |
| C | 0 | 20731 | 0 |
| D | 0 | 34459 | 2 |
| Mode SS | |||
|---|---|---|---|
| Quadrant | BADHDUFLAG | Total packets | Discarded packets |
| A | 0 | 200 | 0 |
| B | 0 | 200 | 0 |
| C | 0 | 200 | 0 |
| D | 0 | 200 | 0 |
| Quadrant | Total seconds | Saturated seconds | Saturation percentage |
|---|---|---|---|
| A | 10002 | 290 | 2.899420% |
| B | 10003 | 219 | 2.189343% |
| C | 10003 | 109 | 1.089673% |
| D | 10002 | 898 | 8.978204% |
Noise dominated data is calculated using 1-second bins in cleaned event files. If a bin has >2000 counts, and if more than 50% of those come from <1% of pixels, then it is considered to be noise-dominated and hence unusable.
| Quadrant | # 1 sec bins | Bins with >0 counts | Bins with >2000 counts | High rate bins dominated by noise | Noise dominated (total time) | Noise dominated (detector-on time) | Marked lightcurve |
|---|---|---|---|---|---|---|---|
| A | 10003 | 10003 | 1 | 1 | 0.01% | 0.01% | 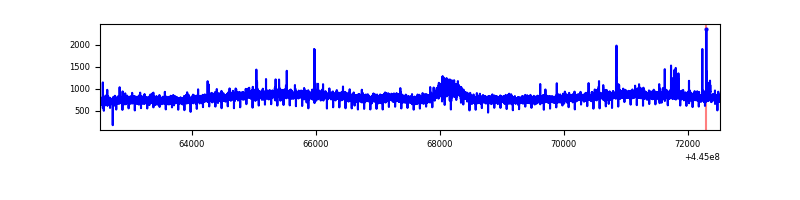 |
| B | 10003 | 10003 | 1 | 1 | 0.01% | 0.01% | 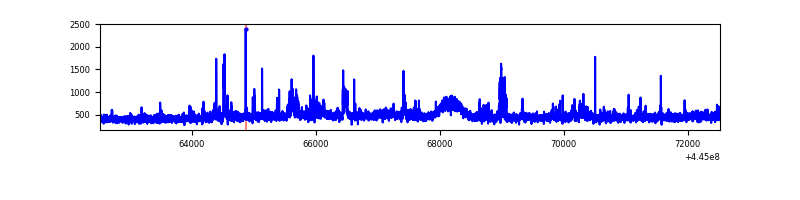 |
| C | 10003 | 10003 | 22 | 22 | 0.22% | 0.22% | 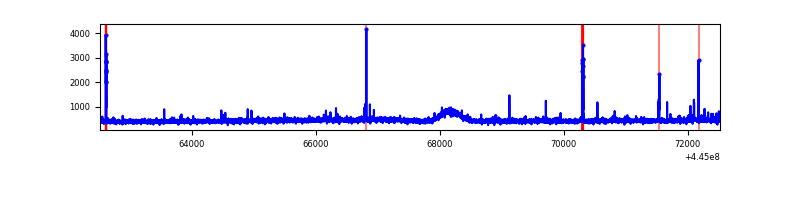 |
| D | 10003 | 10003 | 722 | 722 | 7.22% | 7.22% |  |
Top three noisy pixels from each quadrant. If the there are fewer than three noisy pixels in the level2.evt file, extra rows are filled as -1
| Pixel properties | Quadrant properties | ||||||
|---|---|---|---|---|---|---|---|
| Quadrant | DetID | PixID | Counts | Sigma | Mean | Median | Sigma |
| A | 10 | 83 | 3649823 | 15710.31 | 1112 | 1087 | 232.3 |
| A | 9 | 191 | 34031 | 141.85 | 1112 | 1087 | 232.3 |
| A | 13 | 248 | 18056 | 73.06 | 1112 | 1087 | 232.3 |
| B | 15 | 201 | 143556 | 650.51 | 1109 | 1074 | 219.0 |
| B | 3 | 112 | 75160 | 338.24 | 1109 | 1074 | 219.0 |
| B | 5 | 172 | 60481 | 271.23 | 1109 | 1074 | 219.0 |
| C | 12 | 2 | 60213 | 230.57 | 1092 | 1098 | 256.4 |
| C | 3 | 233 | 54554 | 208.5 | 1092 | 1098 | 256.4 |
| C | 1 | 3 | 29882 | 112.27 | 1092 | 1098 | 256.4 |
| D | 1 | 52 | 2028049 | 7554.72 | 1060 | 1026 | 268.3 |
| D | 11 | 241 | 1126501 | 4194.65 | 1060 | 1026 | 268.3 |
| D | 2 | 249 | 1042646 | 3882.12 | 1060 | 1026 | 268.3 |
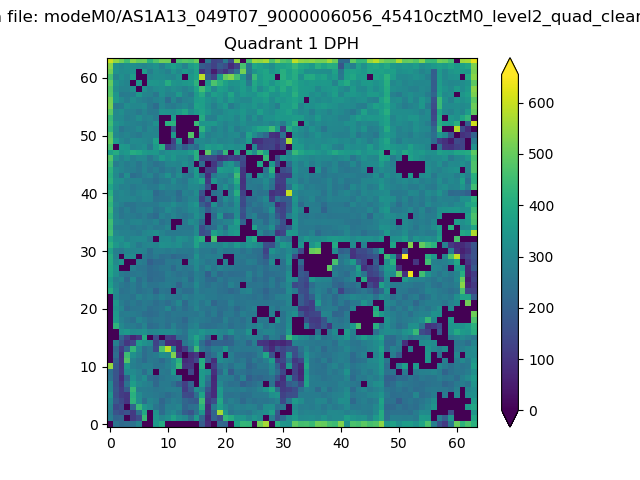
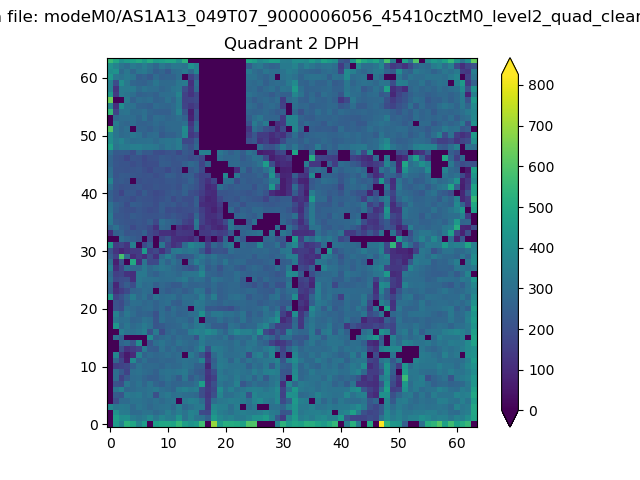
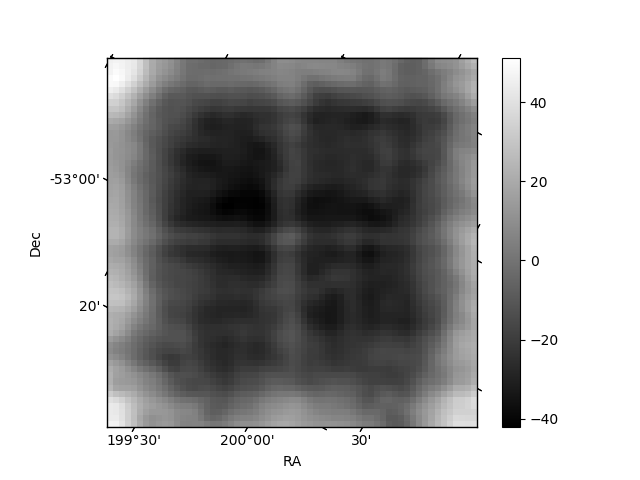
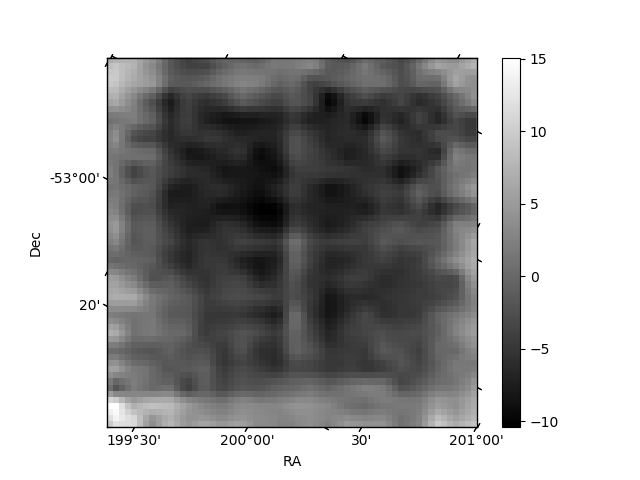
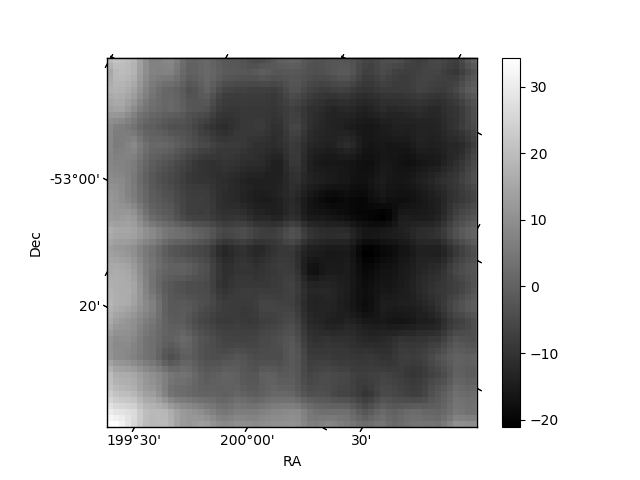
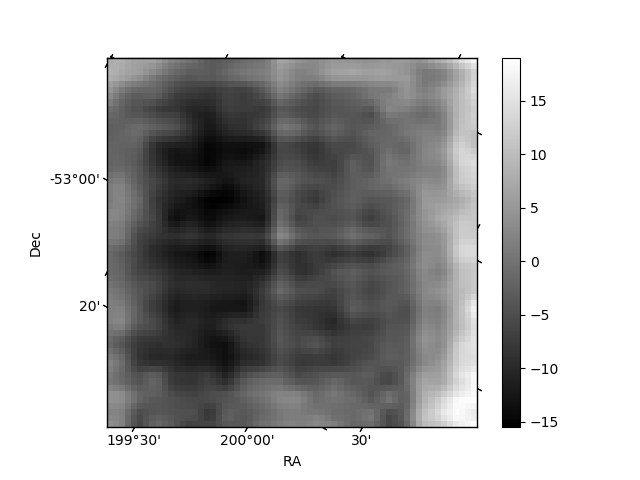
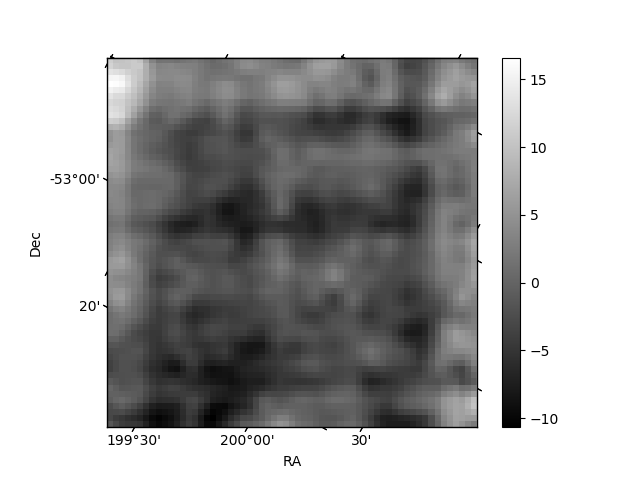
Histogram calculated using DETX and DETY for each event in the final _common_clean file
| Quadrant A | 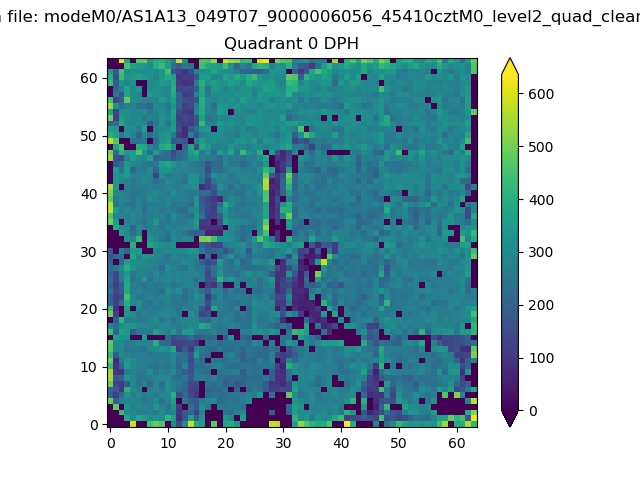 |
 |
Quadrant B |
|---|---|---|---|
| Quadrant D | 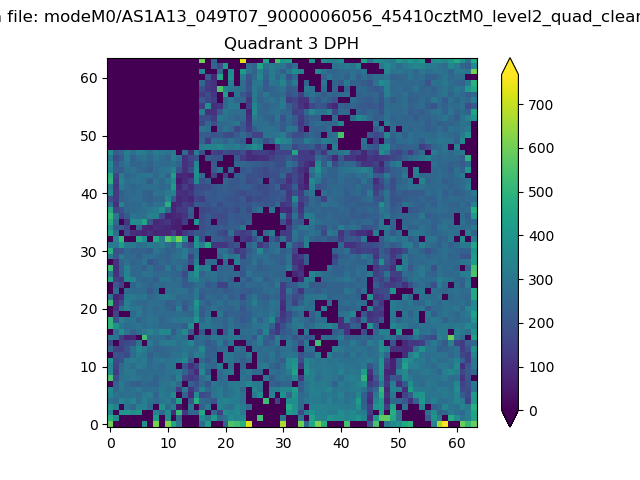 |
 |
Quadrant C |
| Plot type | Count rate plots | Images |
|---|---|---|
| Comparison with Poisson distribution Blue bars denote a histogram of data divided into 1 sec bins. Red curve is a Poisson curve with rate = median count rate of data. |
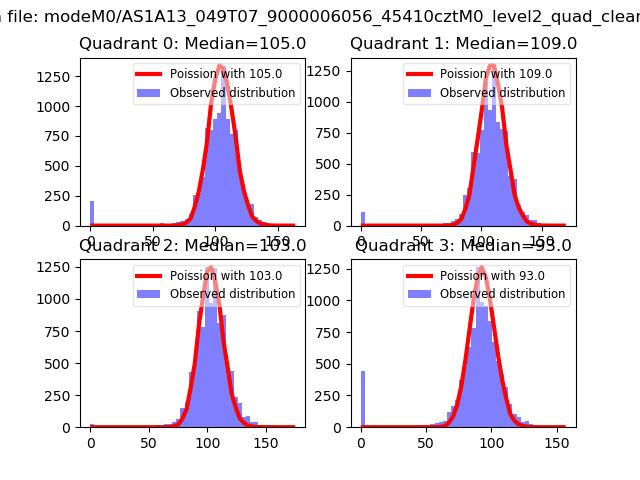 |
 |
| Quadrant-wise count rates Data is divided into 100 sec bins |
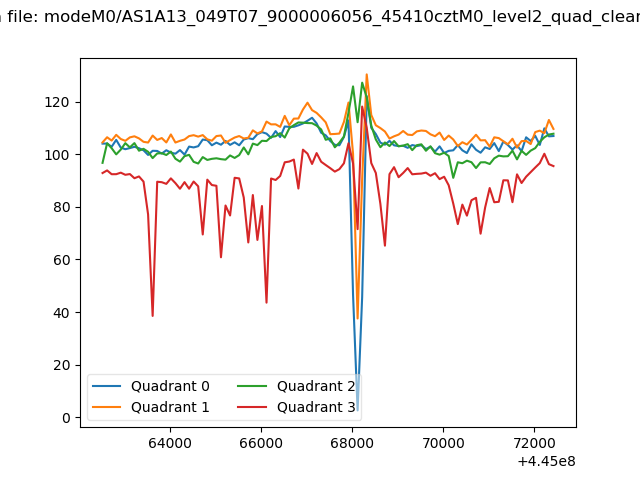 |
|
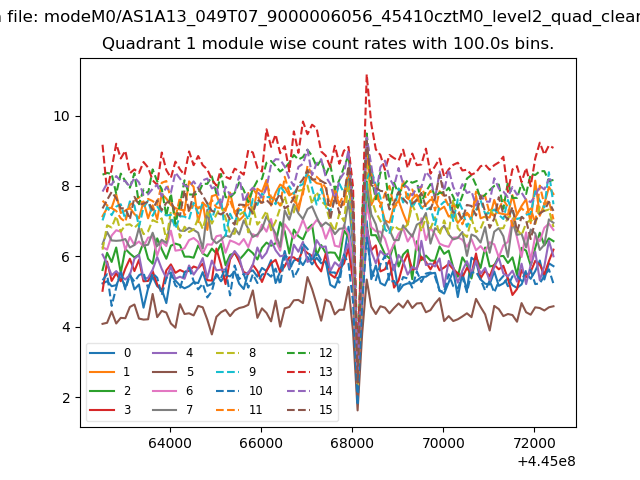
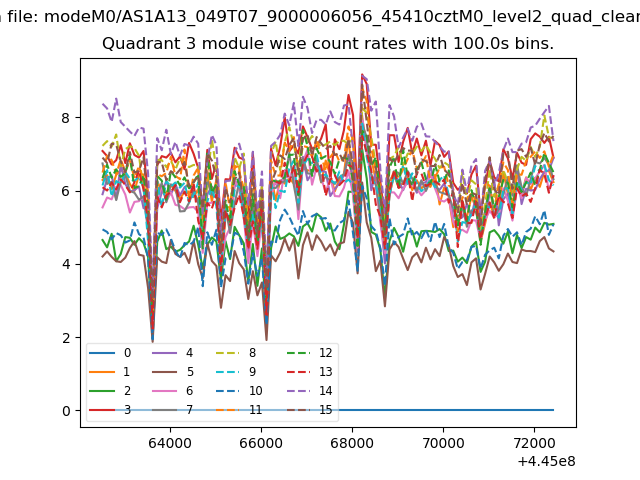
| Module-wise count rates for Quadrant A Data is divided into 100 sec bins |
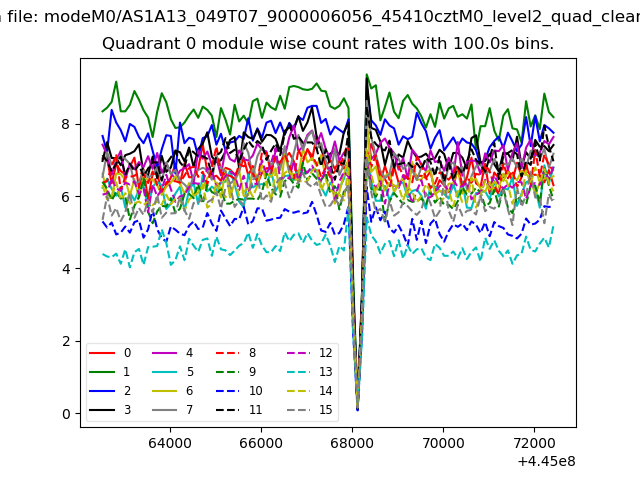 |
 |
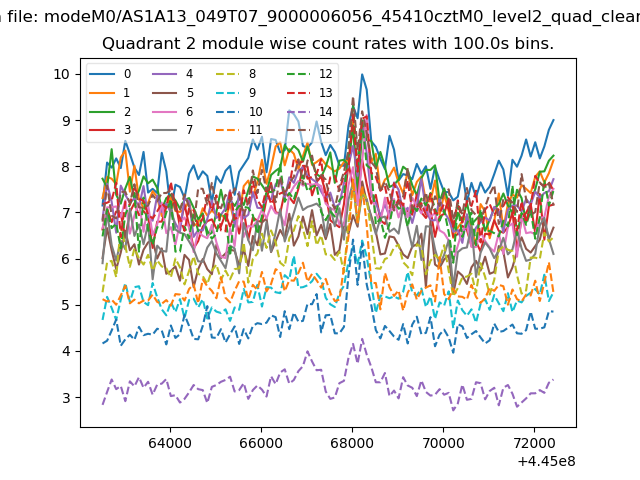
| Module-wise count rates for Quadrant B Data is divided into 100 sec bins |
 |
 |
| Module-wise count rates for Quadrant C Data is divided into 100 sec bins |
 |
 |
| Module-wise count rates for Quadrant D Data is divided into 100 sec bins |
 |
 |
| Parameter | Plot |
|---|---|
| CZT HV Monitor | 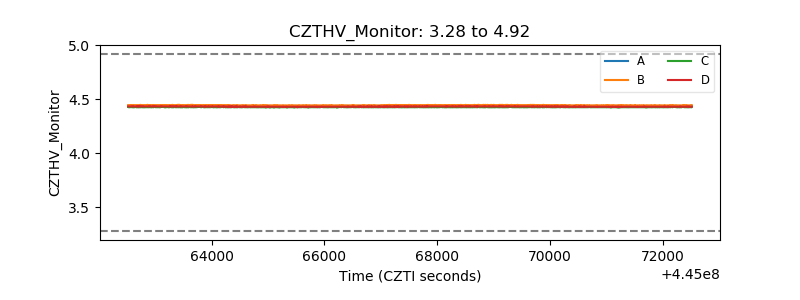 |
| D_VDD | 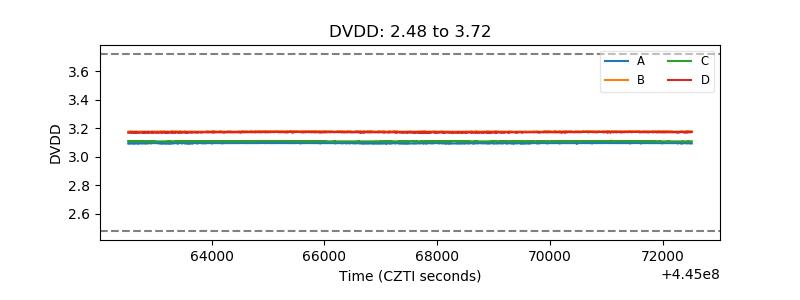 |
| Temperature 1 | 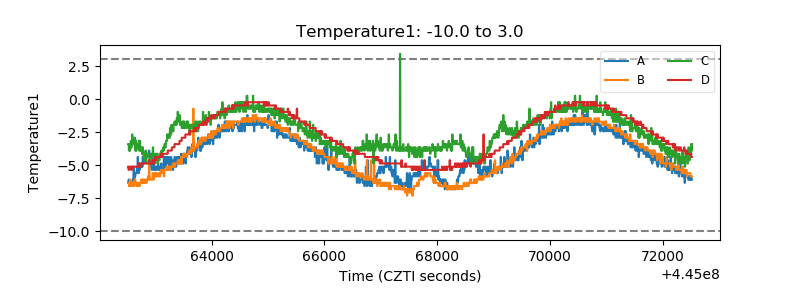 |
| Veto HV Monitor | 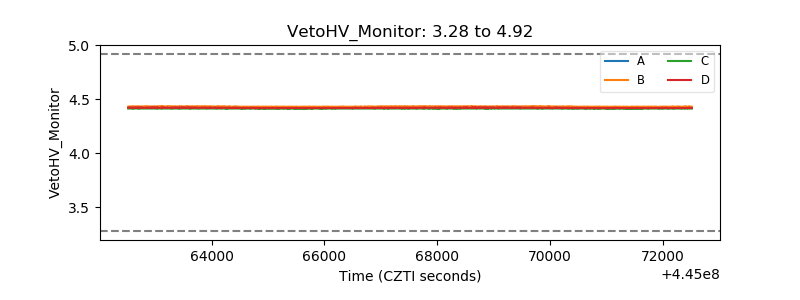 |
| Veto LLD | 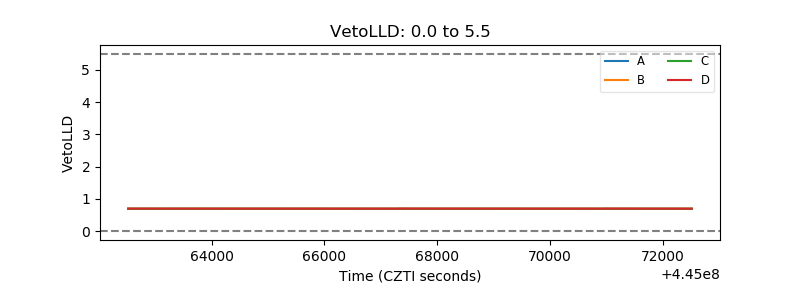 |
| Alpha Counter | 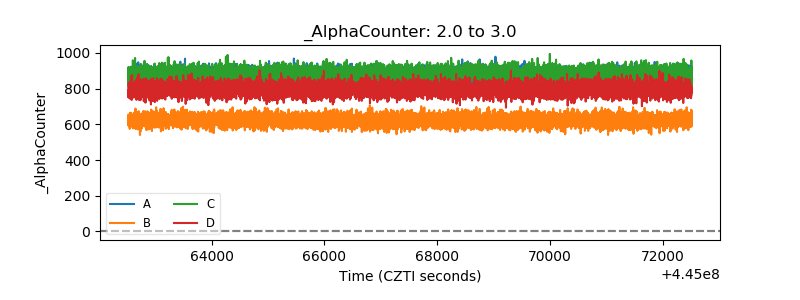 |
| _CPM_Rate | 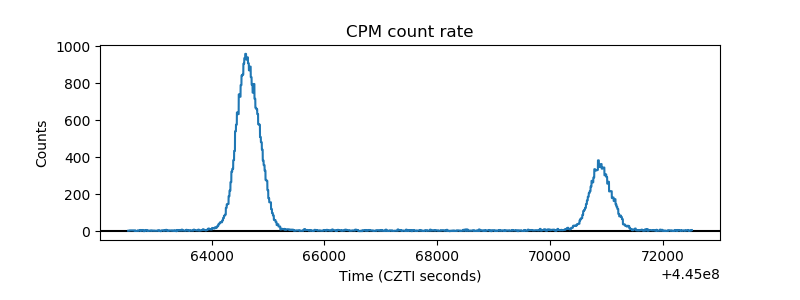 |
| CZT Counter | 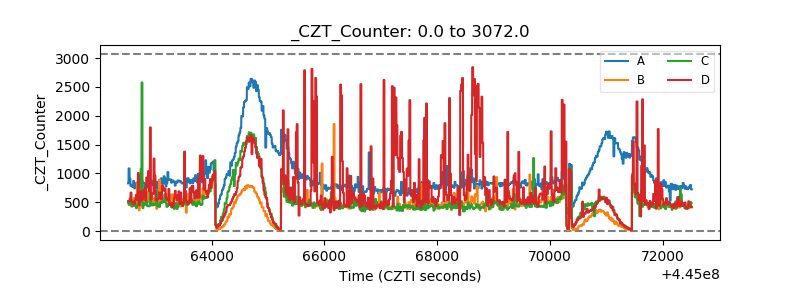 |
| +2.5 Volts monitor | 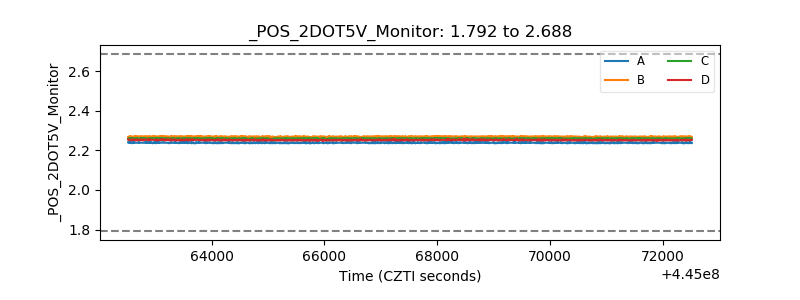 |
| +5 Volts monitor | 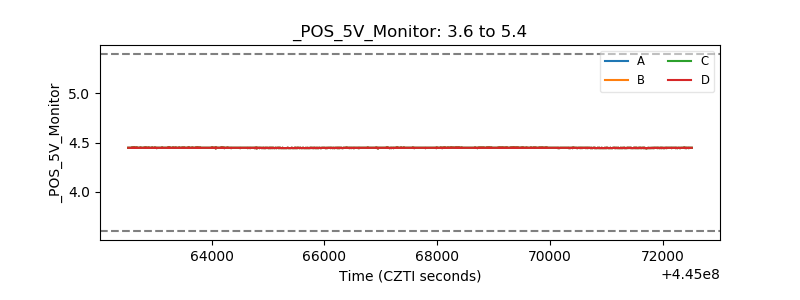 |
| _ROLL_ROT | 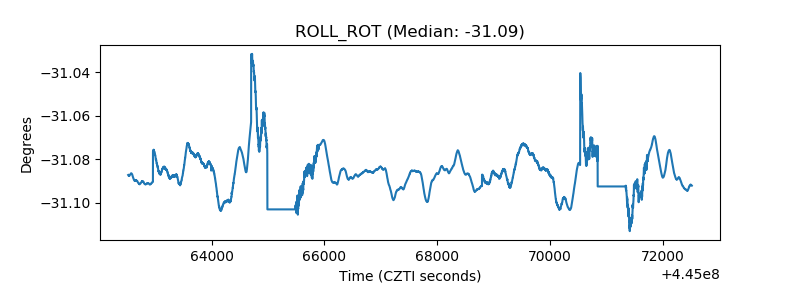 |
| _Roll_DEC | 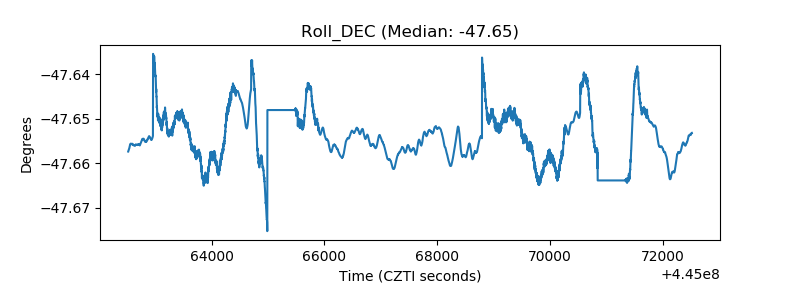 |
| _Roll_RA | 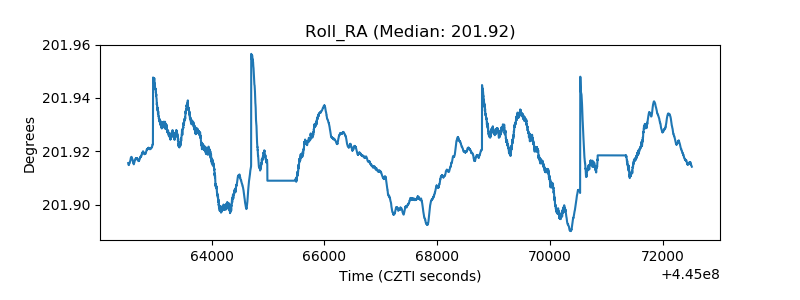 |
| Veto Counter | 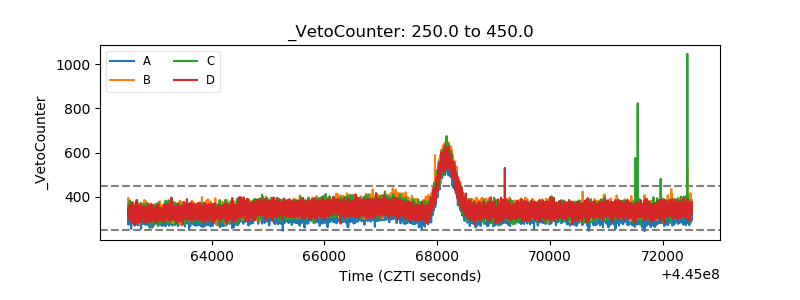 |