| Param | Original file | Final file |
|---|---|---|
| Filename | modeM0/AS1A13_049T07_9000006056_45411cztM0_level2.fits | modeM0/AS1A13_049T07_9000006056_45411cztM0_level2_quad_clean.evt |
| Size (bytes) | 1,111,803,840 | 236,462,400 |
| Size | 1.0 GB | 225.5 MB |
| Events in quadrant A | 12,840,393 | 1,567,832 |
| Events in quadrant B | 7,397,095 | 1,630,457 |
| Events in quadrant C | 7,158,356 | 1,561,936 |
| Events in quadrant D | 12,588,054 | 1,352,723 |
| Mode M0 | |||
|---|---|---|---|
| Quadrant | BADHDUFLAG | Total packets | Discarded packets |
| A | 0 | 48185 | 3 |
| B | 0 | 32296 | 3 |
| C | 0 | 32172 | 3 |
| D | 0 | 47864 | 8 |
| Mode M9 | |||
|---|---|---|---|
| Quadrant | BADHDUFLAG | Total packets | Discarded packets |
| A | 0 | 18 | 0 |
| B | 0 | 18 | 0 |
| C | 0 | 18 | 0 |
| D | 0 | 18 | 0 |
| Mode SS | |||
|---|---|---|---|
| Quadrant | BADHDUFLAG | Total packets | Discarded packets |
| A | 0 | 310 | 0 |
| B | 0 | 310 | 0 |
| C | 0 | 310 | 0 |
| D | 0 | 310 | 0 |
| Quadrant | Total seconds | Saturated seconds | Saturation percentage |
|---|---|---|---|
| A | 15154 | 548 | 3.616207% |
| B | 15154 | 403 | 2.659364% |
| C | 15155 | 265 | 1.748598% |
| D | 15152 | 1088 | 7.180570% |
Noise dominated data is calculated using 1-second bins in cleaned event files. If a bin has >2000 counts, and if more than 50% of those come from <1% of pixels, then it is considered to be noise-dominated and hence unusable.
| Quadrant | # 1 sec bins | Bins with >0 counts | Bins with >2000 counts | High rate bins dominated by noise | Noise dominated (total time) | Noise dominated (detector-on time) | Marked lightcurve |
|---|---|---|---|---|---|---|---|
| A | 16984 | 15154 | 101 | 101 | 0.59% | 0.67% | 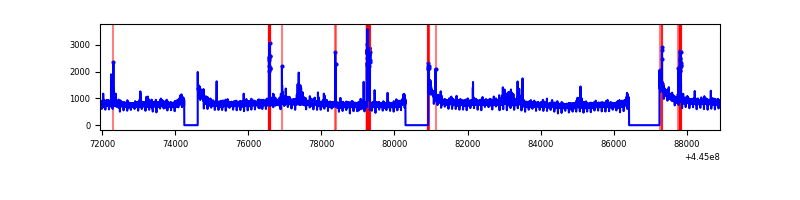 |
| B | 16984 | 15154 | 95 | 95 | 0.56% | 0.63% | 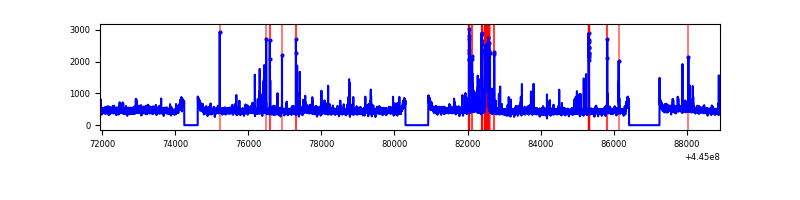 |
| C | 16985 | 15155 | 59 | 59 | 0.35% | 0.39% | 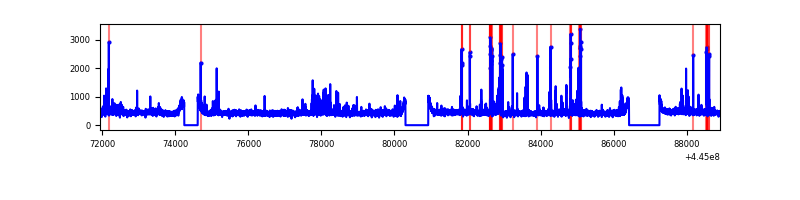 |
| D | 16984 | 15153 | 754 | 754 | 4.44% | 4.98% | 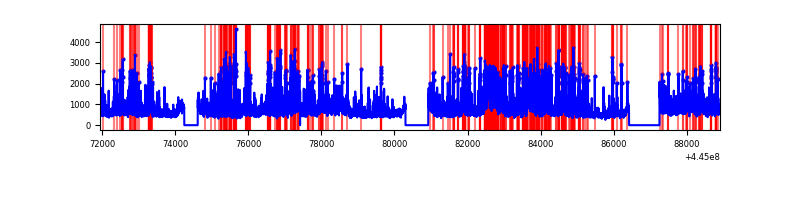 |
Top three noisy pixels from each quadrant. If the there are fewer than three noisy pixels in the level2.evt file, extra rows are filled as -1
| Pixel properties | Quadrant properties | ||||||
|---|---|---|---|---|---|---|---|
| Quadrant | DetID | PixID | Counts | Sigma | Mean | Median | Sigma |
| A | 10 | 83 | 5776084 | 16351.84 | 1706 | 1670 | 353.1 |
| A | 10 | 248 | 211323 | 593.69 | 1706 | 1670 | 353.1 |
| A | 9 | 191 | 94660 | 263.33 | 1706 | 1670 | 353.1 |
| B | 0 | 186 | 301986 | 889.22 | 1709 | 1655 | 337.7 |
| B | 15 | 201 | 104393 | 304.19 | 1709 | 1655 | 337.7 |
| B | 4 | 67 | 51785 | 148.43 | 1709 | 1655 | 337.7 |
| C | 0 | 239 | 291190 | 728.52 | 1687 | 1696 | 397.4 |
| C | 14 | 254 | 143763 | 357.52 | 1687 | 1696 | 397.4 |
| C | 14 | 96 | 64277 | 157.49 | 1687 | 1696 | 397.4 |
| D | 1 | 52 | 2702583 | 6564.11 | 1647 | 1594 | 411.5 |
| D | 11 | 241 | 1420785 | 3449.01 | 1647 | 1594 | 411.5 |
| D | 2 | 249 | 1049332 | 2546.28 | 1647 | 1594 | 411.5 |
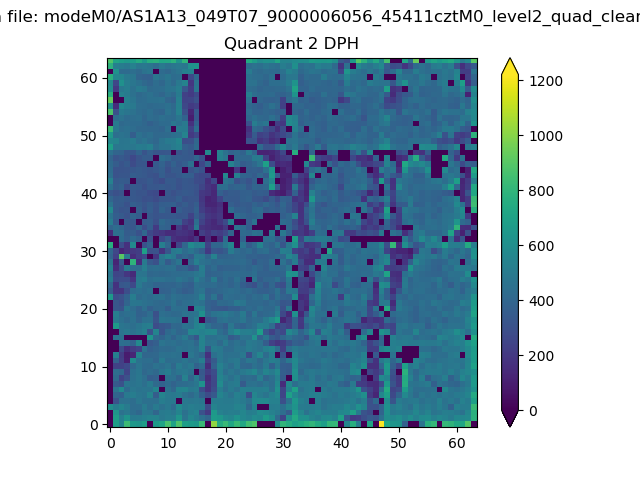
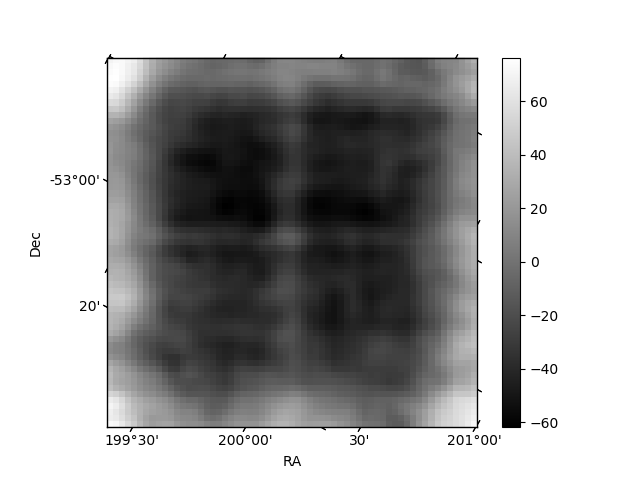
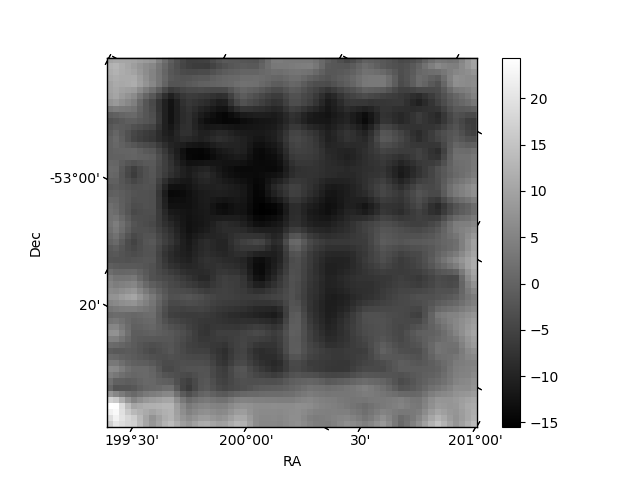
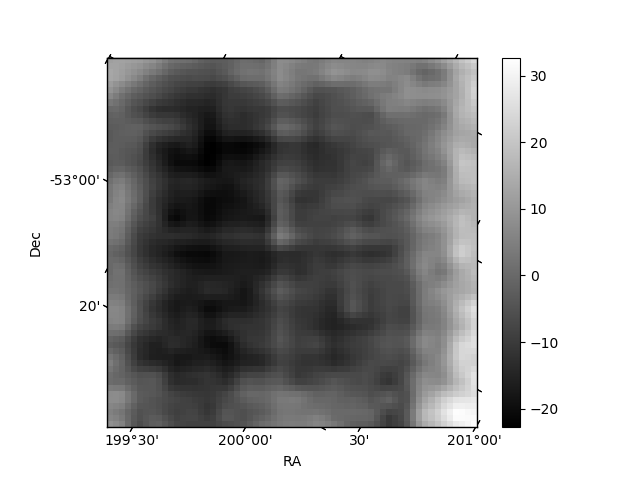
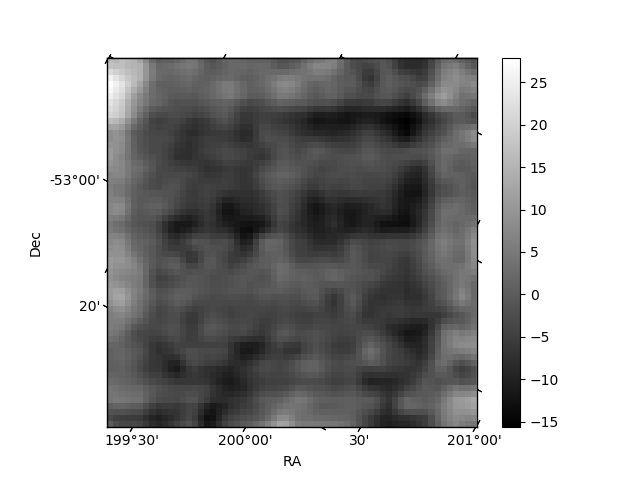
Histogram calculated using DETX and DETY for each event in the final _common_clean file
| Quadrant A | 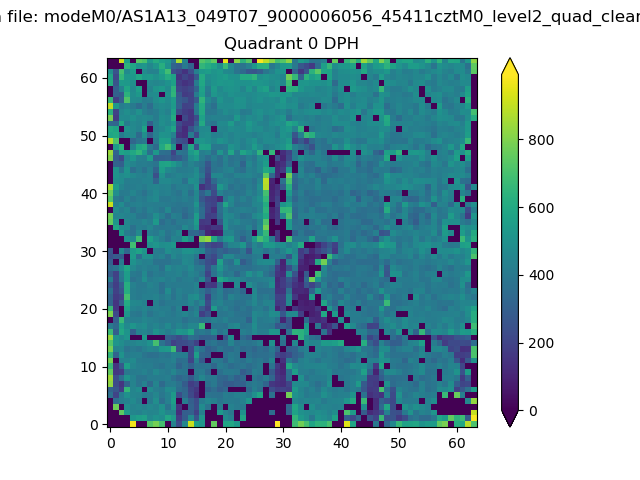 |
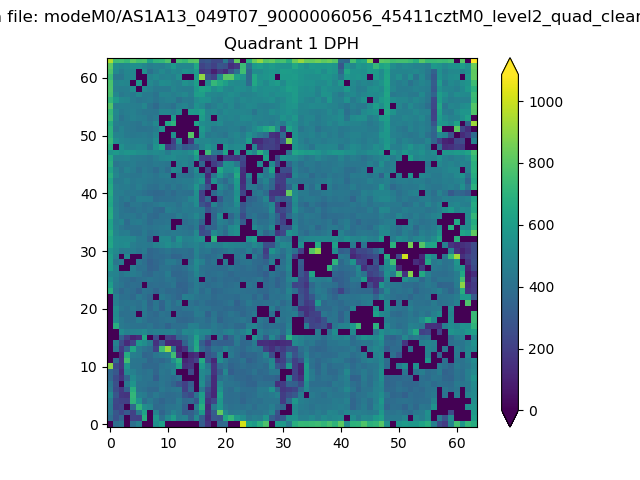 |
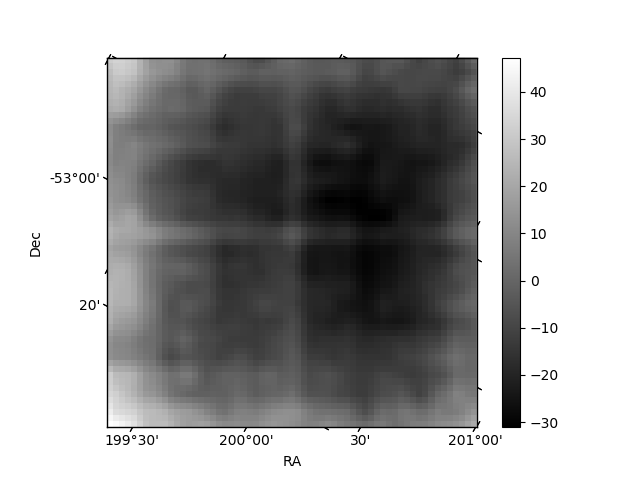
Quadrant B |
|---|---|---|---|
| Quadrant D | 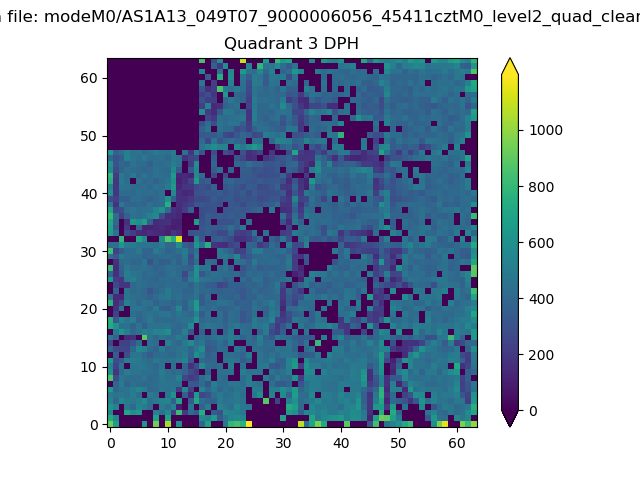 |
 |
Quadrant C |
| Plot type | Count rate plots | Images |
|---|---|---|
| Comparison with Poisson distribution Blue bars denote a histogram of data divided into 1 sec bins. Red curve is a Poisson curve with rate = median count rate of data. |
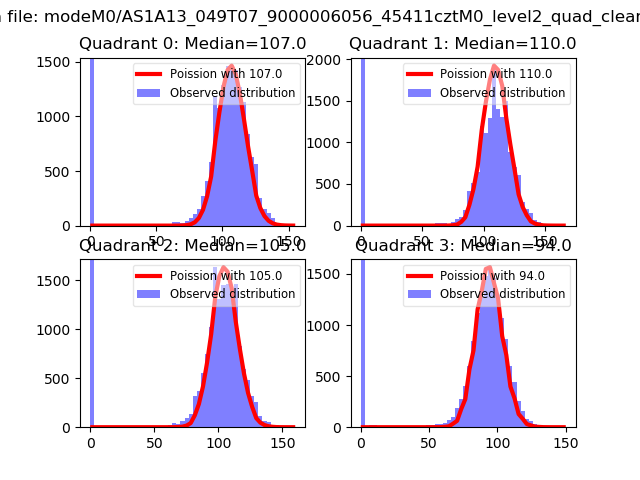 |
 |
| Quadrant-wise count rates Data is divided into 100 sec bins |
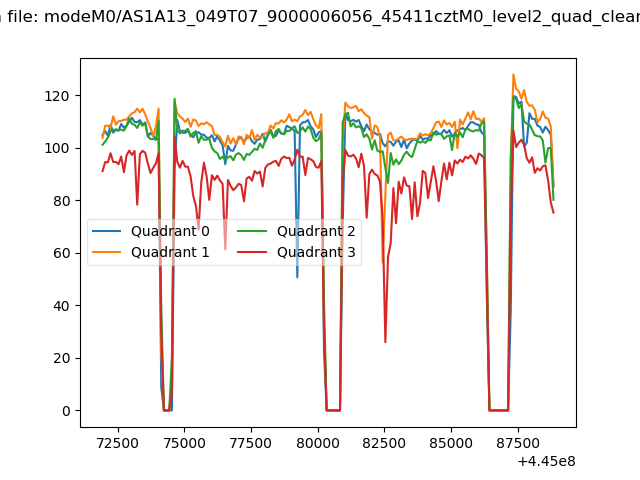 |
|
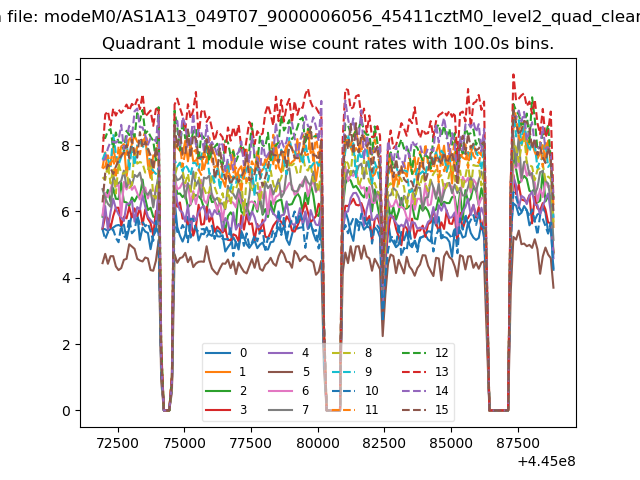
| Module-wise count rates for Quadrant A Data is divided into 100 sec bins |
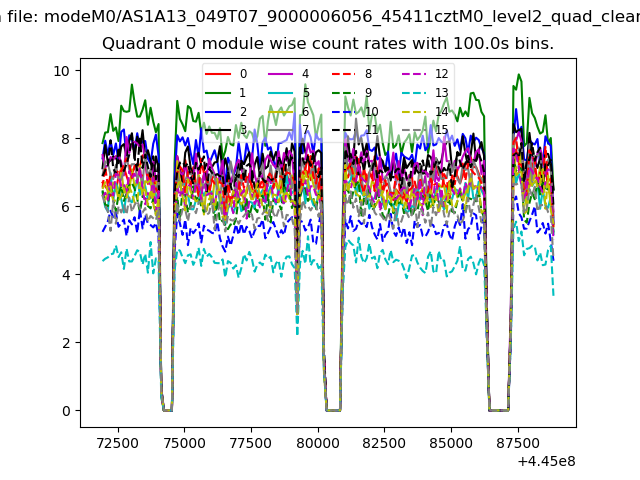 |
 |
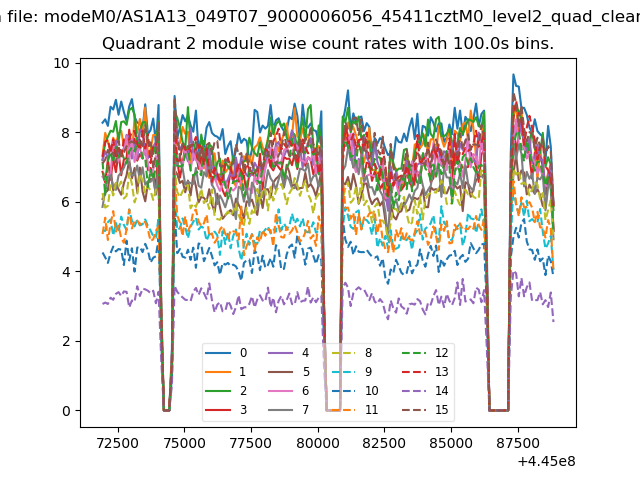
| Module-wise count rates for Quadrant B Data is divided into 100 sec bins |
 |
 |
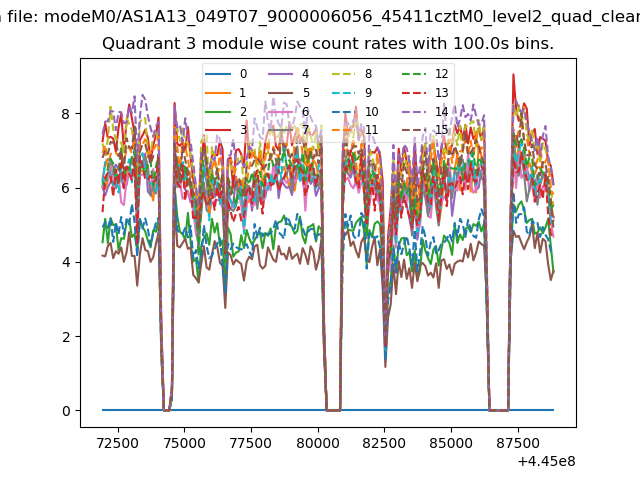
| Module-wise count rates for Quadrant C Data is divided into 100 sec bins |
 |
 |
| Module-wise count rates for Quadrant D Data is divided into 100 sec bins |
 |
 |
| Parameter | Plot |
|---|---|
| CZT HV Monitor | 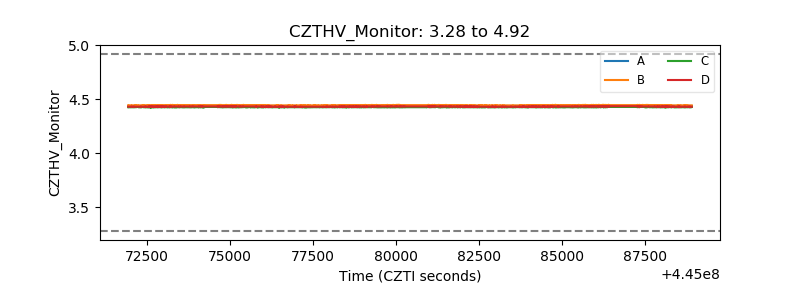 |
| D_VDD | 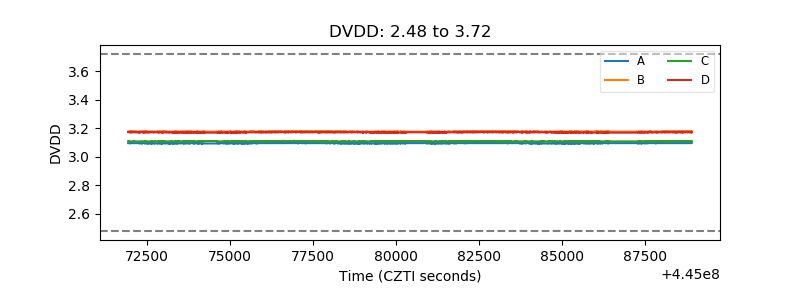 |
| Temperature 1 | 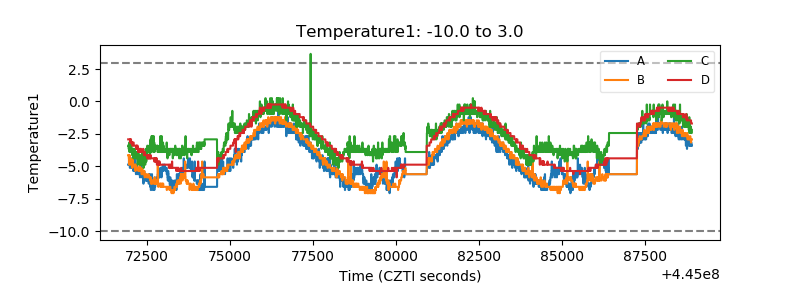 |
| Veto HV Monitor | 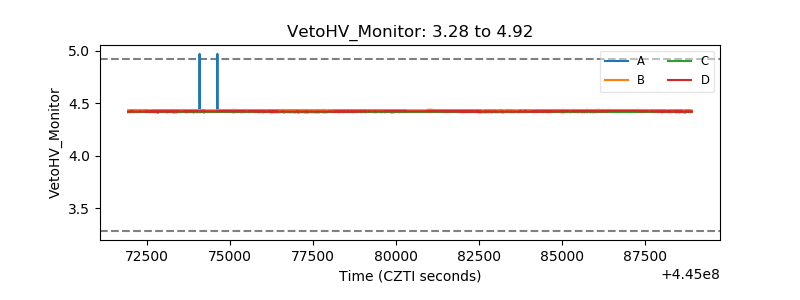 |
| Veto LLD | 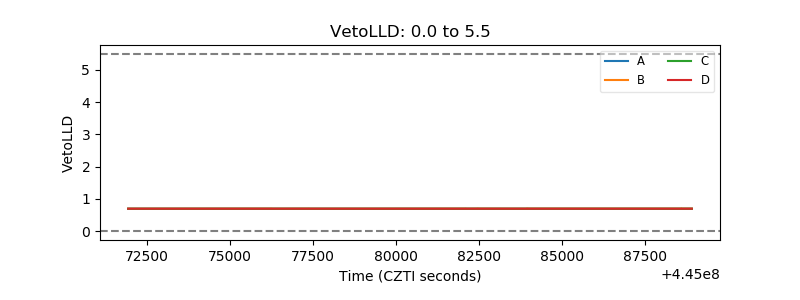 |
| Alpha Counter | 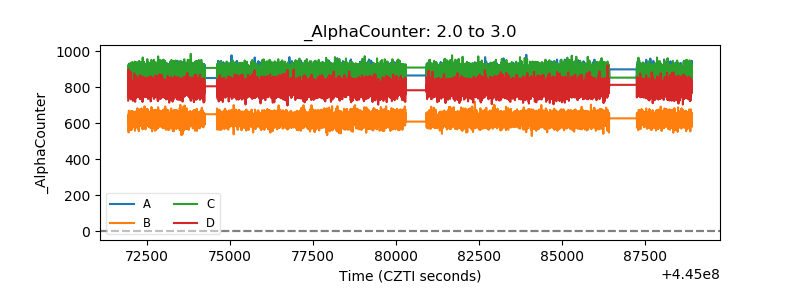 |
| _CPM_Rate | 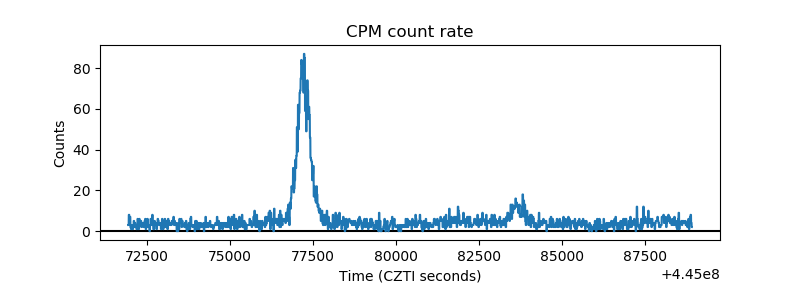 |
| CZT Counter | 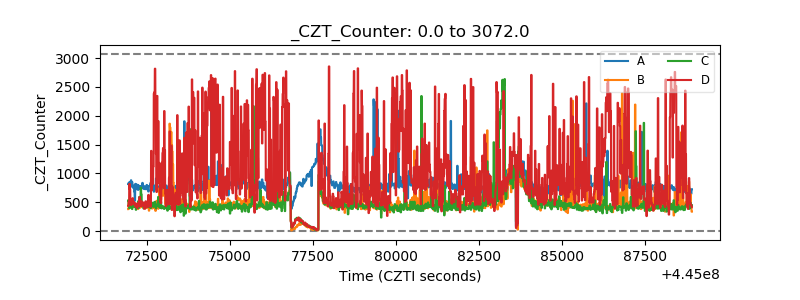 |
| +2.5 Volts monitor |  |
| +5 Volts monitor | 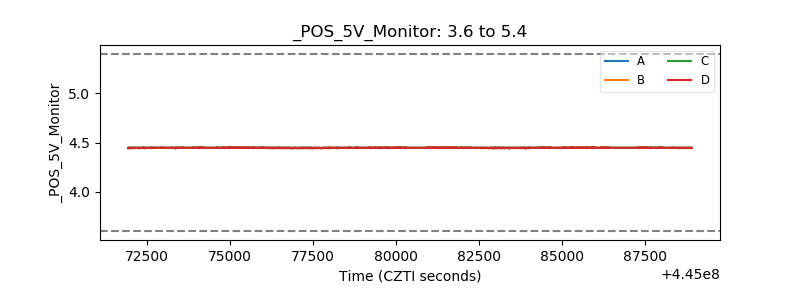 |
| _ROLL_ROT | 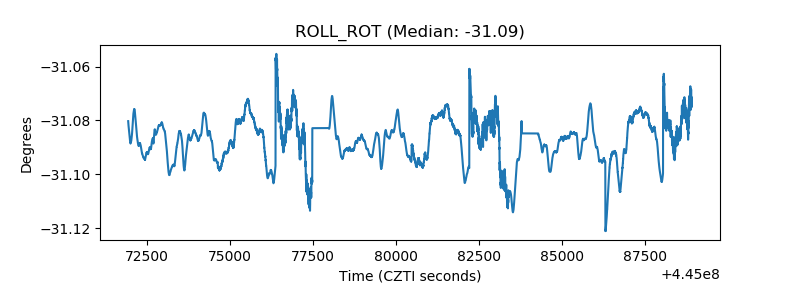 |
| _Roll_DEC | 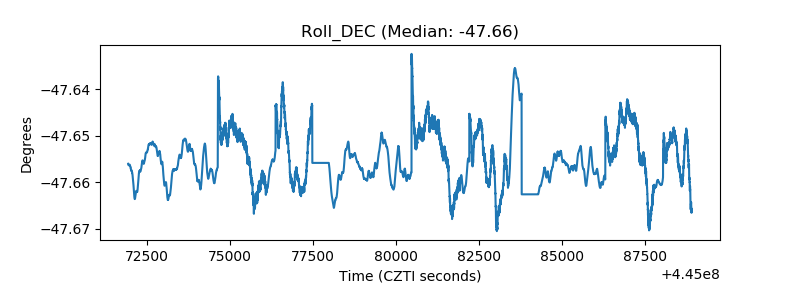 |
| _Roll_RA | 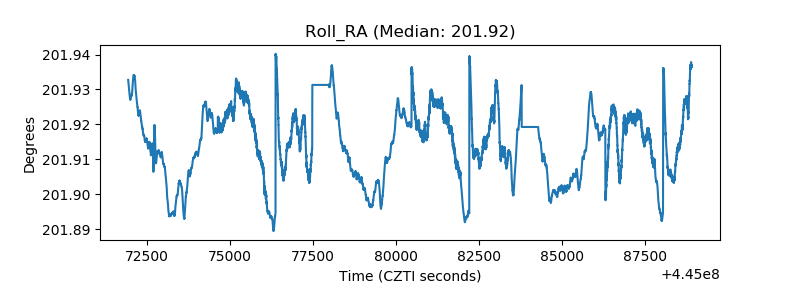 |
| Veto Counter | 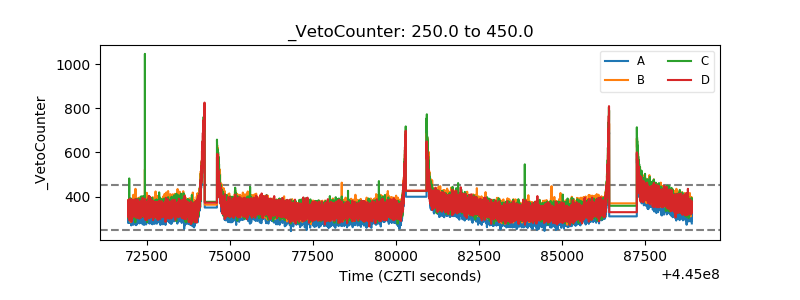 |