| Param | Original file | Final file |
|---|---|---|
| Filename | modeM0/AS1A13_049T07_9000006056_45413cztM0_level2.fits | modeM0/AS1A13_049T07_9000006056_45413cztM0_level2_quad_clean.evt |
| Size (bytes) | 411,978,240 | 86,143,680 |
| Size | 392.9 MB | 82.2 MB |
| Events in quadrant A | 4,511,325 | 572,994 |
| Events in quadrant B | 2,640,639 | 595,593 |
| Events in quadrant C | 2,547,857 | 569,557 |
| Events in quadrant D | 5,133,351 | 494,737 |
| Mode M0 | |||
|---|---|---|---|
| Quadrant | BADHDUFLAG | Total packets | Discarded packets |
| A | 0 | 17244 | 1 |
| B | 0 | 11544 | 1 |
| C | 0 | 11402 | 1 |
| D | 0 | 19049 | 1 |
| Mode M9 | |||
|---|---|---|---|
| Quadrant | BADHDUFLAG | Total packets | Discarded packets |
| A | 0 | 10 | 0 |
| B | 0 | 10 | 0 |
| C | 0 | 10 | 0 |
| D | 0 | 10 | 0 |
| Mode SS | |||
|---|---|---|---|
| Quadrant | BADHDUFLAG | Total packets | Discarded packets |
| A | 0 | 108 | 0 |
| B | 0 | 108 | 0 |
| C | 0 | 108 | 0 |
| D | 0 | 108 | 0 |
| Quadrant | Total seconds | Saturated seconds | Saturation percentage |
|---|---|---|---|
| A | 5365 | 187 | 3.485555% |
| B | 5365 | 133 | 2.479031% |
| C | 5366 | 78 | 1.453597% |
| D | 5366 | 429 | 7.994782% |
Noise dominated data is calculated using 1-second bins in cleaned event files. If a bin has >2000 counts, and if more than 50% of those come from <1% of pixels, then it is considered to be noise-dominated and hence unusable.
| Quadrant | # 1 sec bins | Bins with >0 counts | Bins with >2000 counts | High rate bins dominated by noise | Noise dominated (total time) | Noise dominated (detector-on time) | Marked lightcurve |
|---|---|---|---|---|---|---|---|
| A | 6330 | 5365 | 18 | 18 | 0.28% | 0.34% | 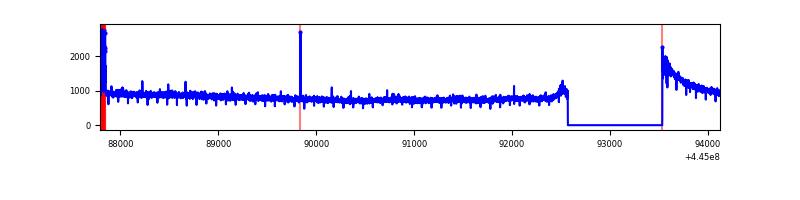 |
| B | 6330 | 5365 | 45 | 45 | 0.71% | 0.84% |  |
| C | 6331 | 5366 | 14 | 14 | 0.22% | 0.26% | 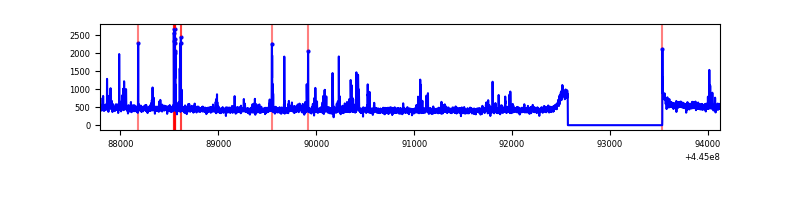 |
| D | 6331 | 5366 | 338 | 338 | 5.34% | 6.30% | 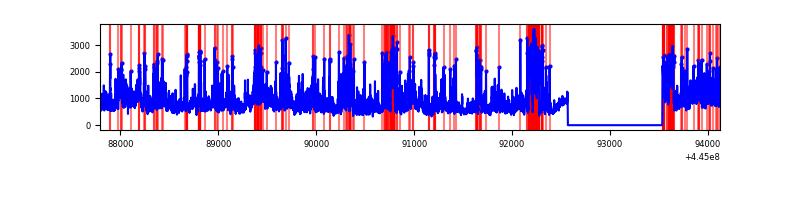 |
Top three noisy pixels from each quadrant. If the there are fewer than three noisy pixels in the level2.evt file, extra rows are filled as -1
| Pixel properties | Quadrant properties | ||||||
|---|---|---|---|---|---|---|---|
| Quadrant | DetID | PixID | Counts | Sigma | Mean | Median | Sigma |
| A | 10 | 83 | 2098509 | 16608.95 | 606 | 594 | 126.3 |
| A | 15 | 174 | 46534 | 363.7 | 606 | 594 | 126.3 |
| A | 9 | 191 | 16598 | 126.7 | 606 | 594 | 126.3 |
| B | 15 | 201 | 159198 | 1313.39 | 607 | 588 | 120.8 |
| B | 0 | 186 | 25582 | 206.97 | 607 | 588 | 120.8 |
| B | 12 | 111 | 15456 | 123.12 | 607 | 588 | 120.8 |
| C | 0 | 239 | 84787 | 592.23 | 602 | 603 | 142.1 |
| C | 14 | 254 | 82152 | 573.69 | 602 | 603 | 142.1 |
| C | 3 | 233 | 17645 | 119.89 | 602 | 603 | 142.1 |
| D | 1 | 52 | 1427390 | 9733.52 | 581 | 563 | 146.6 |
| D | 13 | 249 | 535237 | 3647.44 | 581 | 563 | 146.6 |
| D | 11 | 241 | 441093 | 3005.21 | 581 | 563 | 146.6 |
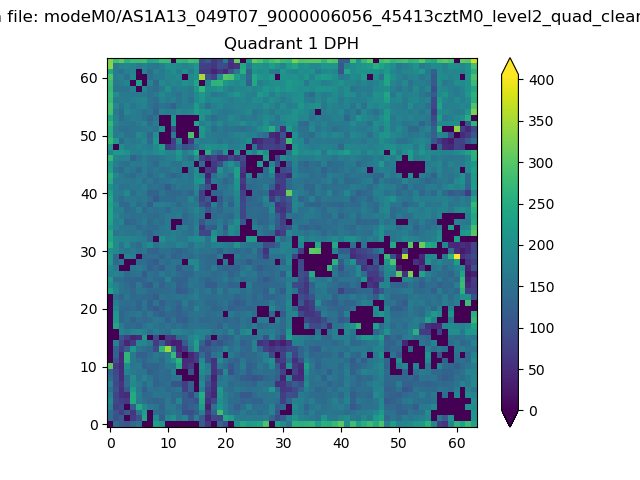
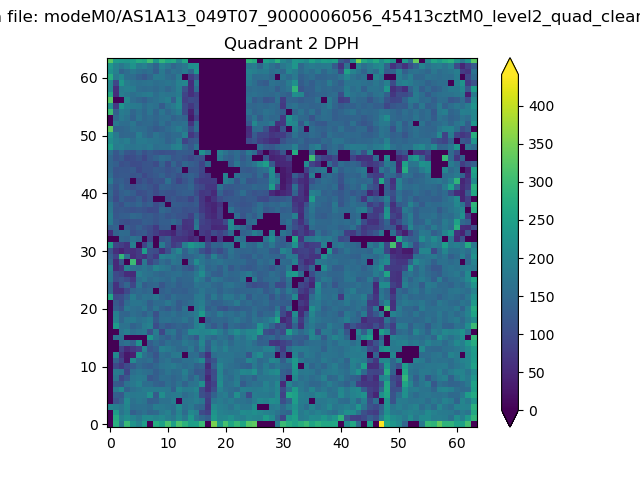
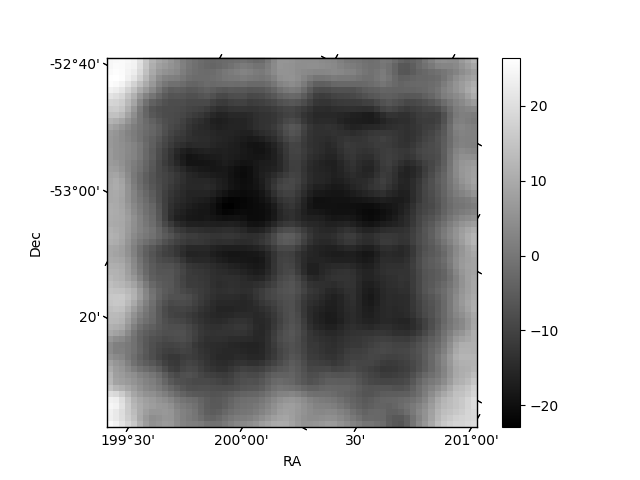
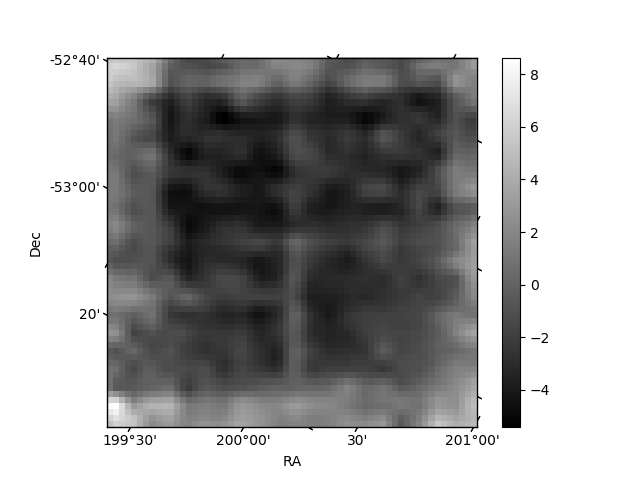
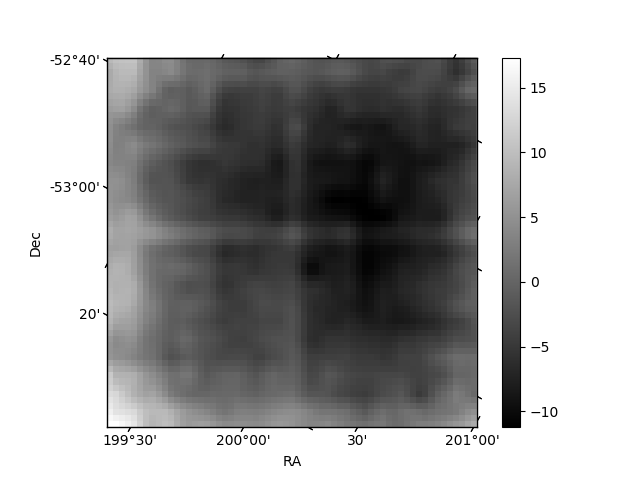
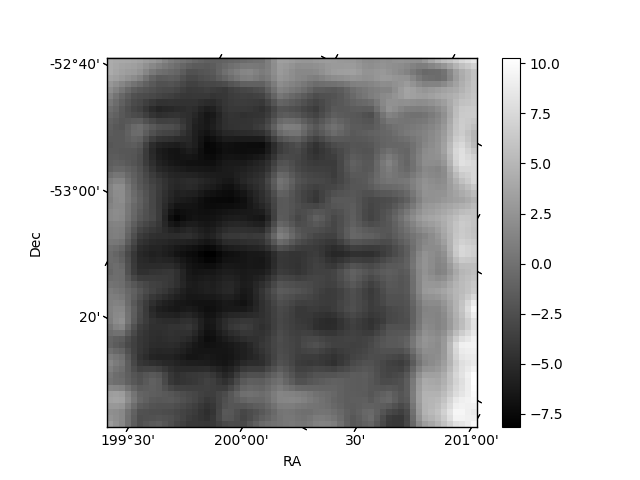
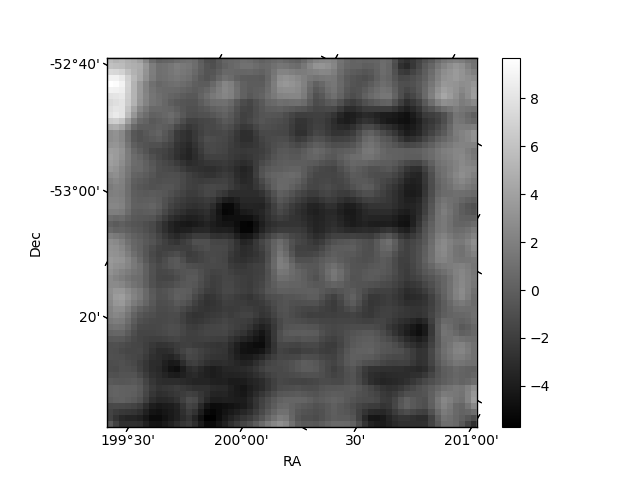
Histogram calculated using DETX and DETY for each event in the final _common_clean file
| Quadrant A | 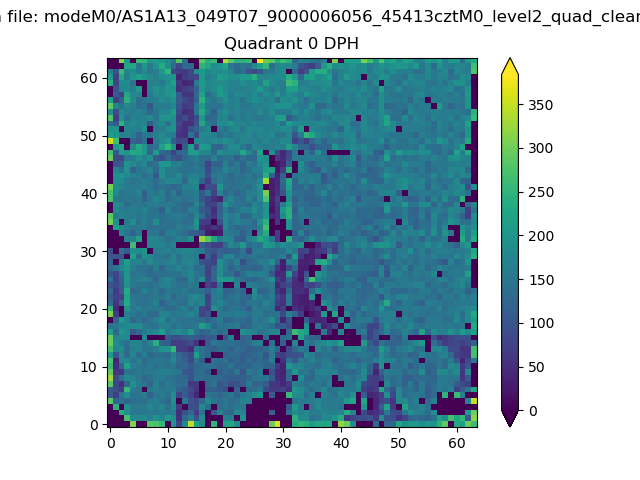 |
 |
Quadrant B |
|---|---|---|---|
| Quadrant D | 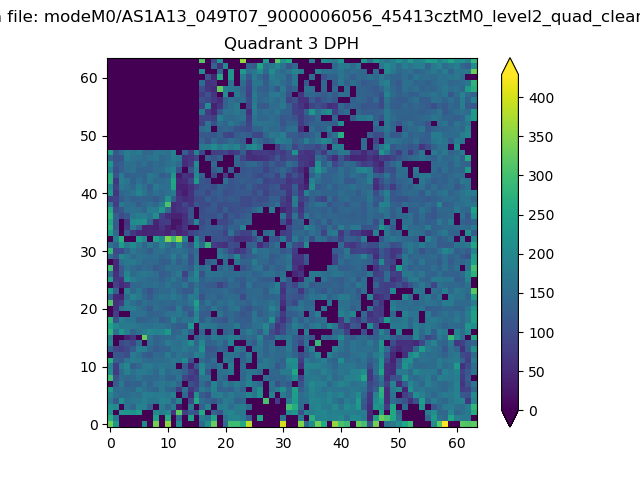 |
 |
Quadrant C |
| Plot type | Count rate plots | Images |
|---|---|---|
| Comparison with Poisson distribution Blue bars denote a histogram of data divided into 1 sec bins. Red curve is a Poisson curve with rate = median count rate of data. |
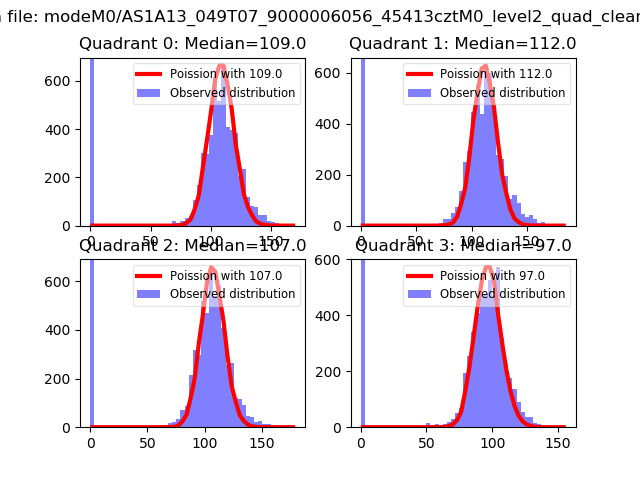 |
 |
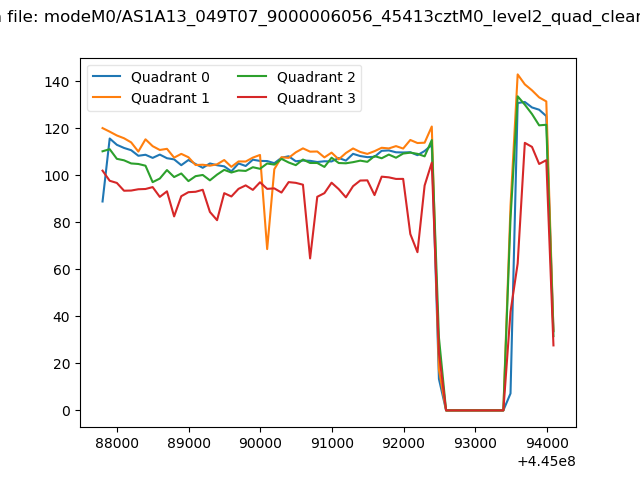
| Quadrant-wise count rates Data is divided into 100 sec bins |
 |
|
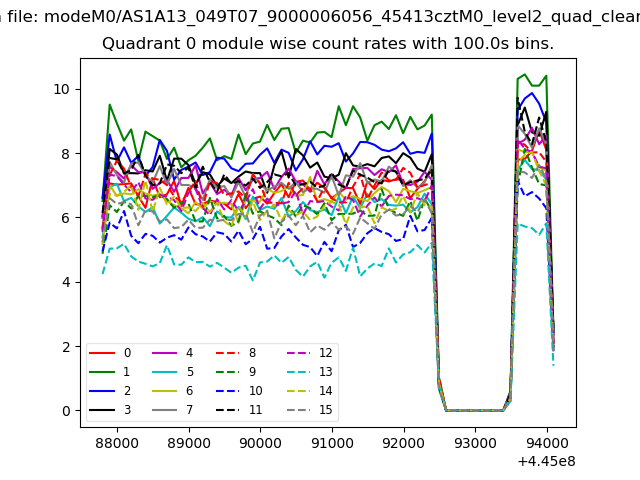
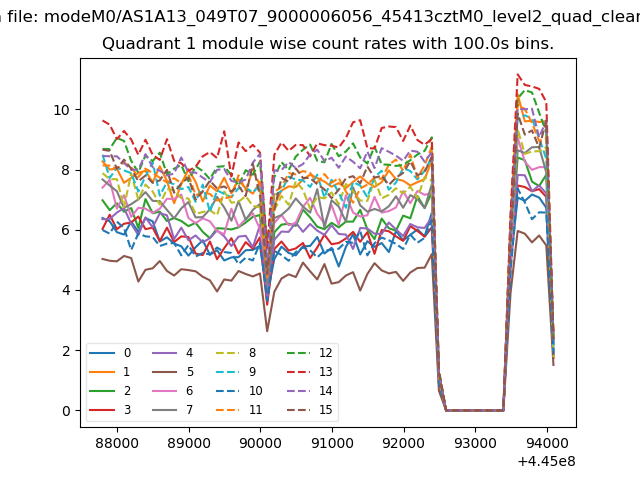
| Module-wise count rates for Quadrant A Data is divided into 100 sec bins |
 |
 |
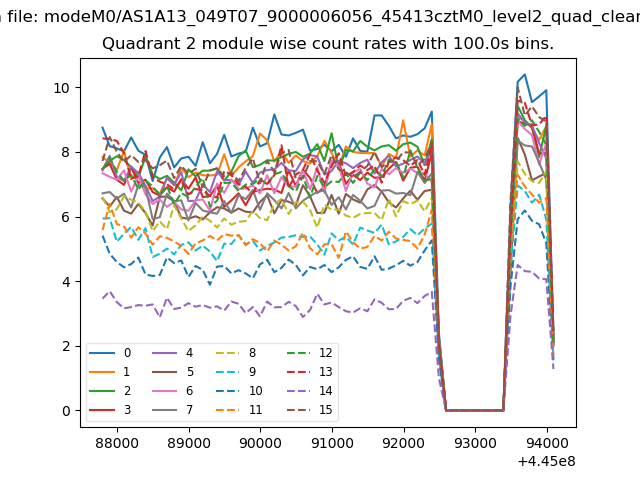
| Module-wise count rates for Quadrant B Data is divided into 100 sec bins |
 |
 |
| Module-wise count rates for Quadrant C Data is divided into 100 sec bins |
 |
 |
| Module-wise count rates for Quadrant D Data is divided into 100 sec bins |
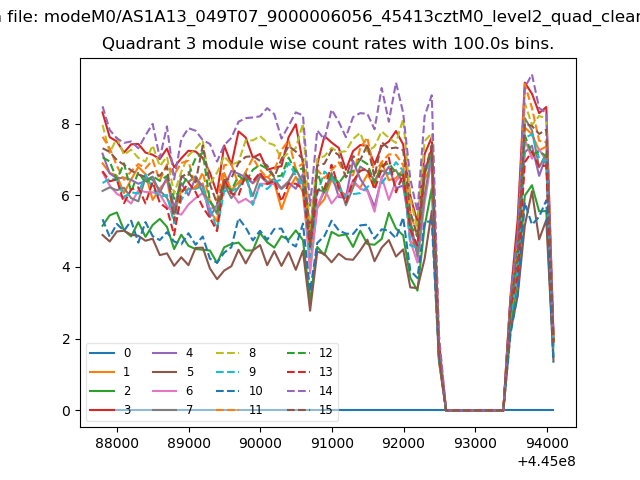 |
 |
| Parameter | Plot |
|---|---|
| CZT HV Monitor | 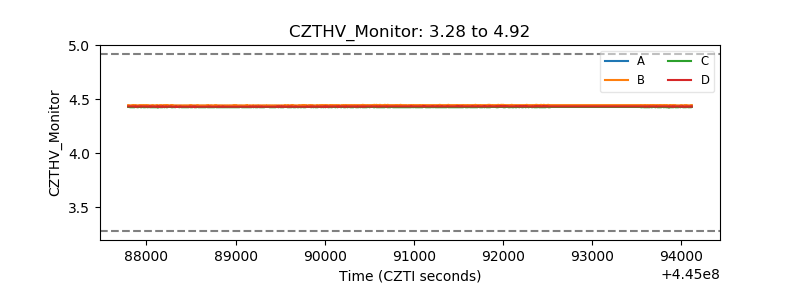 |
| D_VDD | 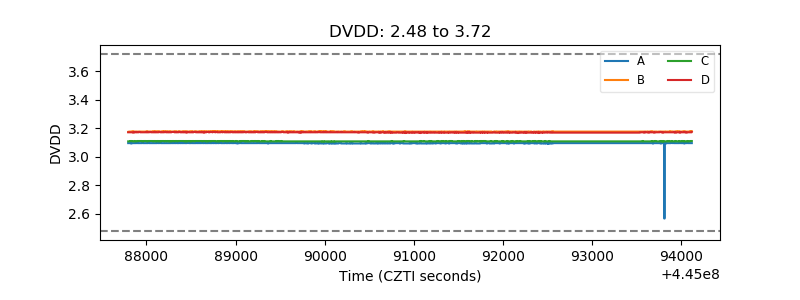 |
| Temperature 1 | 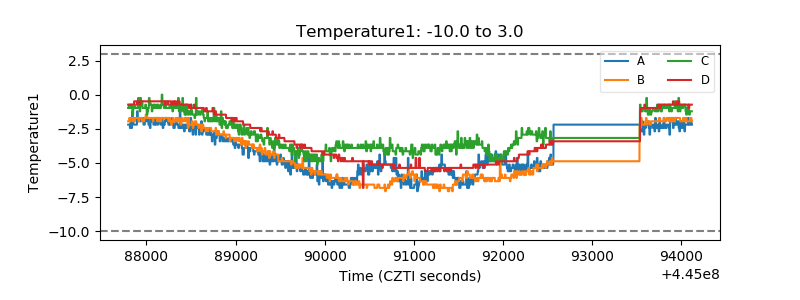 |
| Veto HV Monitor | 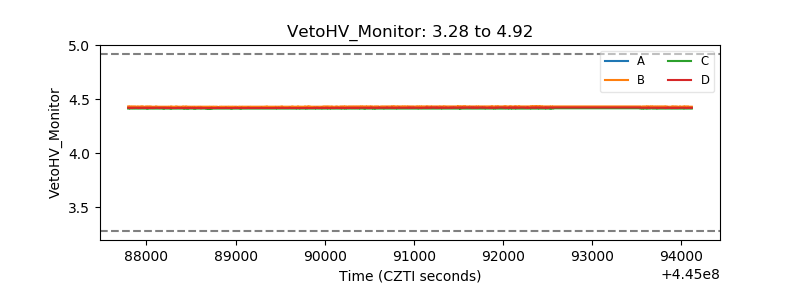 |
| Veto LLD | 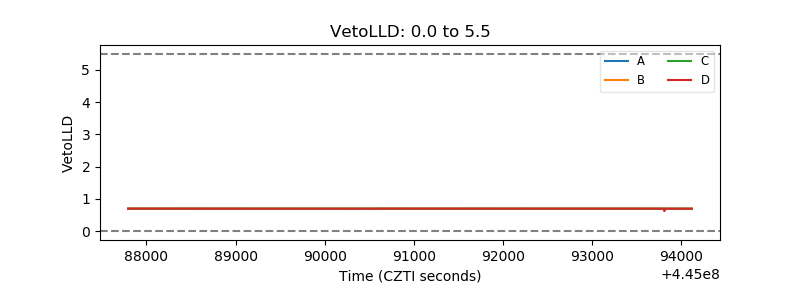 |
| Alpha Counter | 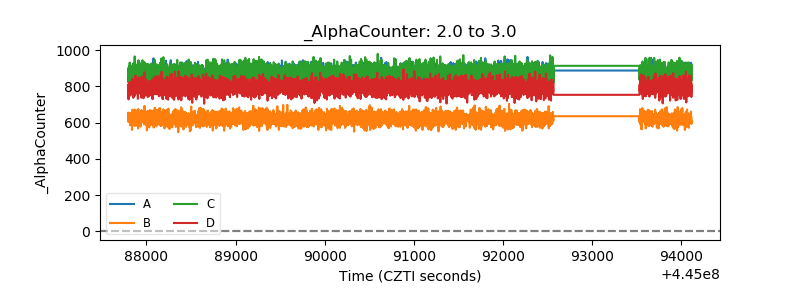 |
| _CPM_Rate | 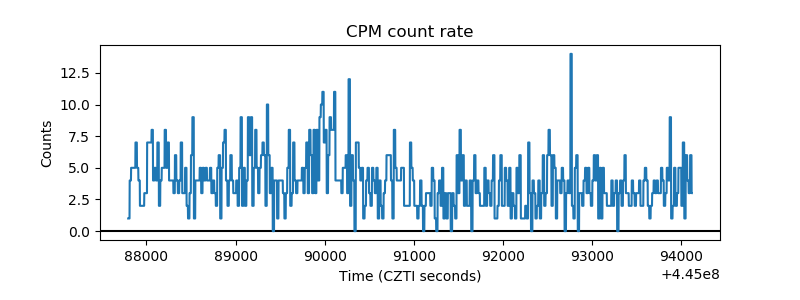 |
| CZT Counter | 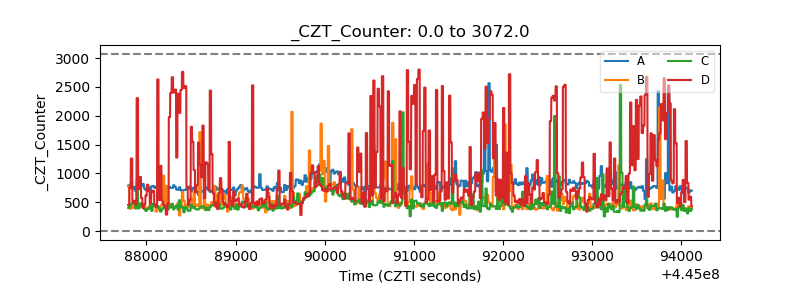 |
| +2.5 Volts monitor | 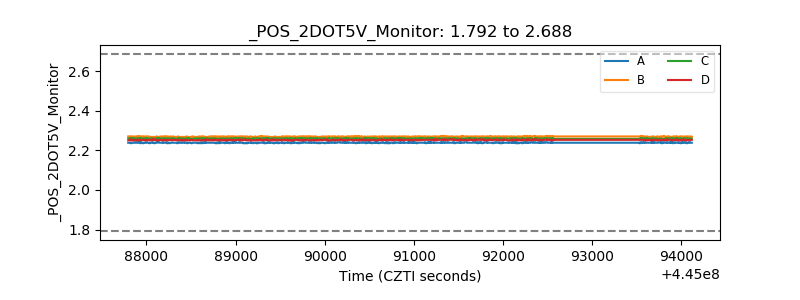 |
| +5 Volts monitor | 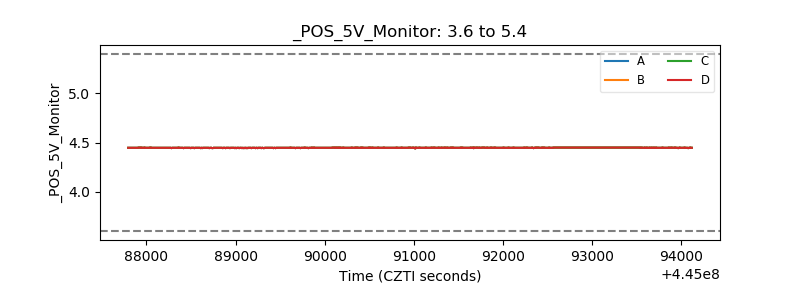 |
| _ROLL_ROT | 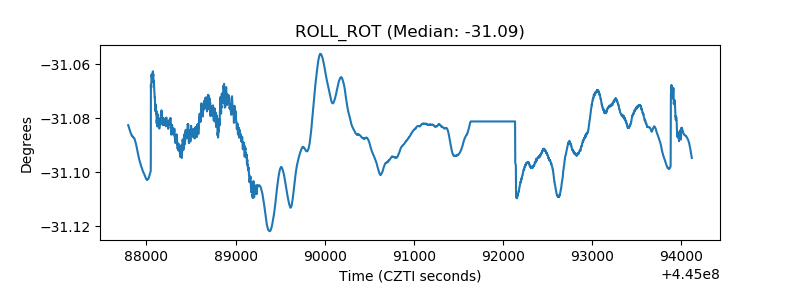 |
| _Roll_DEC | 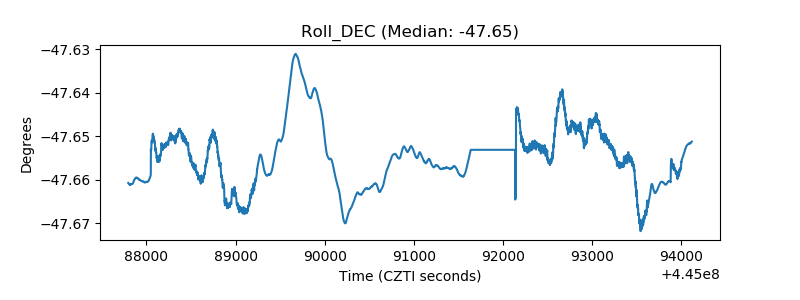 |
| _Roll_RA | 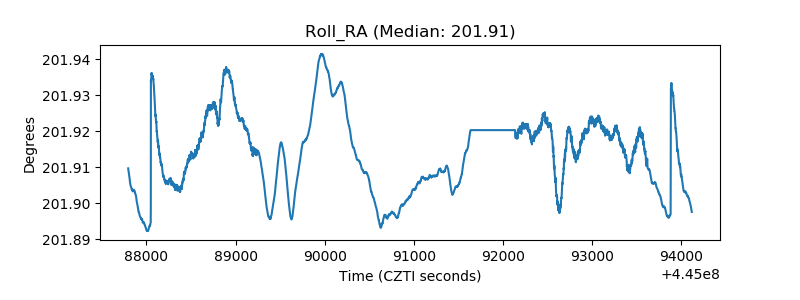 |
| Veto Counter | 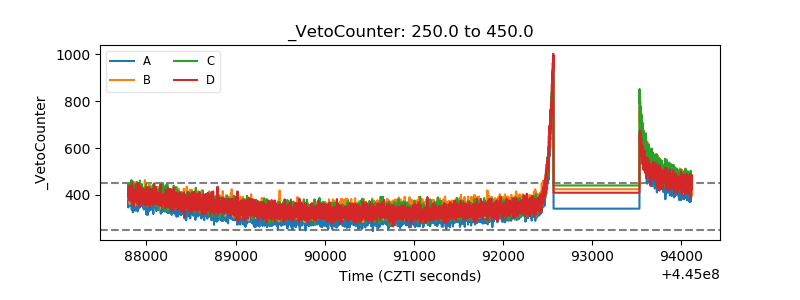 |