| Param | Original file | Final file |
|---|---|---|
| Filename | modeM0/AS1A13_038T03_9000006058_45233cztM0_level2.fits | modeM0/AS1A13_038T03_9000006058_45233cztM0_level2_quad_clean.evt |
| Size (bytes) | 264,525,120 | 51,177,600 |
| Size | 252.3 MB | 48.8 MB |
| Events in quadrant A | 2,750,010 | 341,131 |
| Events in quadrant B | 1,720,312 | 363,293 |
| Events in quadrant C | 1,645,677 | 356,493 |
| Events in quadrant D | 3,422,558 | 257,782 |
| Mode M0 | |||
|---|---|---|---|
| Quadrant | BADHDUFLAG | Total packets | Discarded packets |
| A | 0 | 11129 | 672 |
| B | 0 | 7726 | 421 |
| C | 0 | 7448 | 338 |
| D | 0 | 13521 | 1225 |
| Mode SS | |||
|---|---|---|---|
| Quadrant | BADHDUFLAG | Total packets | Discarded packets |
| A | 0 | 70 | 2 |
| B | 0 | 70 | 0 |
| C | 0 | 68 | 0 |
| D | 0 | 70 | 0 |
| Quadrant | Total seconds | Saturated seconds | Saturation percentage |
|---|---|---|---|
| A | 3228 | 121 | 3.748451% |
| B | 3265 | 45 | 1.378254% |
| C | 3278 | 5 | 0.152532% |
| D | 3168 | 646 | 20.391414% |
Noise dominated data is calculated using 1-second bins in cleaned event files. If a bin has >2000 counts, and if more than 50% of those come from <1% of pixels, then it is considered to be noise-dominated and hence unusable.
| Quadrant | # 1 sec bins | Bins with >0 counts | Bins with >2000 counts | High rate bins dominated by noise | Noise dominated (total time) | Noise dominated (detector-on time) | Marked lightcurve |
|---|---|---|---|---|---|---|---|
| A | 3480 | 3410 | 35 | 35 | 1.01% | 1.03% | 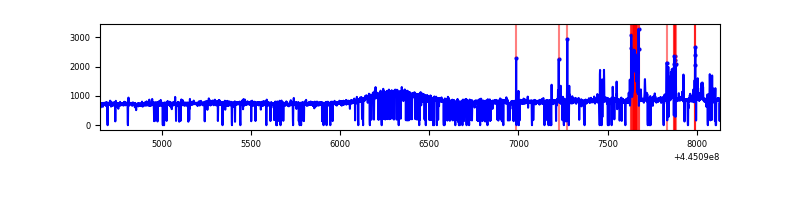 |
| B | 3480 | 3418 | 12 | 12 | 0.34% | 0.35% | 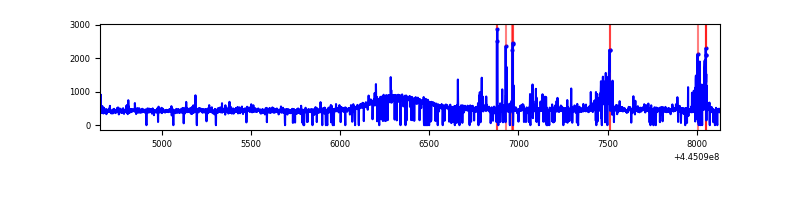 |
| C | 3480 | 3412 | 2 | 2 | 0.06% | 0.06% | 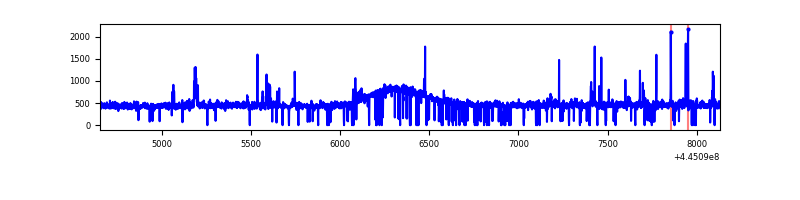 |
| D | 3479 | 3350 | 566 | 566 | 16.27% | 16.90% | 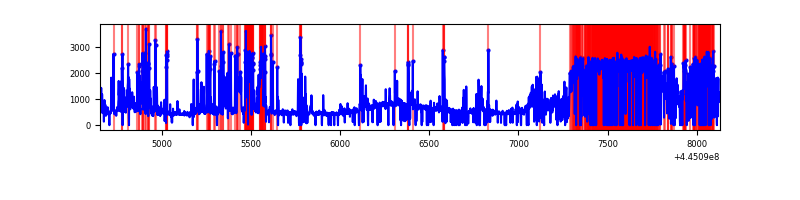 |
Top three noisy pixels from each quadrant. If the there are fewer than three noisy pixels in the level2.evt file, extra rows are filled as -1
| Pixel properties | Quadrant properties | ||||||
|---|---|---|---|---|---|---|---|
| Quadrant | DetID | PixID | Counts | Sigma | Mean | Median | Sigma |
| A | 10 | 83 | 1081208 | 12777.41 | 393 | 384 | 84.6 |
| A | 13 | 248 | 143487 | 1691.75 | 393 | 384 | 84.6 |
| A | 3 | 137 | 4754 | 51.66 | 393 | 384 | 84.6 |
| B | 15 | 36 | 48521 | 590.41 | 395 | 383 | 81.5 |
| B | 5 | 255 | 36971 | 448.75 | 395 | 383 | 81.5 |
| B | 5 | 32 | 30964 | 375.08 | 395 | 383 | 81.5 |
| C | 14 | 254 | 36077 | 374.64 | 396 | 400 | 95.2 |
| C | 12 | 2 | 29508 | 305.66 | 396 | 400 | 95.2 |
| C | 3 | 233 | 17581 | 180.42 | 396 | 400 | 95.2 |
| D | 4 | 232 | 1068307 | 11464.84 | 360 | 349 | 93.2 |
| D | 13 | 249 | 442740 | 4749.2 | 360 | 349 | 93.2 |
| D | 7 | 96 | 120252 | 1287.19 | 360 | 349 | 93.2 |
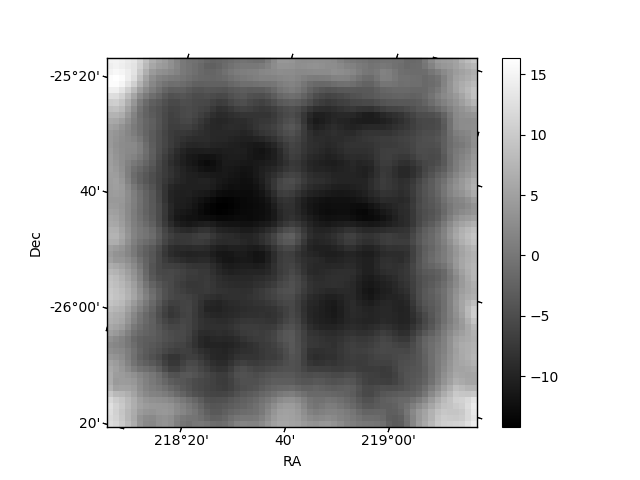
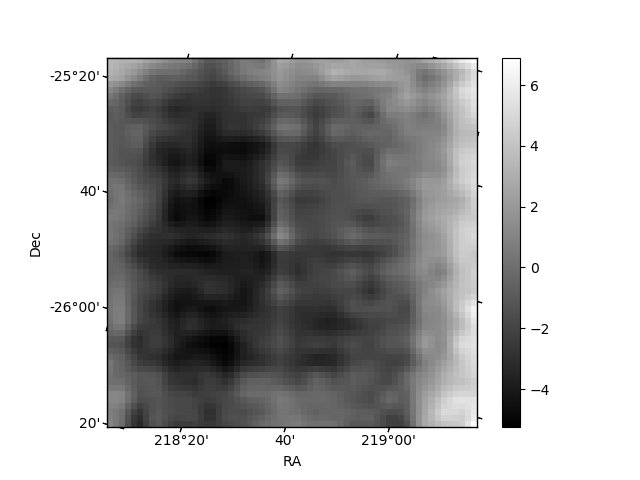
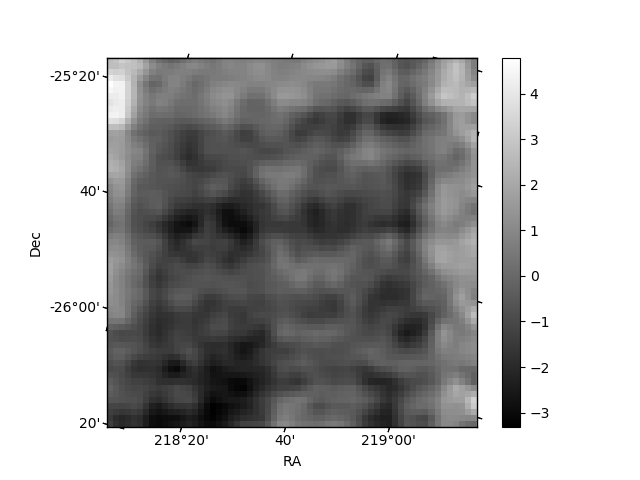
Histogram calculated using DETX and DETY for each event in the final _common_clean file
| Quadrant A | 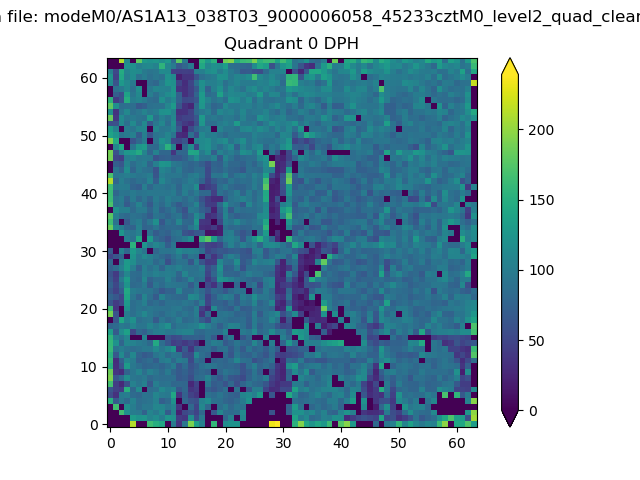 |
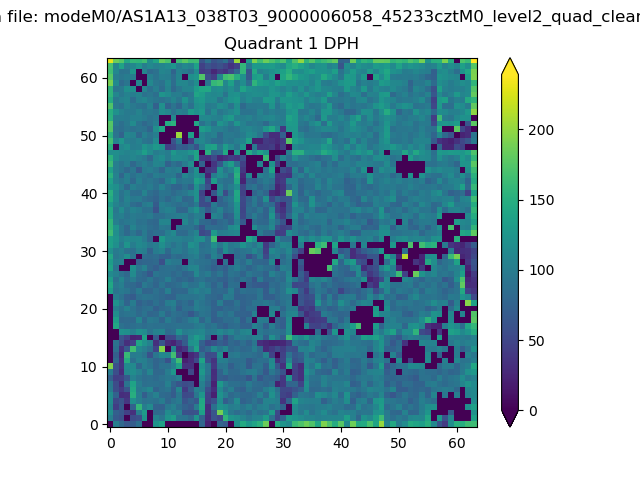 |
Quadrant B |
|---|---|---|---|
| Quadrant D | 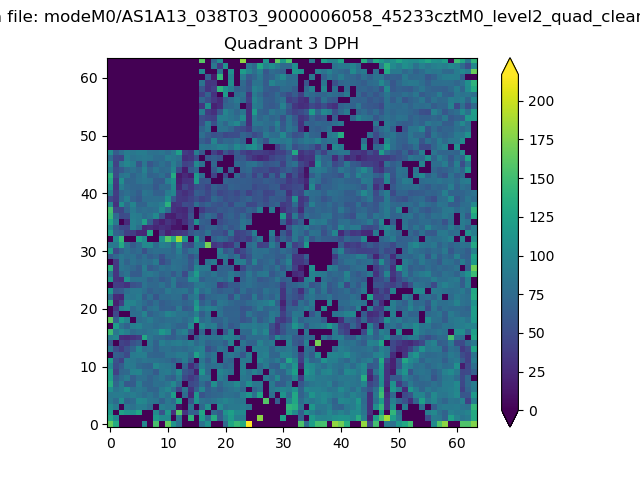 |
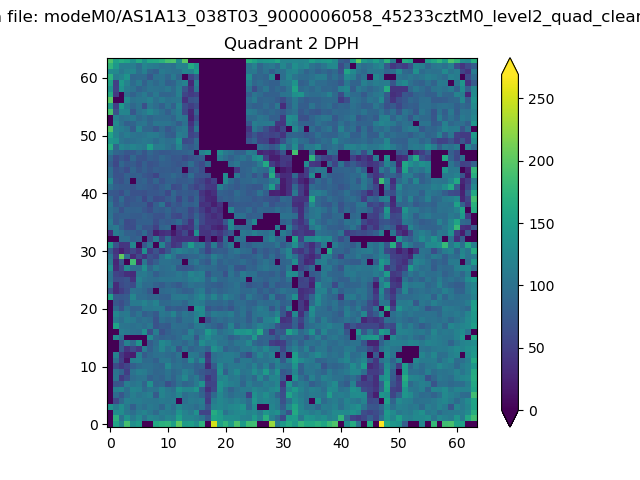 |
Quadrant C |
| Plot type | Count rate plots | Images |
|---|---|---|
| Comparison with Poisson distribution Blue bars denote a histogram of data divided into 1 sec bins. Red curve is a Poisson curve with rate = median count rate of data. |
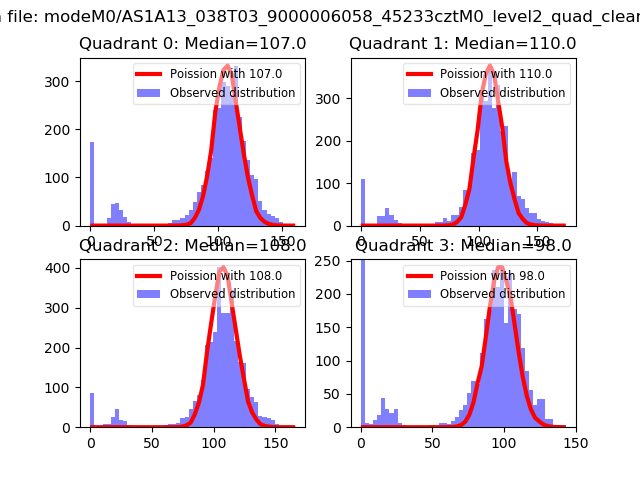 |
 |
| Quadrant-wise count rates Data is divided into 100 sec bins |
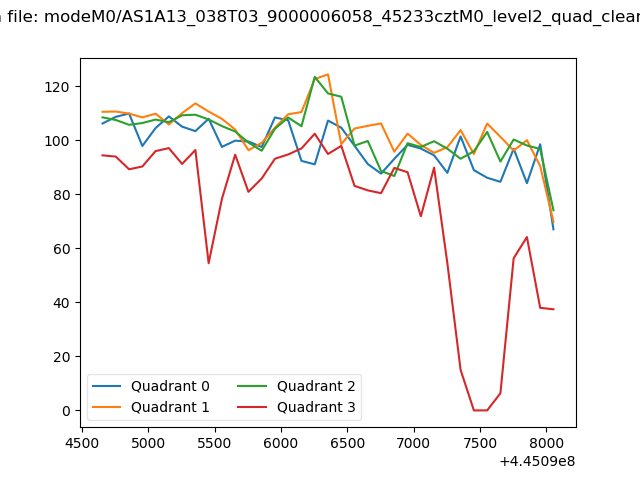 |
|
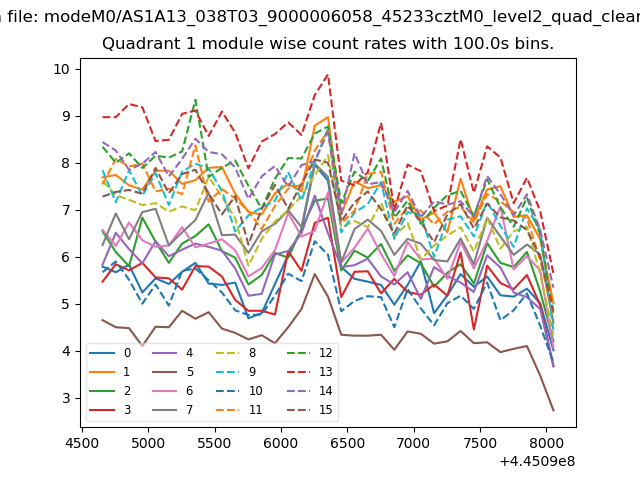
| Module-wise count rates for Quadrant A Data is divided into 100 sec bins |
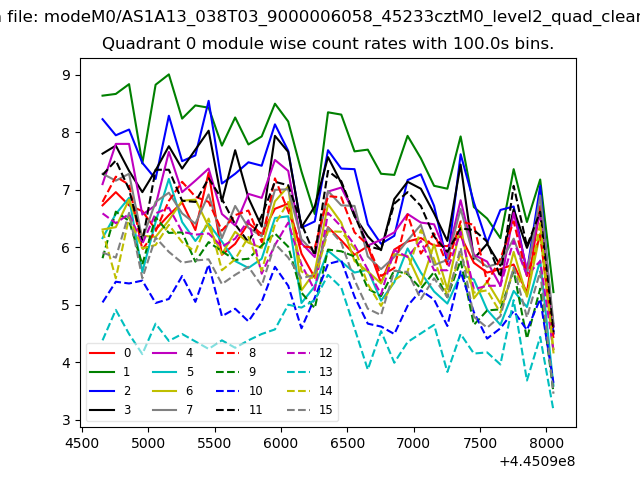 |
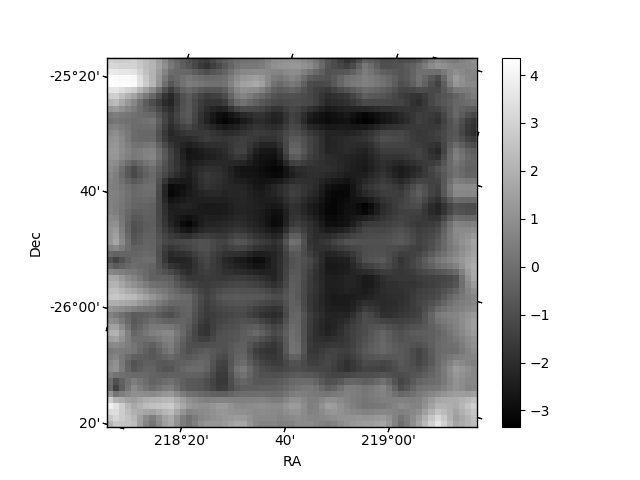 |
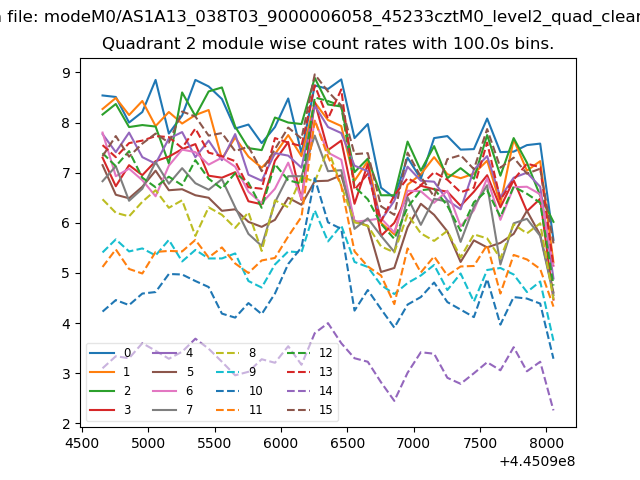
| Module-wise count rates for Quadrant B Data is divided into 100 sec bins |
 |
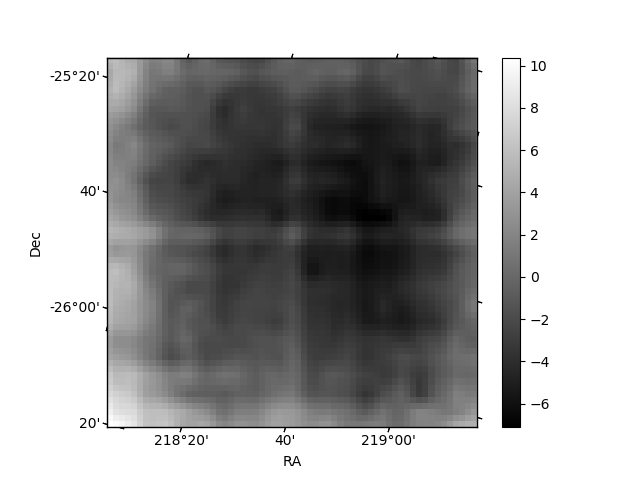 |
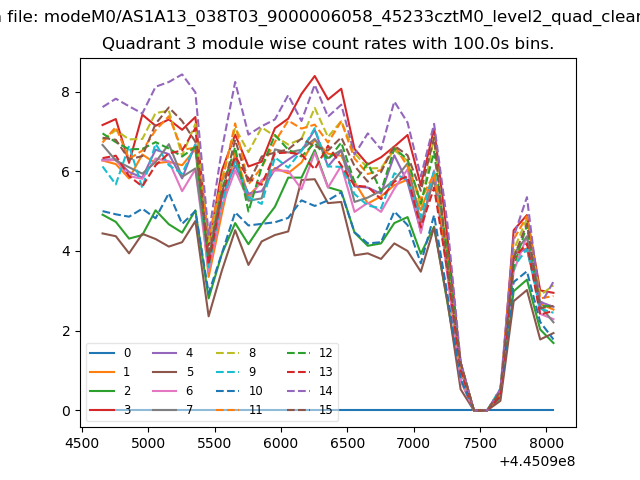
| Module-wise count rates for Quadrant C Data is divided into 100 sec bins |
 |
 |
| Module-wise count rates for Quadrant D Data is divided into 100 sec bins |
 |
 |
| Parameter | Plot |
|---|---|
| CZT HV Monitor | 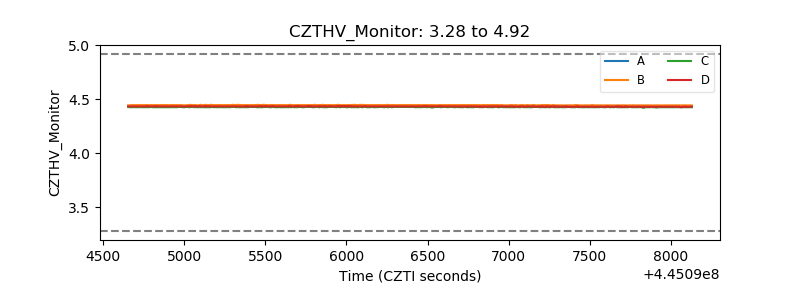 |
| D_VDD | 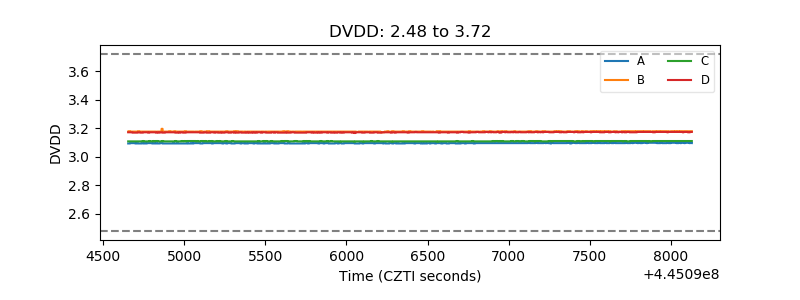 |
| Temperature 1 | 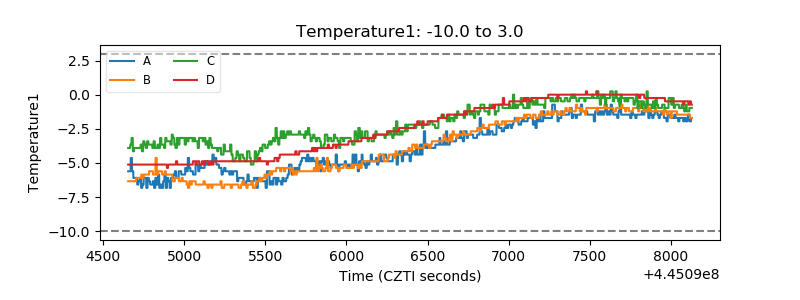 |
| Veto HV Monitor | 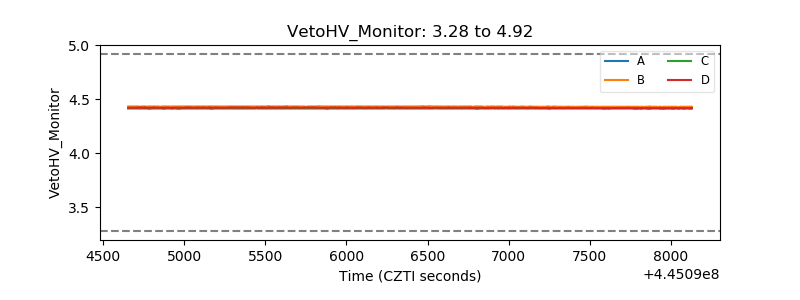 |
| Veto LLD | 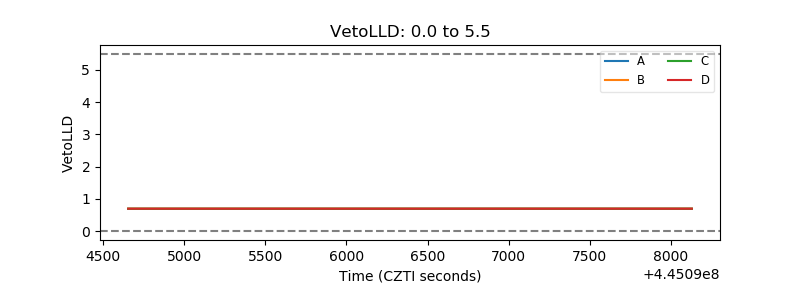 |
| Alpha Counter | 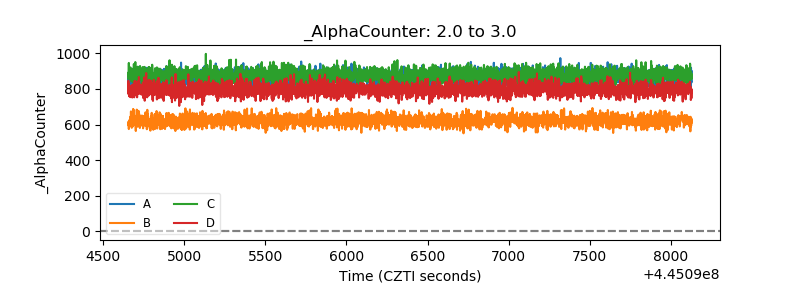 |
| _CPM_Rate | 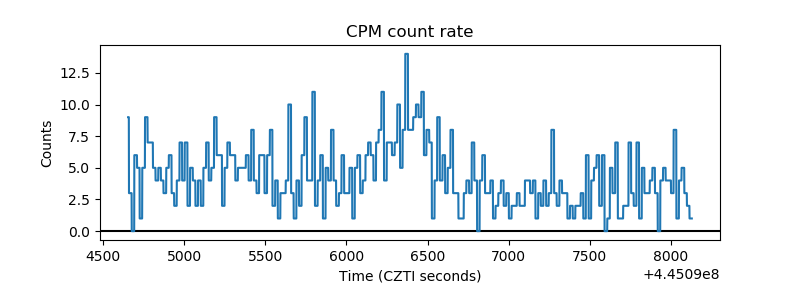 |
| CZT Counter | 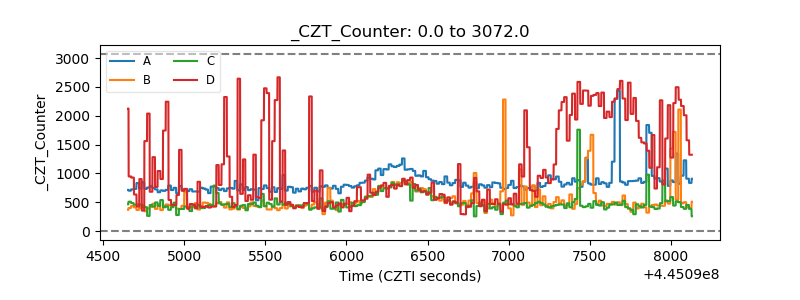 |
| +2.5 Volts monitor | 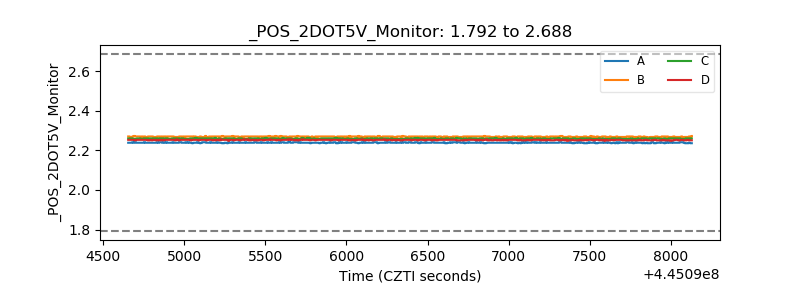 |
| +5 Volts monitor | 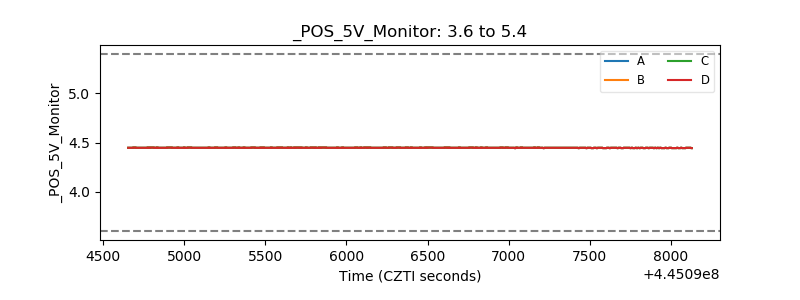 |
| _ROLL_ROT | 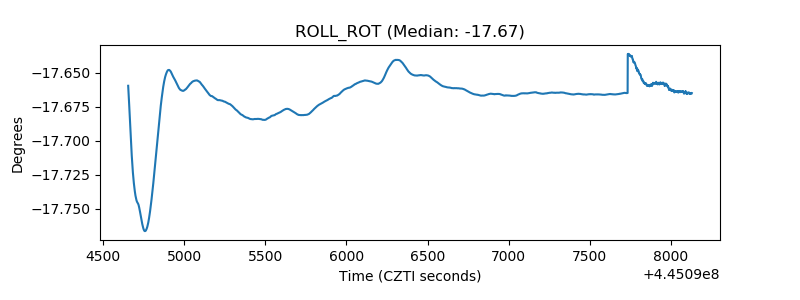 |
| _Roll_DEC | 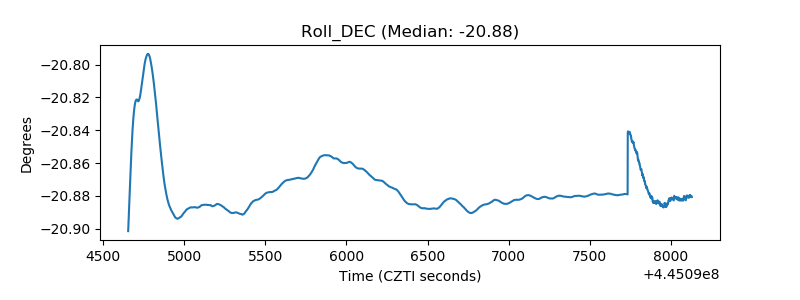 |
| _Roll_RA | 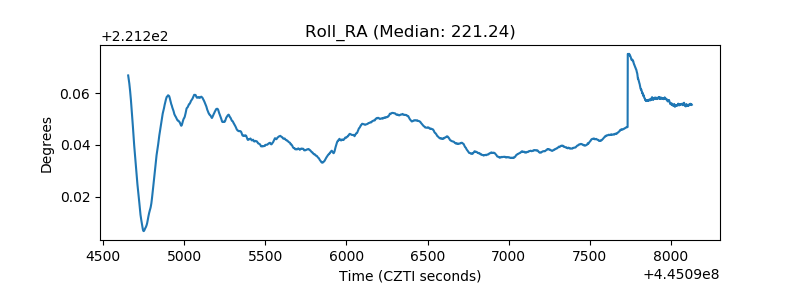 |
| Veto Counter | 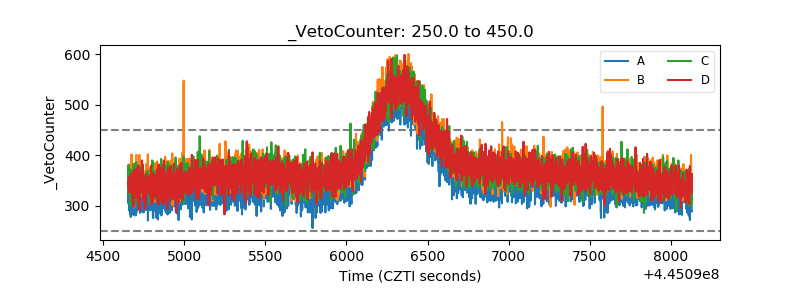 |