| Param | Original file | Final file |
|---|---|---|
| Filename | modeM0/AS1A13_038T03_9000006058_45236cztM0_level2.fits | modeM0/AS1A13_038T03_9000006058_45236cztM0_level2_quad_clean.evt |
| Size (bytes) | 1,555,485,120 | 289,710,720 |
| Size | 1.4 GB | 276.3 MB |
| Events in quadrant A | 16,107,368 | 1,953,631 |
| Events in quadrant B | 9,771,206 | 2,038,390 |
| Events in quadrant C | 9,208,998 | 2,014,391 |
| Events in quadrant D | 21,004,117 | 1,438,615 |
| Mode M0 | |||
|---|---|---|---|
| Quadrant | BADHDUFLAG | Total packets | Discarded packets |
| A | 0 | 61600 | 8 |
| B | 0 | 42299 | 3 |
| C | 0 | 41139 | 3 |
| D | 0 | 75653 | 3 |
| Mode M9 | |||
|---|---|---|---|
| Quadrant | BADHDUFLAG | Total packets | Discarded packets |
| A | 0 | 13 | 0 |
| B | 0 | 13 | 0 |
| C | 0 | 13 | 0 |
| D | 0 | 13 | 0 |
| Mode SS | |||
|---|---|---|---|
| Quadrant | BADHDUFLAG | Total packets | Discarded packets |
| A | 0 | 390 | 0 |
| B | 0 | 390 | 0 |
| C | 0 | 390 | 0 |
| D | 0 | 390 | 0 |
| Quadrant | Total seconds | Saturated seconds | Saturation percentage |
|---|---|---|---|
| A | 19243 | 801 | 4.162553% |
| B | 19245 | 569 | 2.956612% |
| C | 19246 | 318 | 1.652291% |
| D | 19246 | 4212 | 21.885067% |
Noise dominated data is calculated using 1-second bins in cleaned event files. If a bin has >2000 counts, and if more than 50% of those come from <1% of pixels, then it is considered to be noise-dominated and hence unusable.
| Quadrant | # 1 sec bins | Bins with >0 counts | Bins with >2000 counts | High rate bins dominated by noise | Noise dominated (total time) | Noise dominated (detector-on time) | Marked lightcurve |
|---|---|---|---|---|---|---|---|
| A | 20530 | 19244 | 124 | 124 | 0.60% | 0.64% | 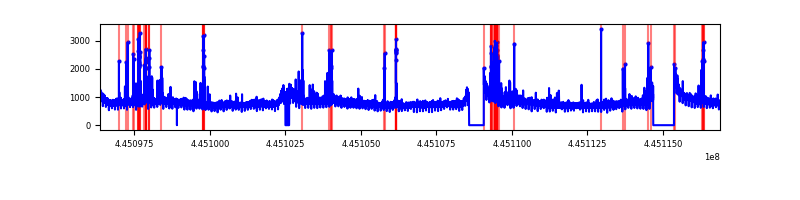 |
| B | 20530 | 19245 | 94 | 94 | 0.46% | 0.49% | 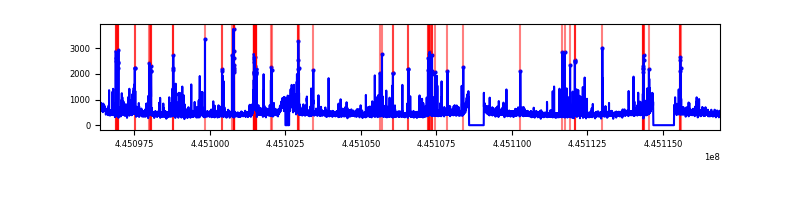 |
| C | 20531 | 19247 | 71 | 71 | 0.35% | 0.37% | 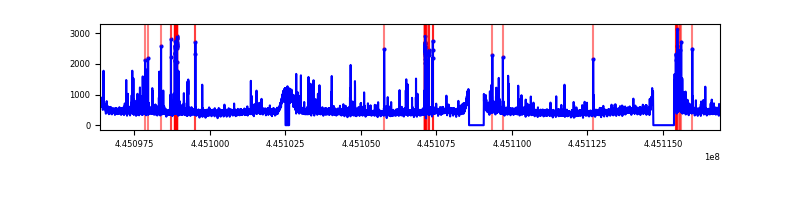 |
| D | 20531 | 19248 | 3005 | 3005 | 14.64% | 15.61% | 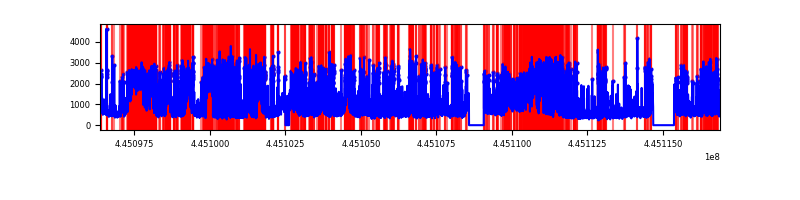 |
Top three noisy pixels from each quadrant. If the there are fewer than three noisy pixels in the level2.evt file, extra rows are filled as -1
| Pixel properties | Quadrant properties | ||||||
|---|---|---|---|---|---|---|---|
| Quadrant | DetID | PixID | Counts | Sigma | Mean | Median | Sigma |
| A | 10 | 83 | 6995531 | 15315.11 | 2198 | 2144 | 456.6 |
| A | 13 | 248 | 448636 | 977.79 | 2198 | 2144 | 456.6 |
| A | 15 | 174 | 49966 | 104.73 | 2198 | 2144 | 456.6 |
| B | 5 | 32 | 300819 | 689.07 | 2202 | 2133 | 433.5 |
| B | 12 | 3 | 205195 | 468.47 | 2202 | 2133 | 433.5 |
| B | 5 | 255 | 118314 | 268.03 | 2202 | 2133 | 433.5 |
| C | 12 | 2 | 229602 | 441.6 | 2190 | 2206 | 514.9 |
| C | 14 | 254 | 188272 | 361.34 | 2190 | 2206 | 514.9 |
| C | 3 | 233 | 89407 | 169.34 | 2190 | 2206 | 514.9 |
| D | 13 | 249 | 3101546 | 6265.36 | 1965 | 1904 | 494.7 |
| D | 12 | 17 | 3016449 | 6093.35 | 1965 | 1904 | 494.7 |
| D | 4 | 232 | 2427113 | 4902.12 | 1965 | 1904 | 494.7 |
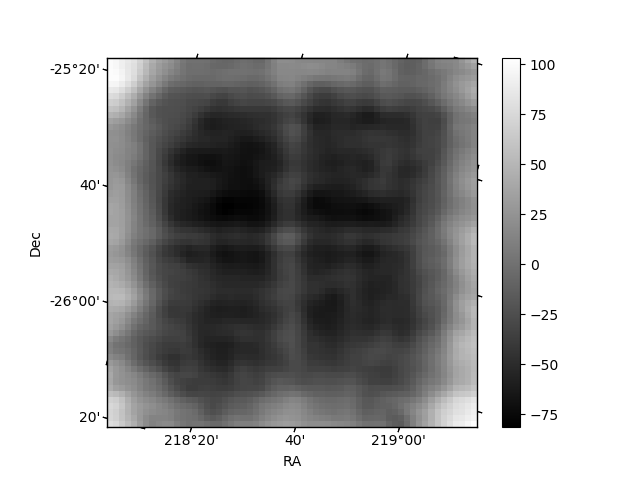
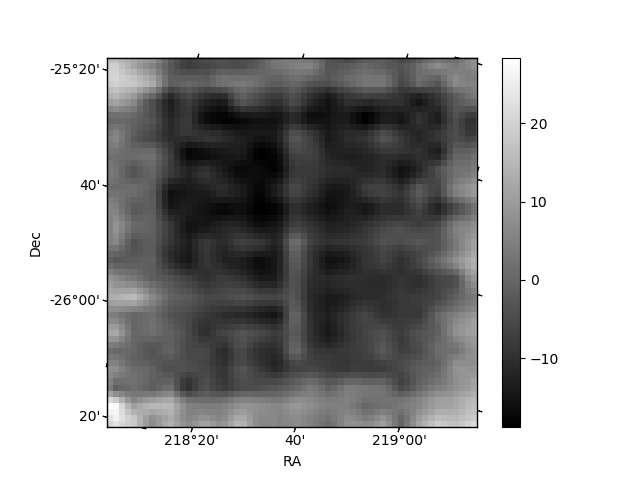
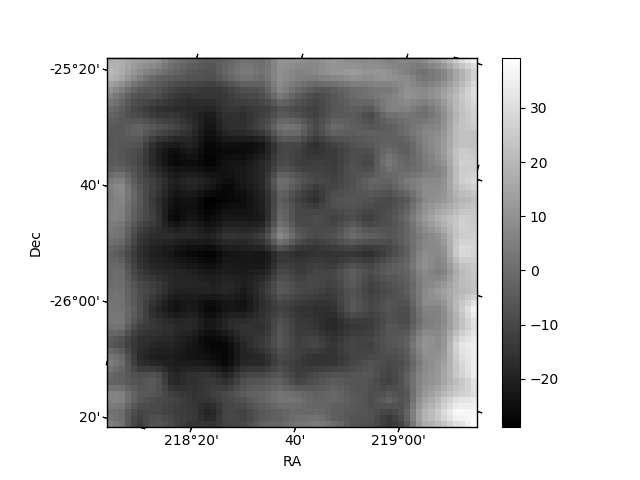
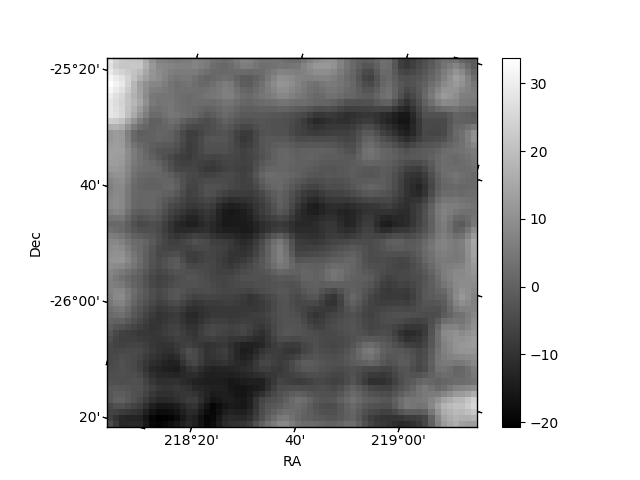
Histogram calculated using DETX and DETY for each event in the final _common_clean file
| Quadrant A | 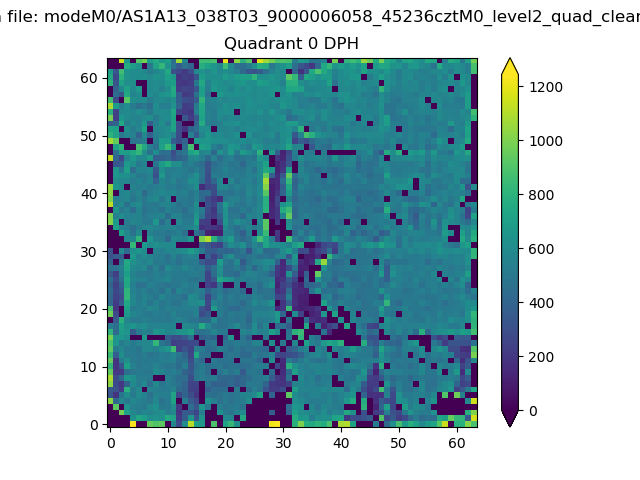 |
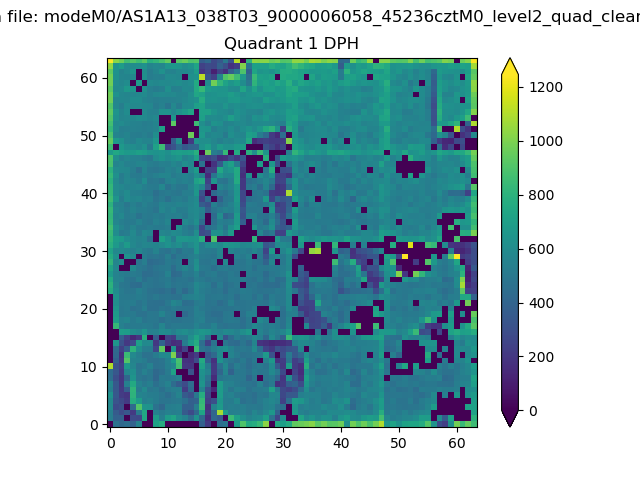 |
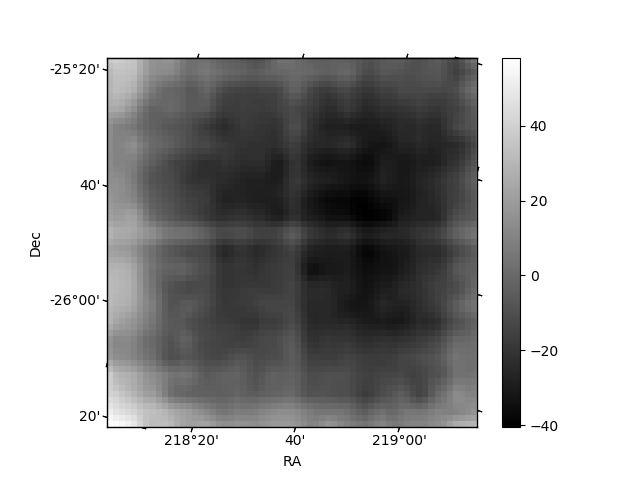
Quadrant B |
|---|---|---|---|
| Quadrant D | 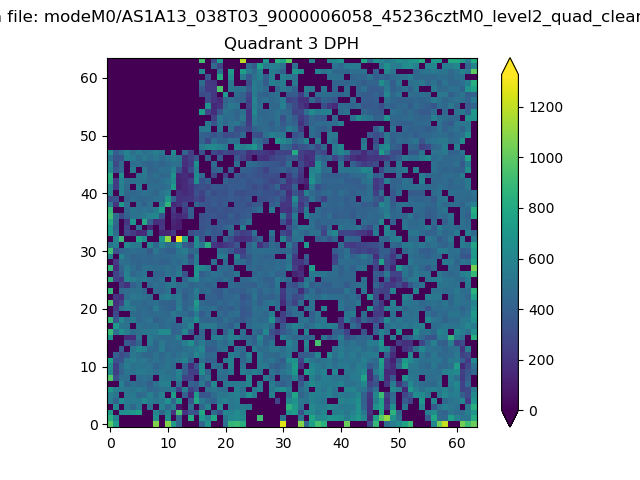 |
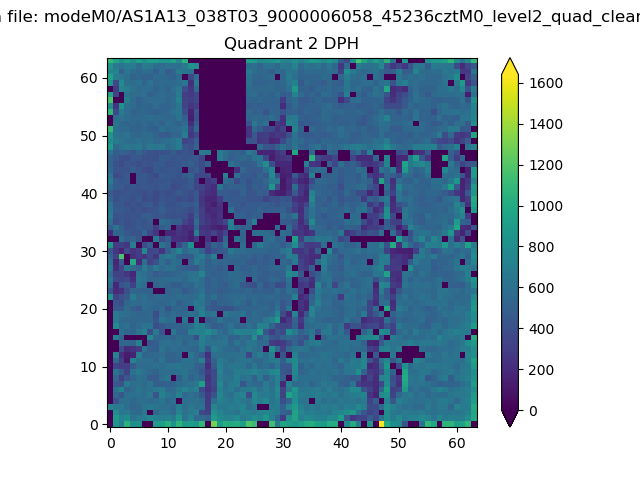 |
Quadrant C |
| Plot type | Count rate plots | Images |
|---|---|---|
| Comparison with Poisson distribution Blue bars denote a histogram of data divided into 1 sec bins. Red curve is a Poisson curve with rate = median count rate of data. |
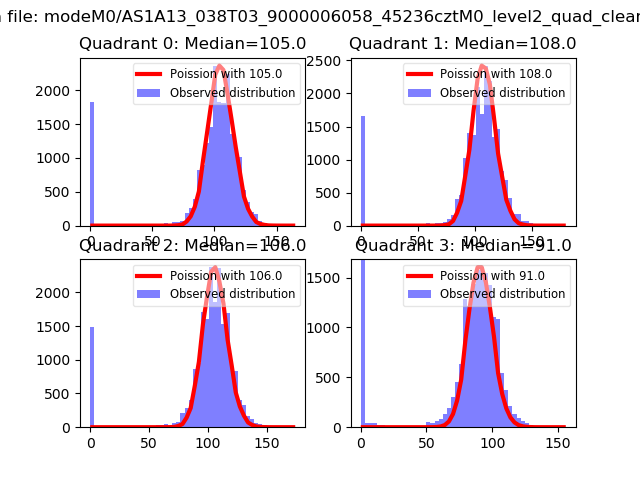 |
 |
| Quadrant-wise count rates Data is divided into 100 sec bins |
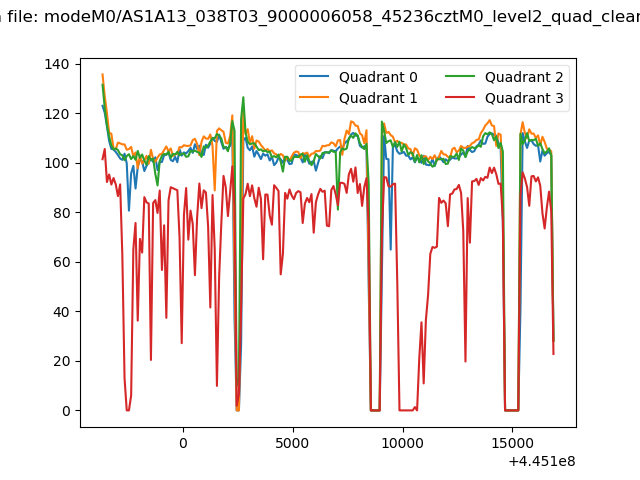 |
|
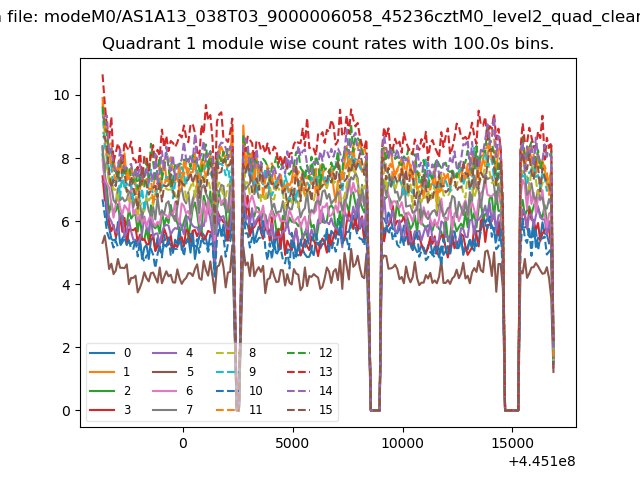
| Module-wise count rates for Quadrant A Data is divided into 100 sec bins |
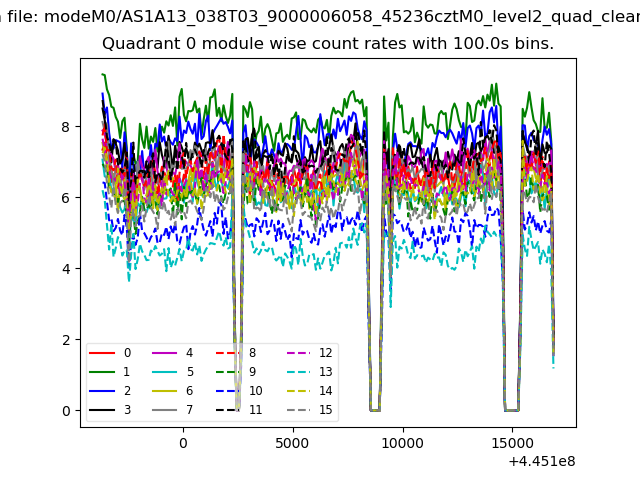 |
 |
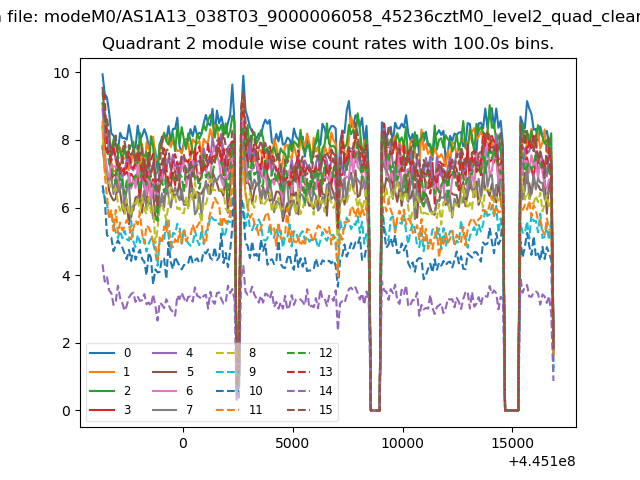
| Module-wise count rates for Quadrant B Data is divided into 100 sec bins |
 |
 |
| Module-wise count rates for Quadrant C Data is divided into 100 sec bins |
 |
 |
| Module-wise count rates for Quadrant D Data is divided into 100 sec bins |
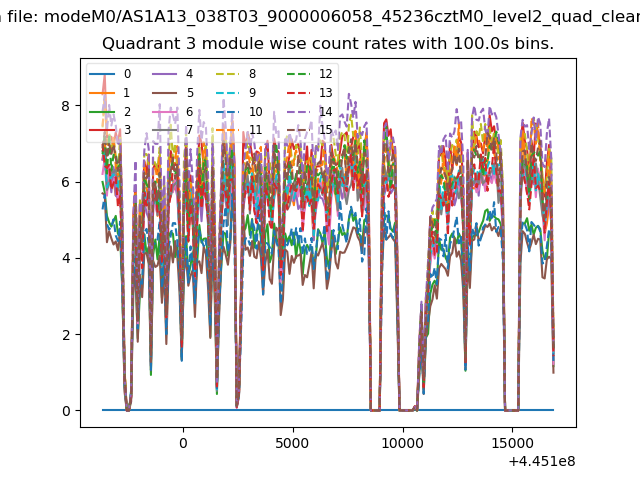 |
 |
| Parameter | Plot |
|---|---|
| CZT HV Monitor | 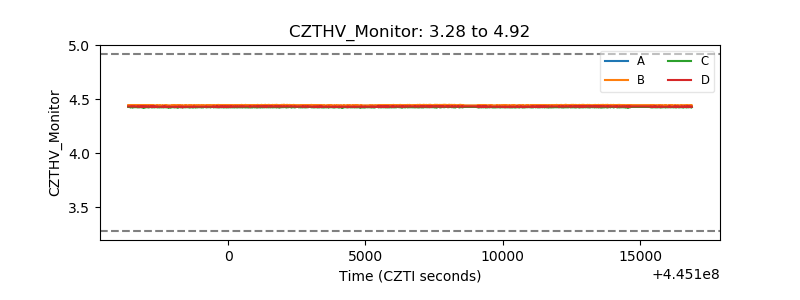 |
| D_VDD | 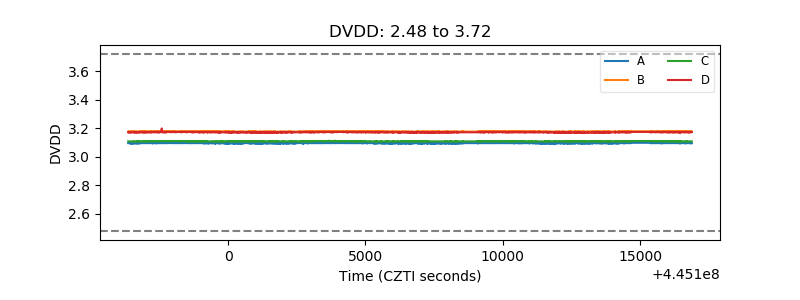 |
| Temperature 1 | 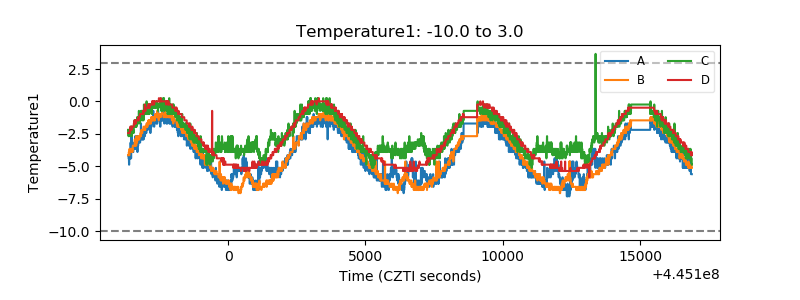 |
| Veto HV Monitor | 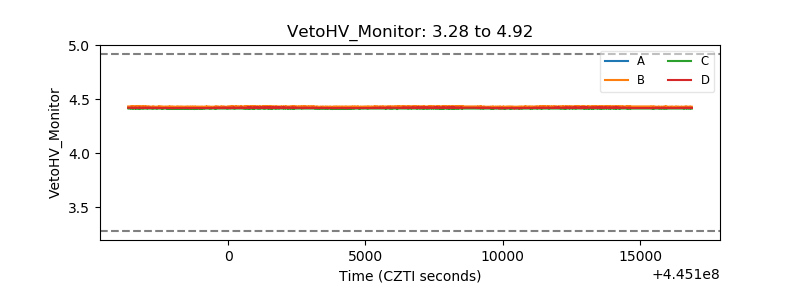 |
| Veto LLD | 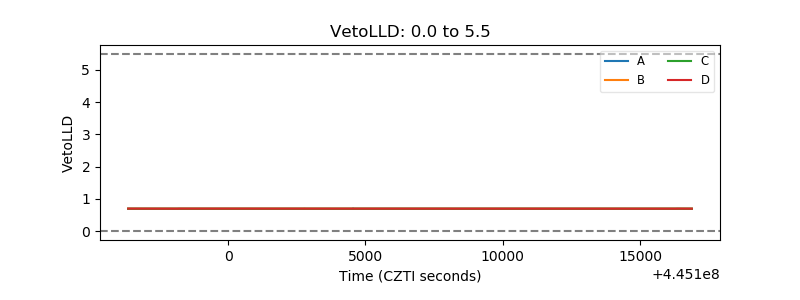 |
| Alpha Counter | 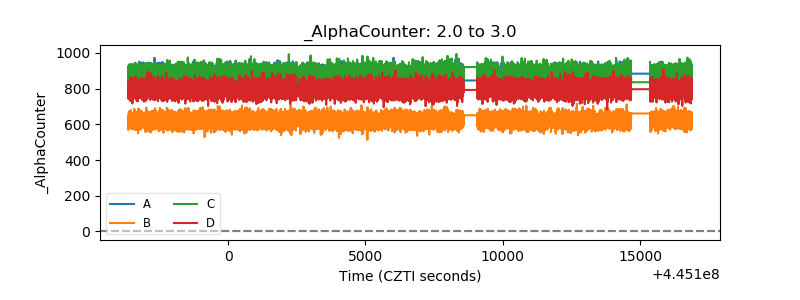 |
| _CPM_Rate | 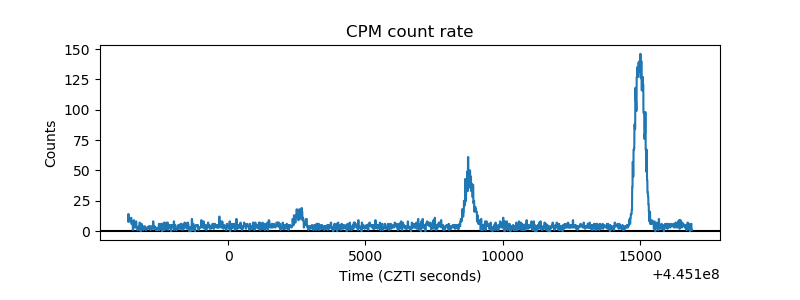 |
| CZT Counter | 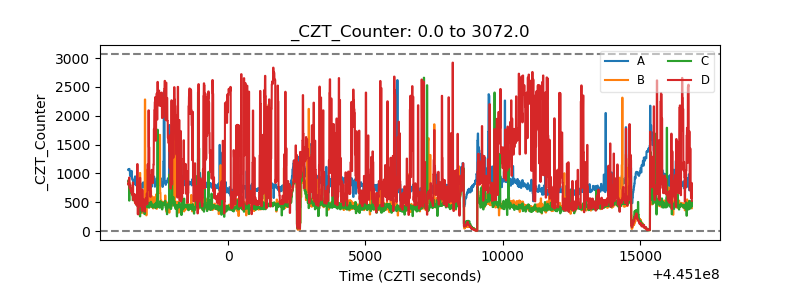 |
| +2.5 Volts monitor | 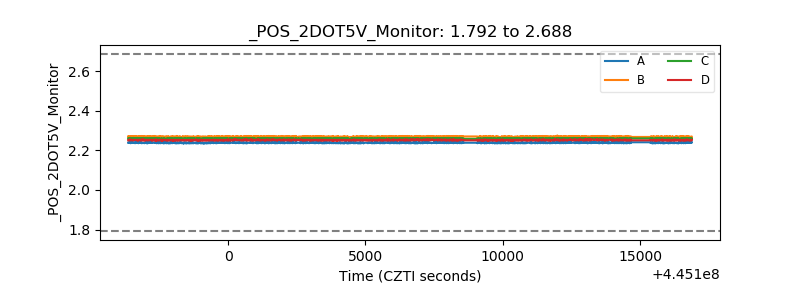 |
| +5 Volts monitor | 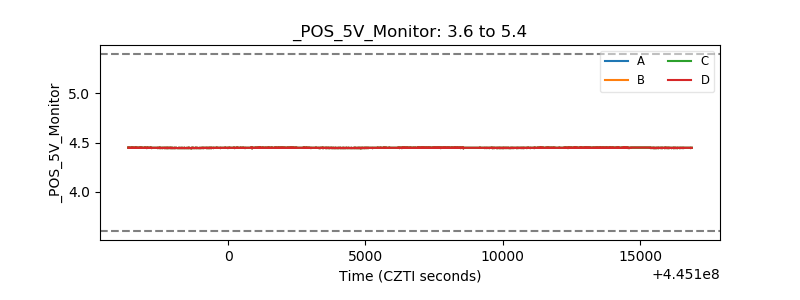 |
| _ROLL_ROT | 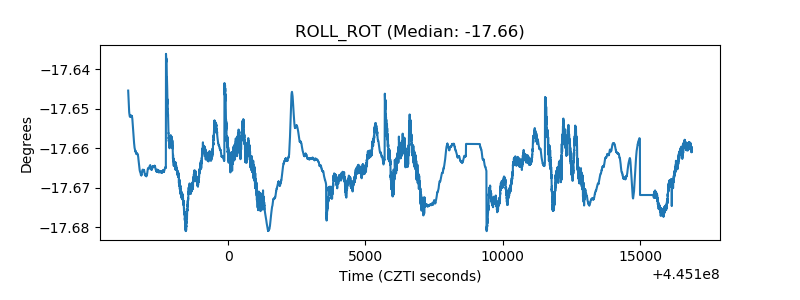 |
| _Roll_DEC | 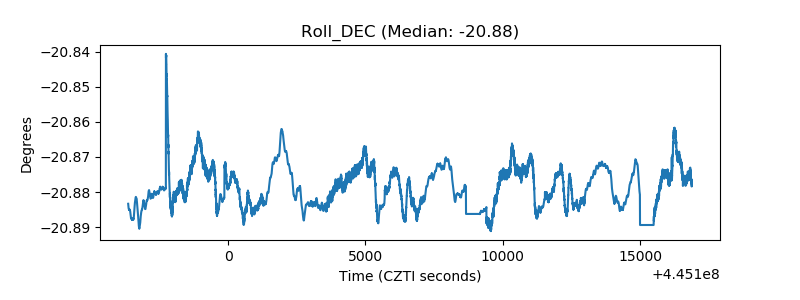 |
| _Roll_RA | 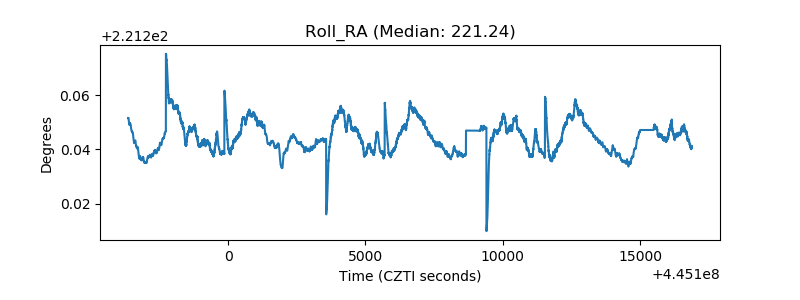 |
| Veto Counter | 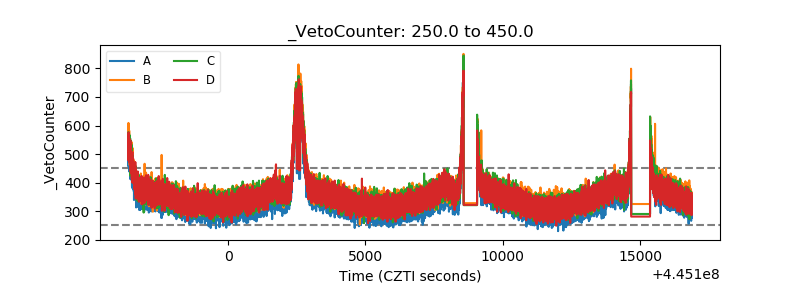 |