| Param | Original file | Final file |
|---|---|---|
| Filename | modeM0/AS1A13_038T03_9000006058_45237cztM0_level2.fits | modeM0/AS1A13_038T03_9000006058_45237cztM0_level2_quad_clean.evt |
| Size (bytes) | 466,971,840 | 107,170,560 |
| Size | 445.3 MB | 102.2 MB |
| Events in quadrant A | 5,608,513 | 704,403 |
| Events in quadrant B | 3,286,723 | 732,059 |
| Events in quadrant C | 3,039,085 | 712,816 |
| Events in quadrant D | 4,834,262 | 630,896 |
| Mode M0 | |||
|---|---|---|---|
| Quadrant | BADHDUFLAG | Total packets | Discarded packets |
| A | 0 | 21757 | 1 |
| B | 0 | 14330 | 1 |
| C | 0 | 13751 | 1 |
| D | 0 | 18917 | 6 |
| Mode M9 | |||
|---|---|---|---|
| Quadrant | BADHDUFLAG | Total packets | Discarded packets |
| A | 0 | 9 | 0 |
| B | 0 | 9 | 0 |
| C | 0 | 9 | 0 |
| D | 0 | 9 | 0 |
| Mode SS | |||
|---|---|---|---|
| Quadrant | BADHDUFLAG | Total packets | Discarded packets |
| A | 0 | 136 | 0 |
| B | 0 | 136 | 0 |
| C | 0 | 136 | 0 |
| D | 0 | 136 | 0 |
| Quadrant | Total seconds | Saturated seconds | Saturation percentage |
|---|---|---|---|
| A | 6661 | 172 | 2.582195% |
| B | 6661 | 78 | 1.170995% |
| C | 6662 | 28 | 0.420294% |
| D | 6660 | 296 | 4.444444% |
Noise dominated data is calculated using 1-second bins in cleaned event files. If a bin has >2000 counts, and if more than 50% of those come from <1% of pixels, then it is considered to be noise-dominated and hence unusable.
| Quadrant | # 1 sec bins | Bins with >0 counts | Bins with >2000 counts | High rate bins dominated by noise | Noise dominated (total time) | Noise dominated (detector-on time) | Marked lightcurve |
|---|---|---|---|---|---|---|---|
| A | 7561 | 6661 | 37 | 37 | 0.49% | 0.56% | 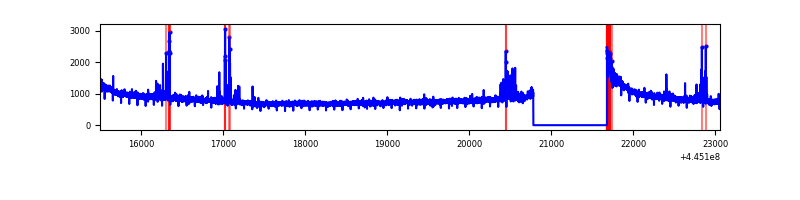 |
| B | 7561 | 6661 | 18 | 18 | 0.24% | 0.27% | 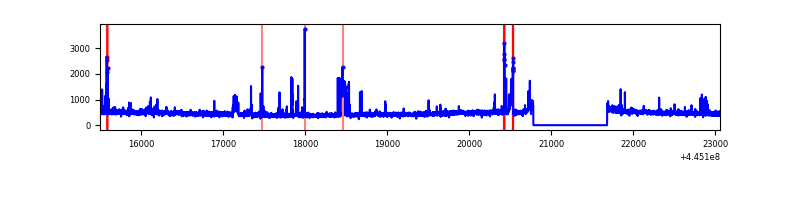 |
| C | 7562 | 6662 | 8 | 8 | 0.11% | 0.12% | 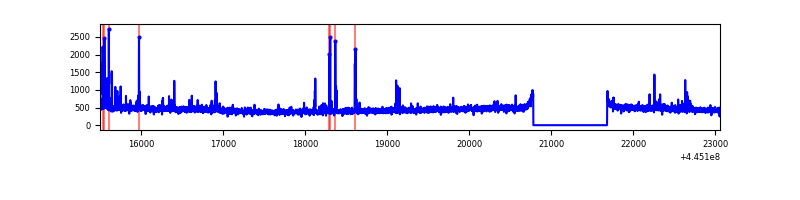 |
| D | 7561 | 6662 | 249 | 249 | 3.29% | 3.74% | 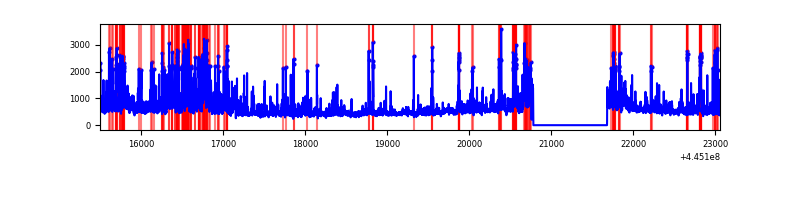 |
Top three noisy pixels from each quadrant. If the there are fewer than three noisy pixels in the level2.evt file, extra rows are filled as -1
| Pixel properties | Quadrant properties | ||||||
|---|---|---|---|---|---|---|---|
| Quadrant | DetID | PixID | Counts | Sigma | Mean | Median | Sigma |
| A | 10 | 83 | 2564719 | 16412.77 | 746 | 728 | 156.2 |
| A | 13 | 248 | 105993 | 673.83 | 746 | 728 | 156.2 |
| A | 2 | 79 | 25504 | 158.6 | 746 | 728 | 156.2 |
| B | 5 | 32 | 155893 | 1056.0 | 750 | 729 | 146.9 |
| B | 15 | 36 | 54641 | 366.91 | 750 | 729 | 146.9 |
| B | 4 | 67 | 24293 | 160.37 | 750 | 729 | 146.9 |
| C | 14 | 254 | 47281 | 265.3 | 742 | 748 | 175.4 |
| C | 12 | 249 | 37518 | 209.64 | 742 | 748 | 175.4 |
| C | 12 | 2 | 31671 | 176.3 | 742 | 748 | 175.4 |
| D | 5 | 235 | 462535 | 2525.84 | 724 | 700 | 182.8 |
| D | 11 | 241 | 262801 | 1433.47 | 724 | 700 | 182.8 |
| D | 13 | 249 | 260090 | 1418.64 | 724 | 700 | 182.8 |
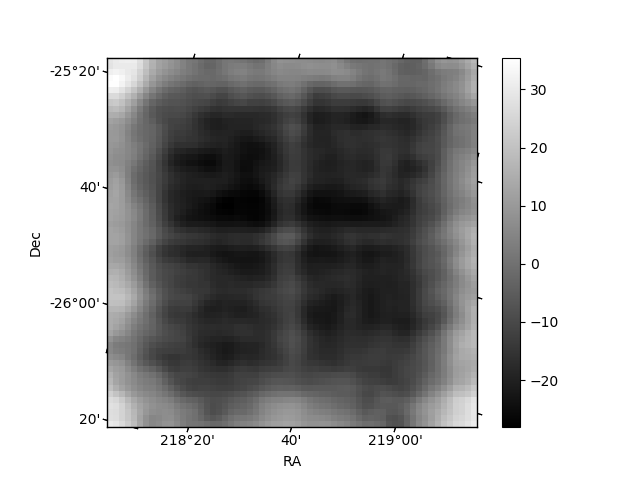
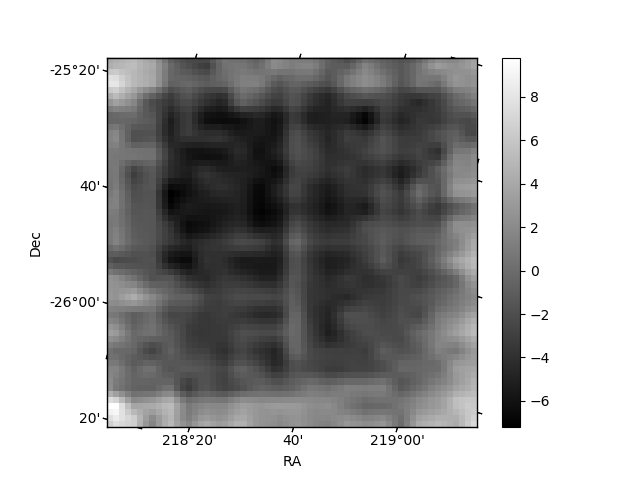
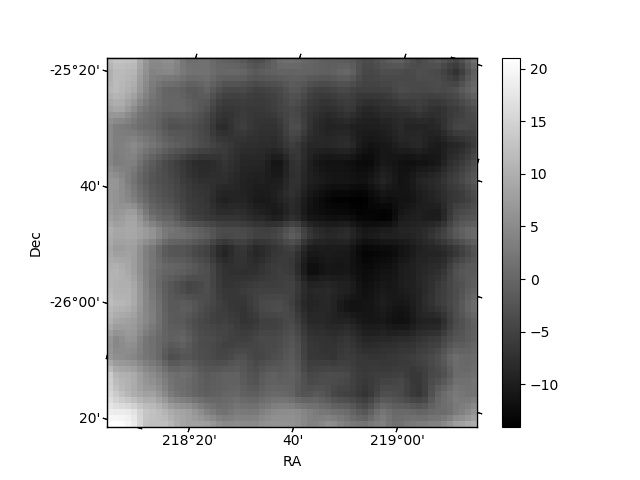
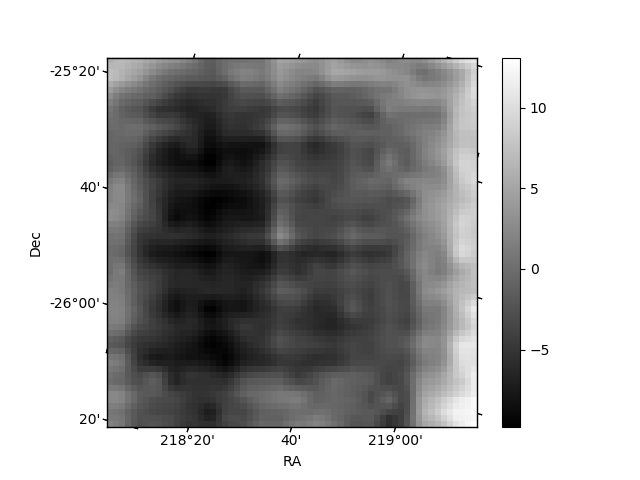
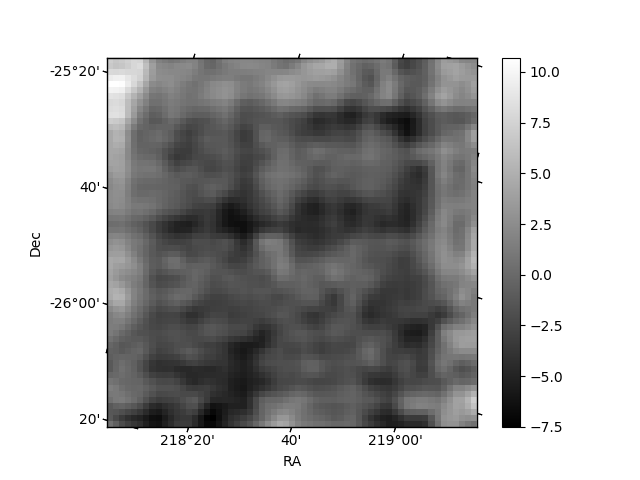
Histogram calculated using DETX and DETY for each event in the final _common_clean file
| Quadrant A | 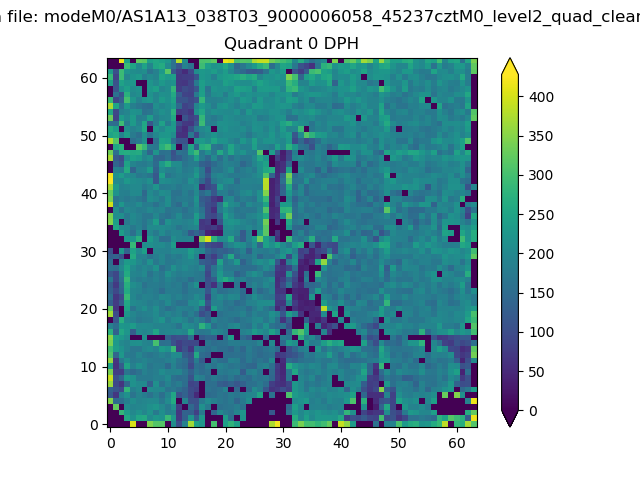 |
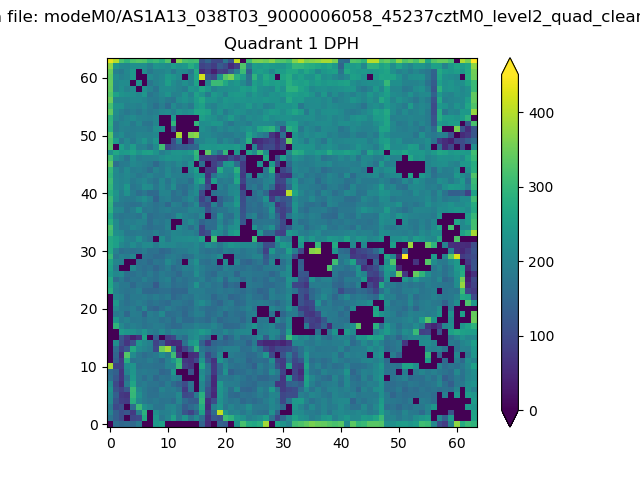 |
Quadrant B |
|---|---|---|---|
| Quadrant D | 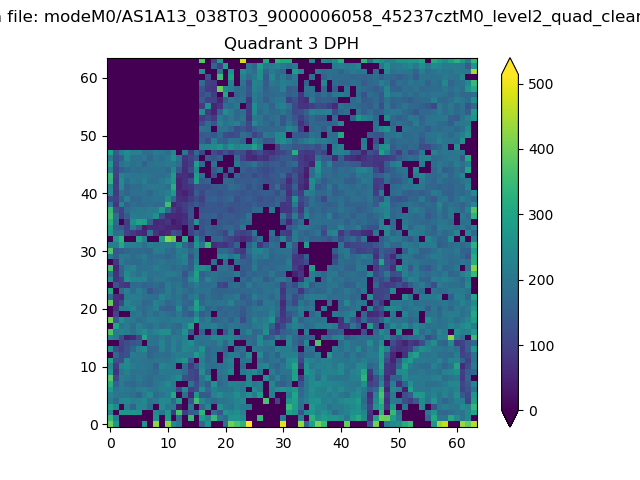 |
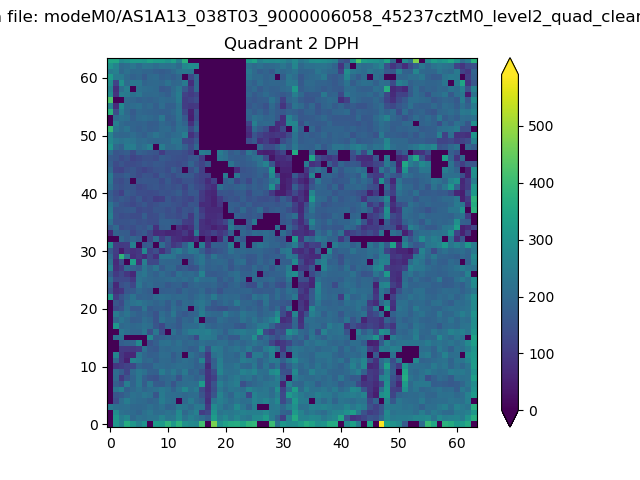 |
Quadrant C |
| Plot type | Count rate plots | Images |
|---|---|---|
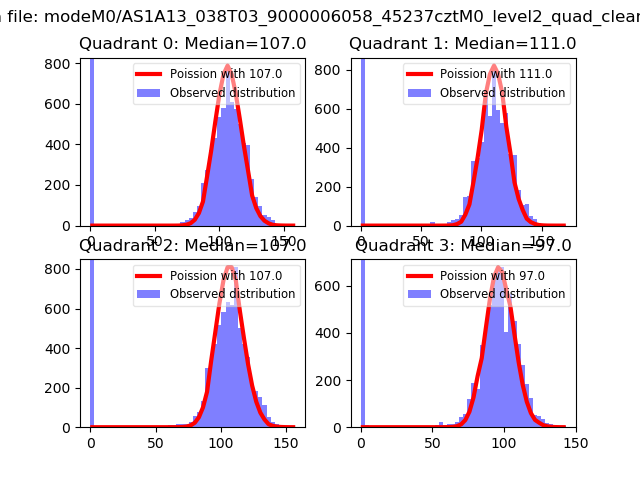
| Comparison with Poisson distribution Blue bars denote a histogram of data divided into 1 sec bins. Red curve is a Poisson curve with rate = median count rate of data. |
 |
 |
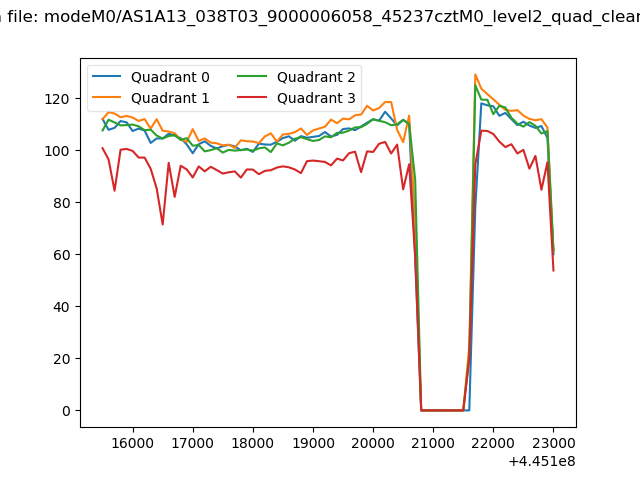
| Quadrant-wise count rates Data is divided into 100 sec bins |
 |
|
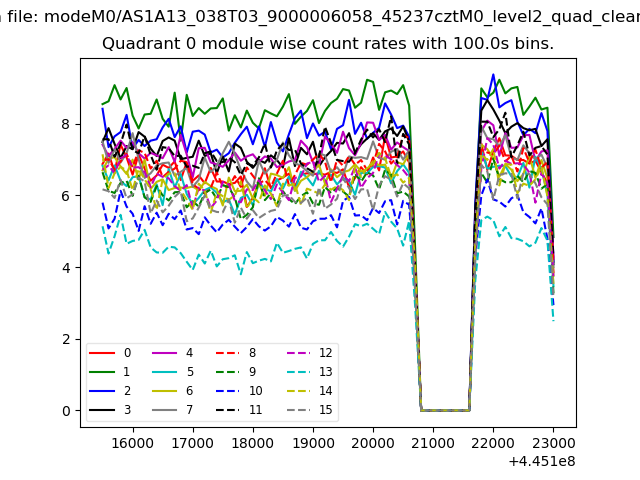
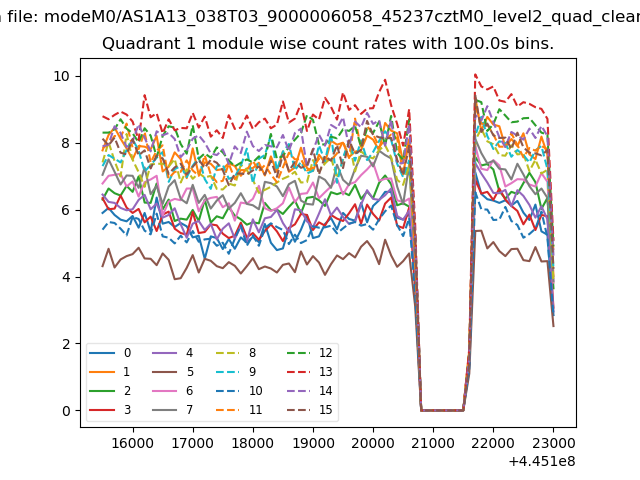
| Module-wise count rates for Quadrant A Data is divided into 100 sec bins |
 |
 |
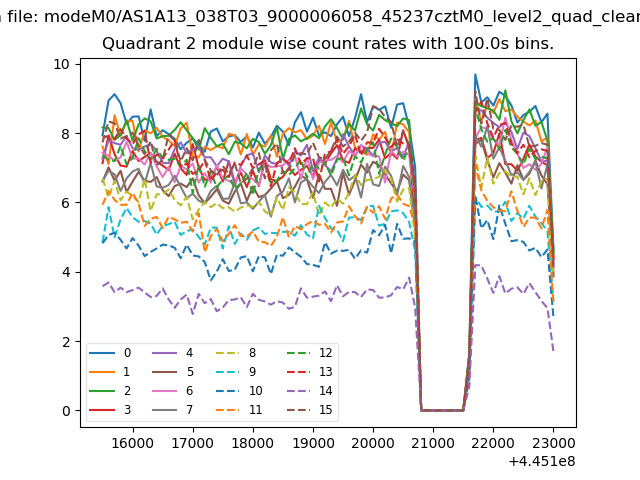
| Module-wise count rates for Quadrant B Data is divided into 100 sec bins |
 |
 |
| Module-wise count rates for Quadrant C Data is divided into 100 sec bins |
 |
 |
| Module-wise count rates for Quadrant D Data is divided into 100 sec bins |
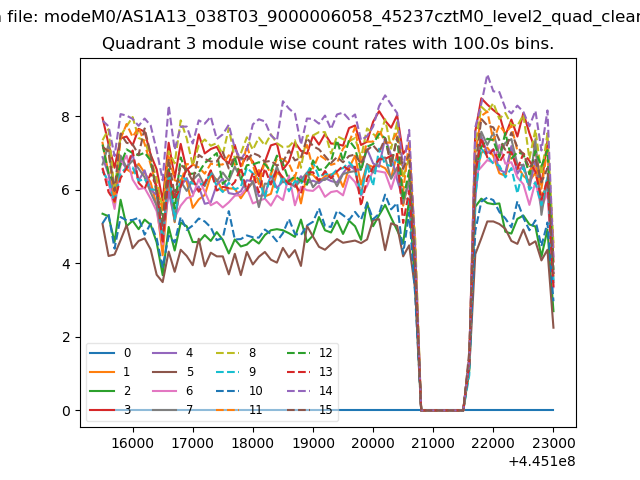 |
 |
| Parameter | Plot |
|---|---|
| CZT HV Monitor | 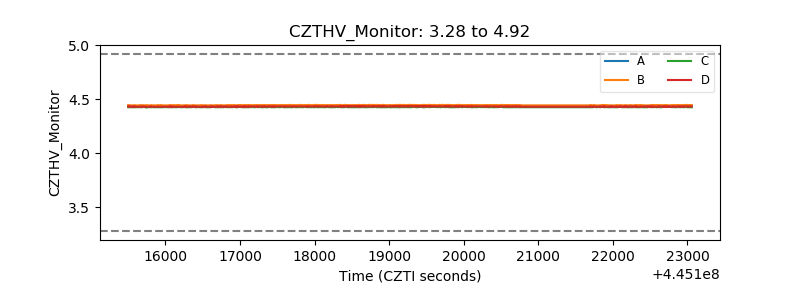 |
| D_VDD | 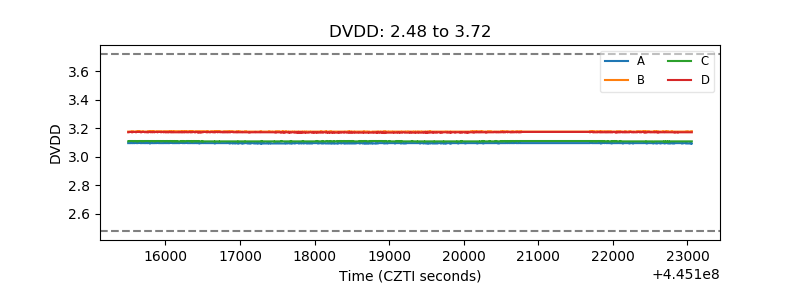 |
| Temperature 1 | 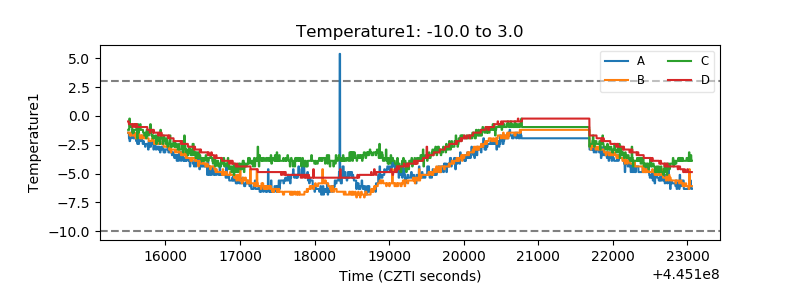 |
| Veto HV Monitor | 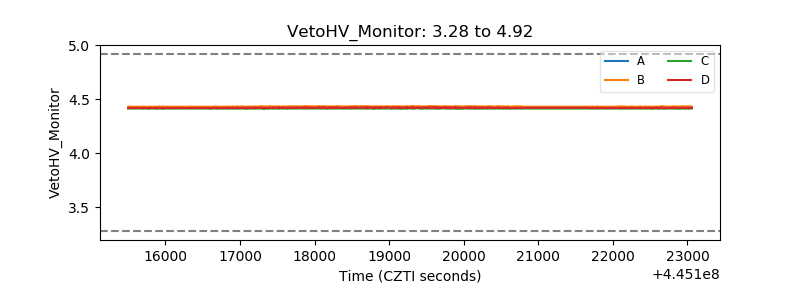 |
| Veto LLD | 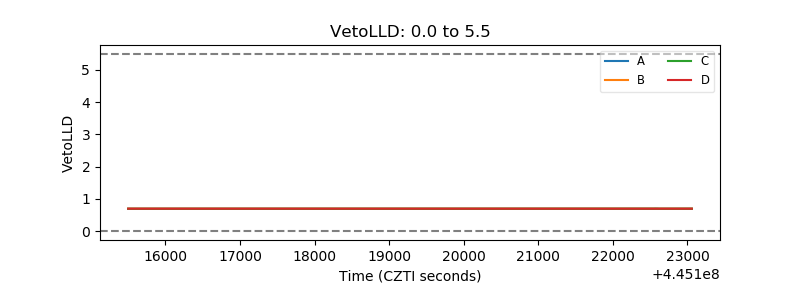 |
| Alpha Counter | 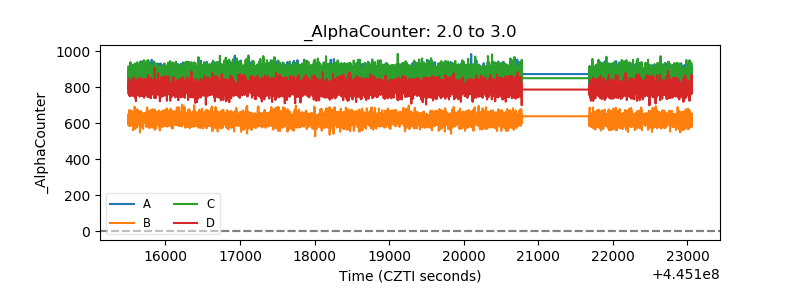 |
| _CPM_Rate | 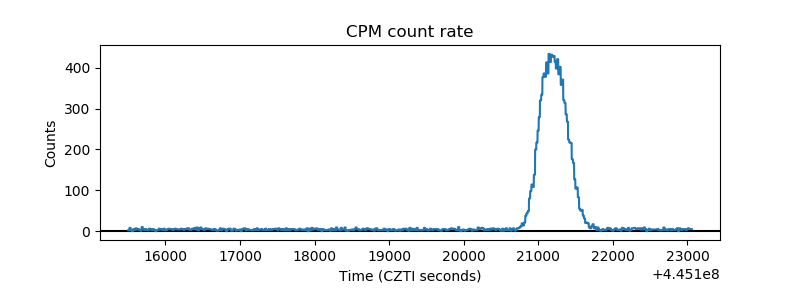 |
| CZT Counter | 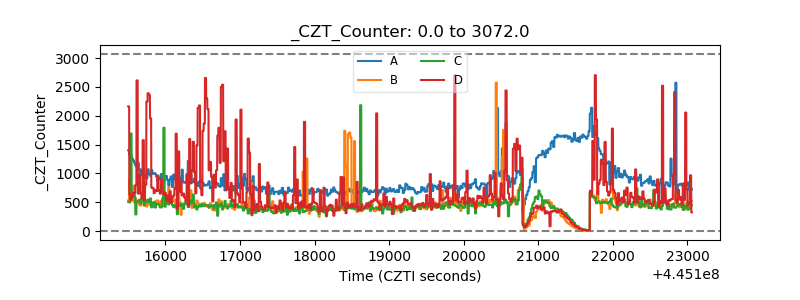 |
| +2.5 Volts monitor |  |
| +5 Volts monitor | 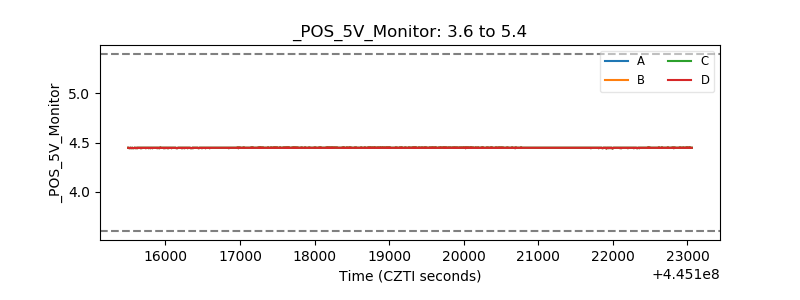 |
| _ROLL_ROT | 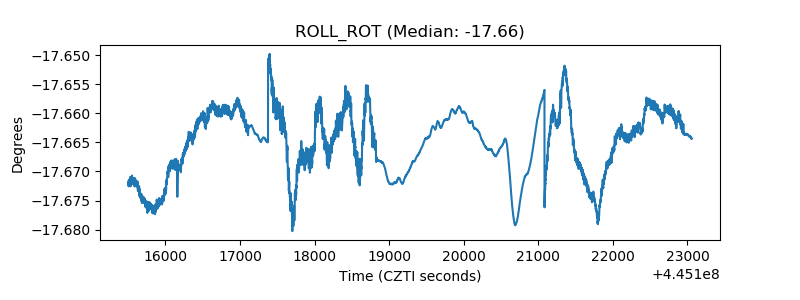 |
| _Roll_DEC | 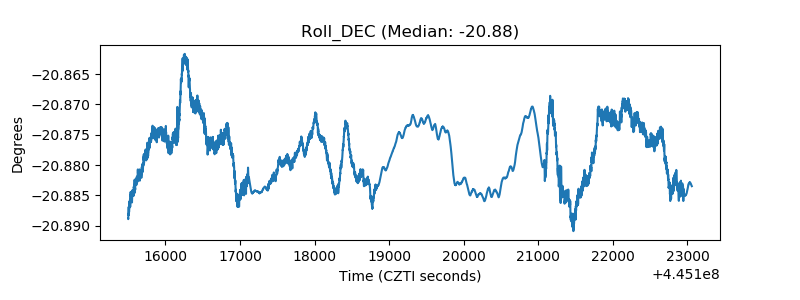 |
| _Roll_RA | 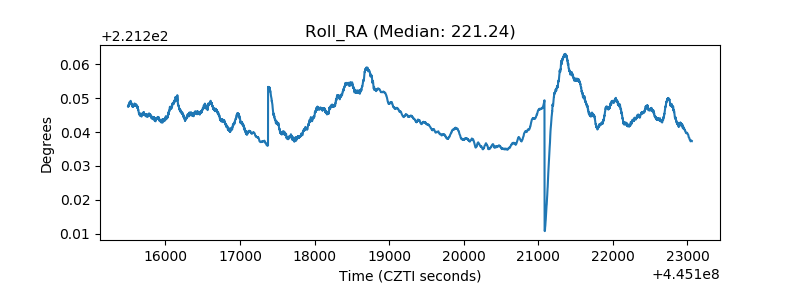 |
| Veto Counter | 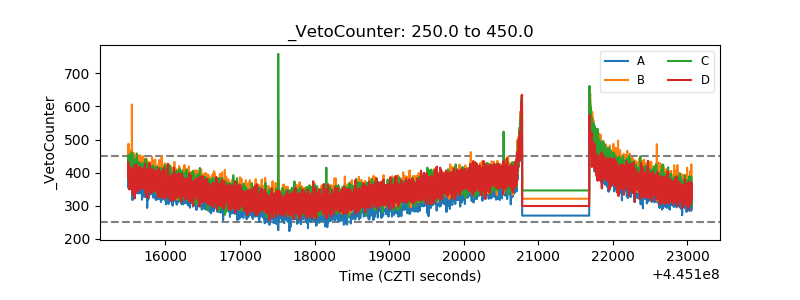 |