| Param | Original file | Final file |
|---|---|---|
| Filename | modeM0/AS1A13_038T03_9000006058_45239cztM0_level2.fits | modeM0/AS1A13_038T03_9000006058_45239cztM0_level2_quad_clean.evt |
| Size (bytes) | 462,726,720 | 106,790,400 |
| Size | 441.3 MB | 101.8 MB |
| Events in quadrant A | 5,480,333 | 697,973 |
| Events in quadrant B | 3,152,765 | 739,393 |
| Events in quadrant C | 2,991,517 | 711,893 |
| Events in quadrant D | 5,000,859 | 632,368 |
| Mode M0 | |||
|---|---|---|---|
| Quadrant | BADHDUFLAG | Total packets | Discarded packets |
| A | 0 | 21348 | 2 |
| B | 0 | 13792 | 2 |
| C | 0 | 13504 | 2 |
| D | 0 | 19331 | 2 |
| Mode M9 | |||
|---|---|---|---|
| Quadrant | BADHDUFLAG | Total packets | Discarded packets |
| A | 0 | 13 | 0 |
| B | 0 | 14 | 0 |
| C | 0 | 14 | 0 |
| D | 0 | 14 | 0 |
| Mode SS | |||
|---|---|---|---|
| Quadrant | BADHDUFLAG | Total packets | Discarded packets |
| A | 0 | 130 | 0 |
| B | 0 | 130 | 0 |
| C | 0 | 130 | 0 |
| D | 0 | 130 | 0 |
| Quadrant | Total seconds | Saturated seconds | Saturation percentage |
|---|---|---|---|
| A | 6482 | 210 | 3.239741% |
| B | 6482 | 25 | 0.385683% |
| C | 6482 | 32 | 0.493675% |
| D | 6481 | 240 | 3.703132% |
Noise dominated data is calculated using 1-second bins in cleaned event files. If a bin has >2000 counts, and if more than 50% of those come from <1% of pixels, then it is considered to be noise-dominated and hence unusable.
| Quadrant | # 1 sec bins | Bins with >0 counts | Bins with >2000 counts | High rate bins dominated by noise | Noise dominated (total time) | Noise dominated (detector-on time) | Marked lightcurve |
|---|---|---|---|---|---|---|---|
| A | 7572 | 6483 | 64 | 64 | 0.85% | 0.99% | 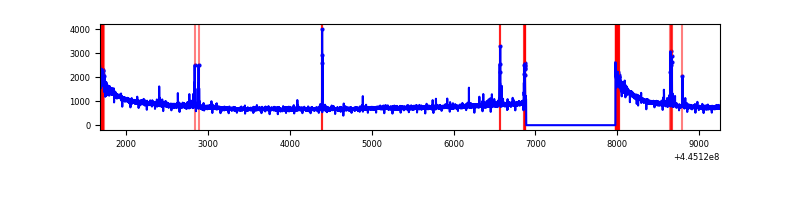 |
| B | 7572 | 6483 | 11 | 11 | 0.15% | 0.17% | 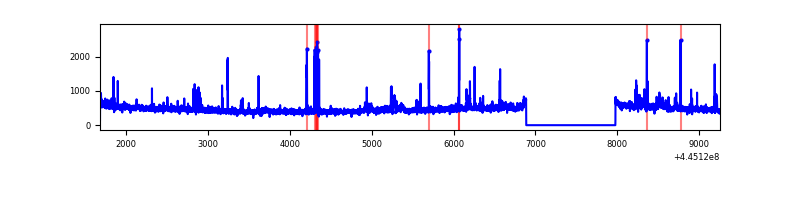 |
| C | 7572 | 6483 | 20 | 20 | 0.26% | 0.31% | 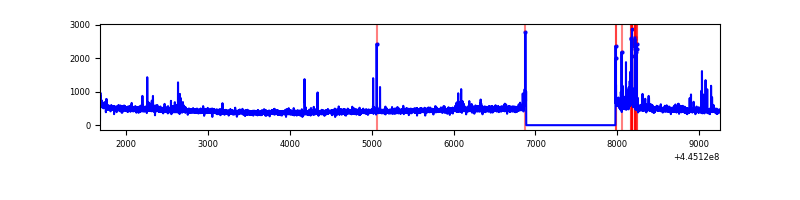 |
| D | 7571 | 6482 | 229 | 229 | 3.02% | 3.53% | 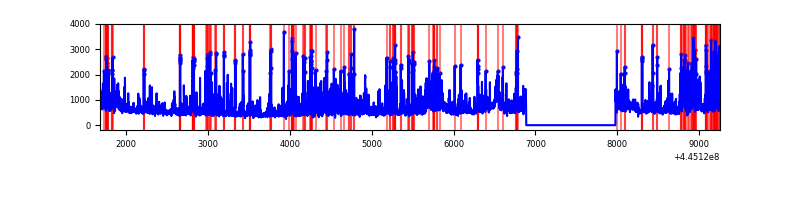 |
Top three noisy pixels from each quadrant. If the there are fewer than three noisy pixels in the level2.evt file, extra rows are filled as -1
| Pixel properties | Quadrant properties | ||||||
|---|---|---|---|---|---|---|---|
| Quadrant | DetID | PixID | Counts | Sigma | Mean | Median | Sigma |
| A | 10 | 83 | 2519984 | 16565.18 | 727 | 711 | 152.1 |
| A | 13 | 248 | 84492 | 550.89 | 727 | 711 | 152.1 |
| A | 4 | 0 | 21548 | 137.01 | 727 | 711 | 152.1 |
| B | 5 | 32 | 120351 | 816.03 | 738 | 715 | 146.6 |
| B | 4 | 171 | 43210 | 289.86 | 738 | 715 | 146.6 |
| B | 12 | 111 | 18593 | 121.95 | 738 | 715 | 146.6 |
| C | 14 | 254 | 103131 | 595.97 | 727 | 732 | 171.8 |
| C | 12 | 249 | 30271 | 171.92 | 727 | 732 | 171.8 |
| C | 3 | 233 | 12410 | 67.97 | 727 | 732 | 171.8 |
| D | 11 | 241 | 384608 | 2161.67 | 709 | 689 | 177.6 |
| D | 13 | 249 | 339230 | 1906.17 | 709 | 689 | 177.6 |
| D | 12 | 17 | 332844 | 1870.21 | 709 | 689 | 177.6 |
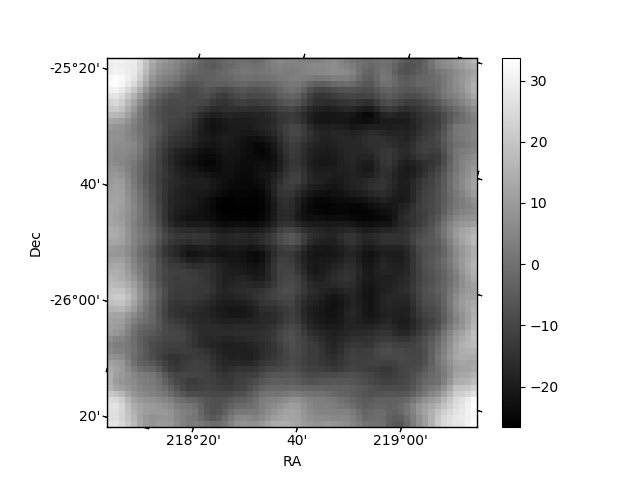
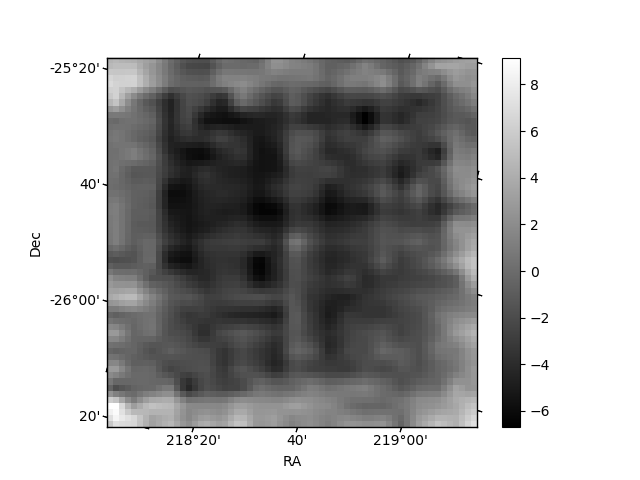
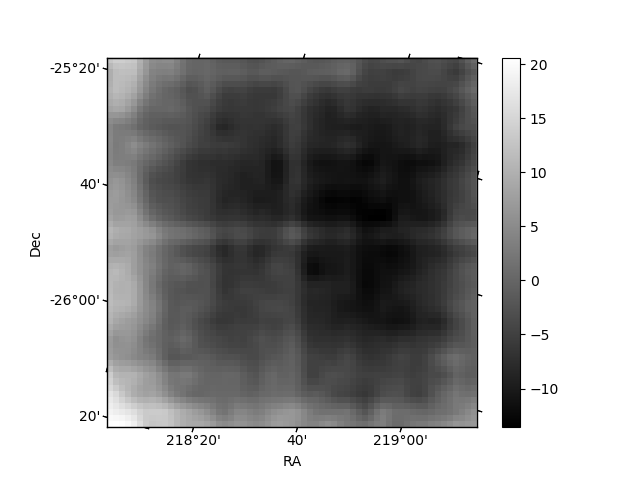
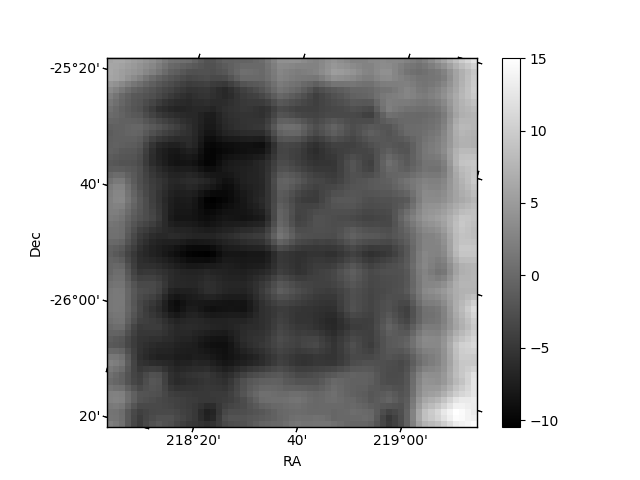
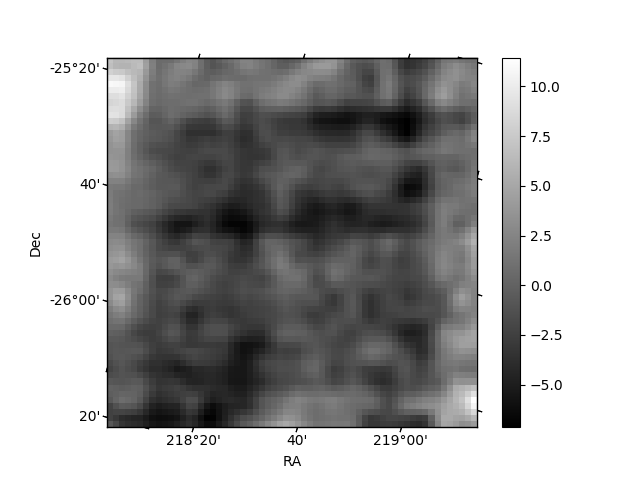
Histogram calculated using DETX and DETY for each event in the final _common_clean file
| Quadrant A | 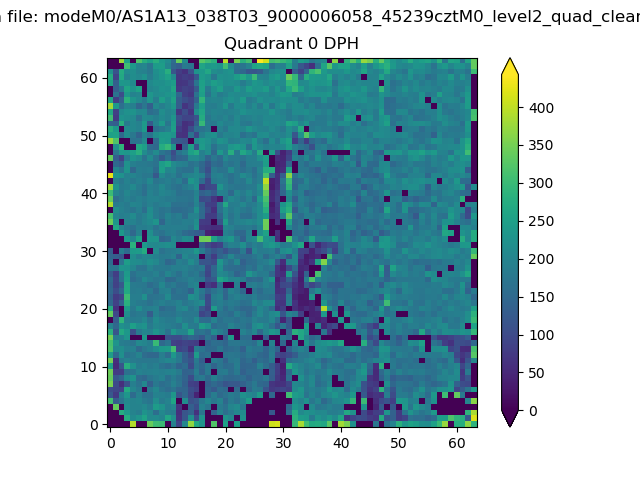 |
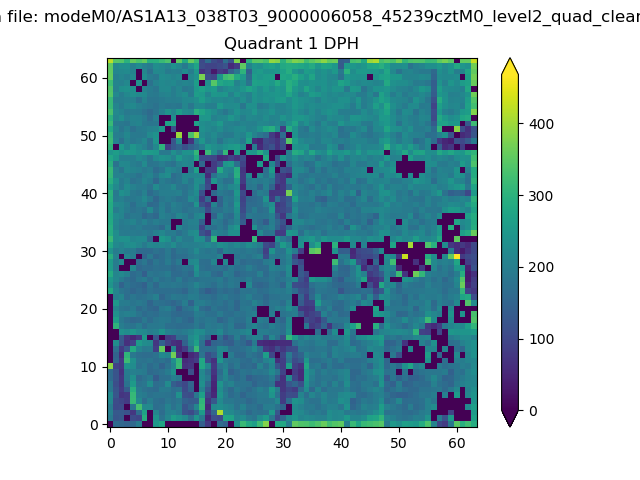 |
Quadrant B |
|---|---|---|---|
| Quadrant D | 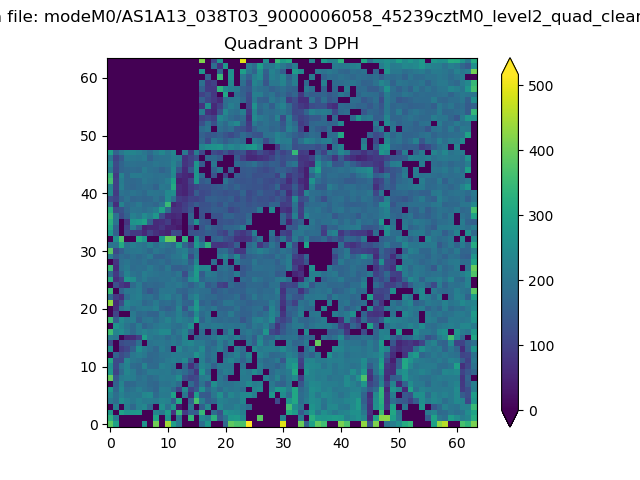 |
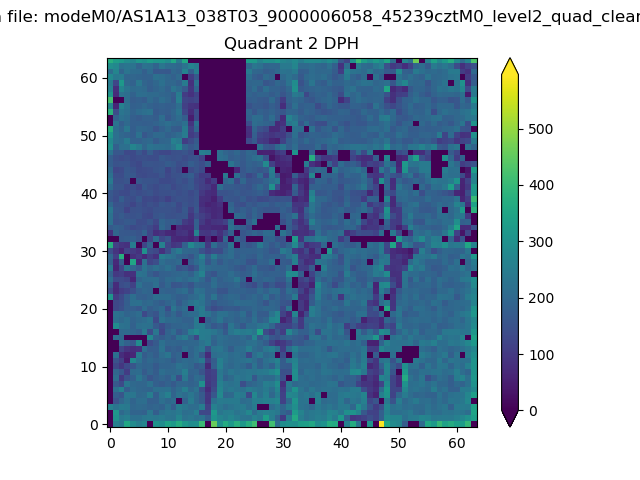 |
Quadrant C |
| Plot type | Count rate plots | Images |
|---|---|---|
| Comparison with Poisson distribution Blue bars denote a histogram of data divided into 1 sec bins. Red curve is a Poisson curve with rate = median count rate of data. |
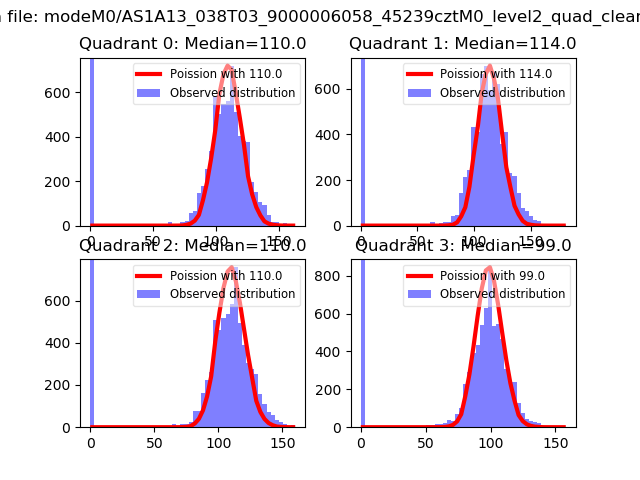 |
 |
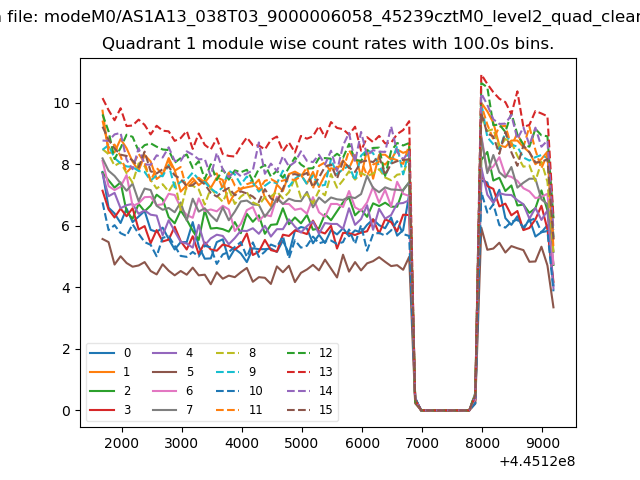
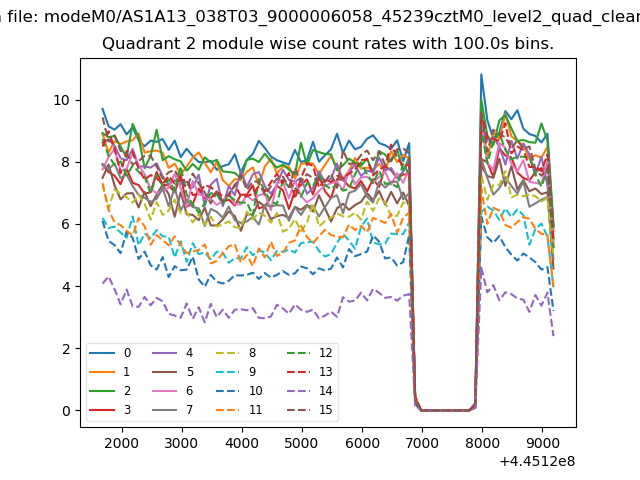
| Quadrant-wise count rates Data is divided into 100 sec bins |
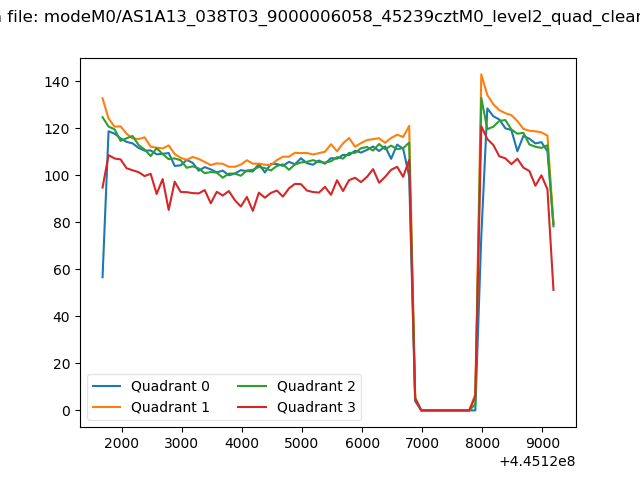 |
|
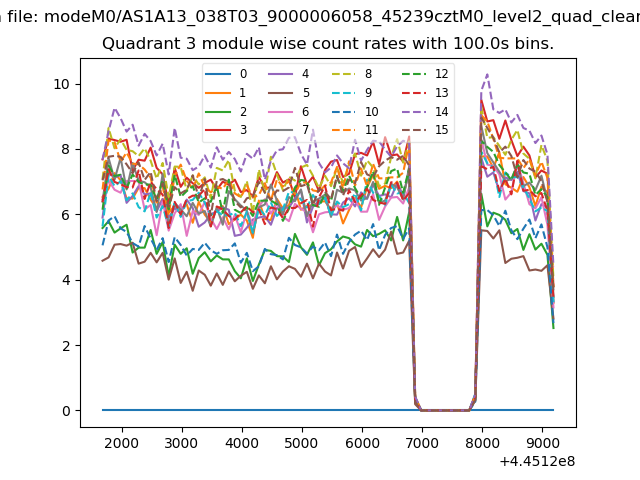
| Module-wise count rates for Quadrant A Data is divided into 100 sec bins |
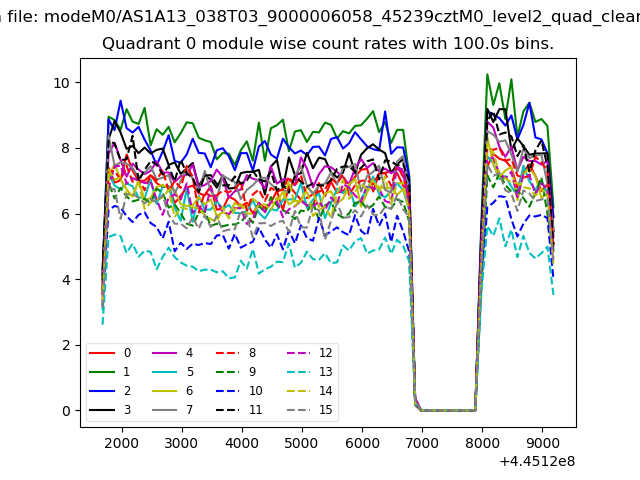 |
 |
| Module-wise count rates for Quadrant B Data is divided into 100 sec bins |
 |
 |
| Module-wise count rates for Quadrant C Data is divided into 100 sec bins |
 |
 |
| Module-wise count rates for Quadrant D Data is divided into 100 sec bins |
 |
 |
| Parameter | Plot |
|---|---|
| CZT HV Monitor |  |
| D_VDD | 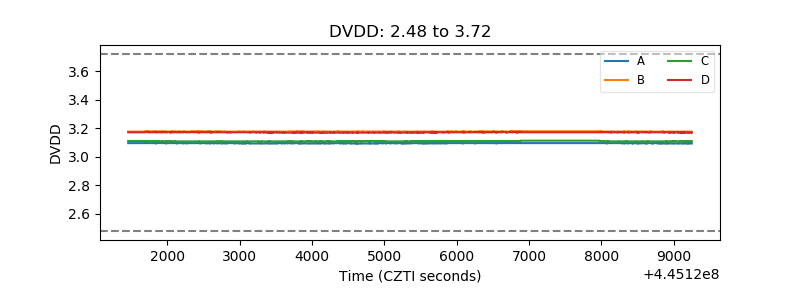 |
| Temperature 1 | 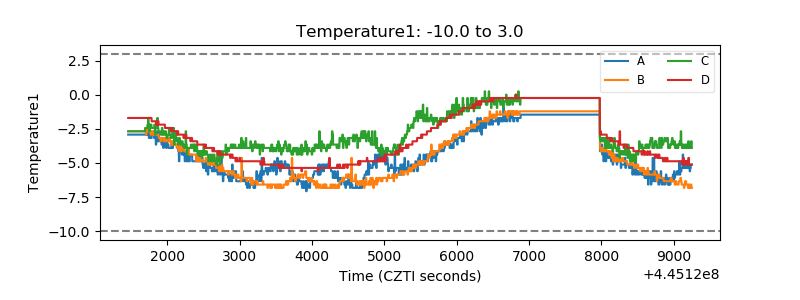 |
| Veto HV Monitor | 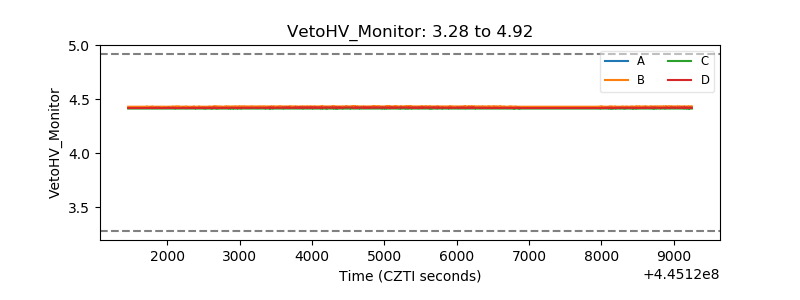 |
| Veto LLD | 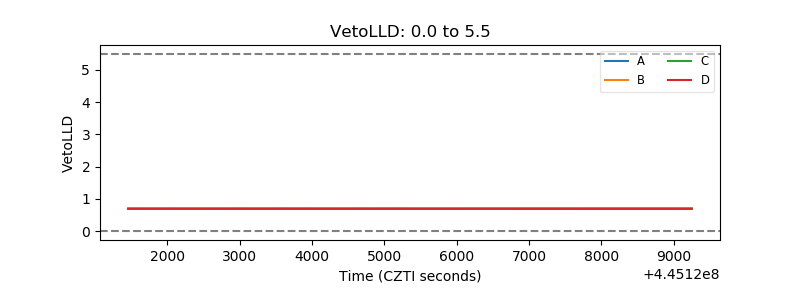 |
| Alpha Counter | 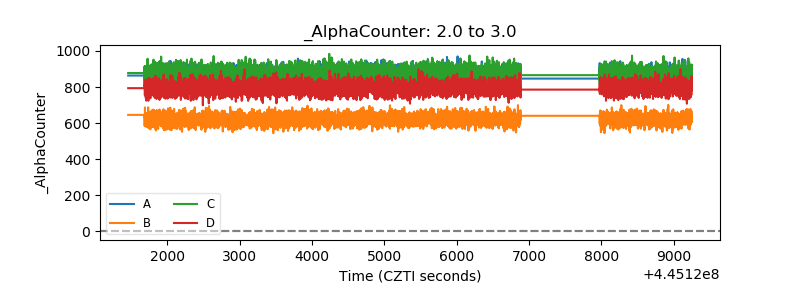 |
| _CPM_Rate | 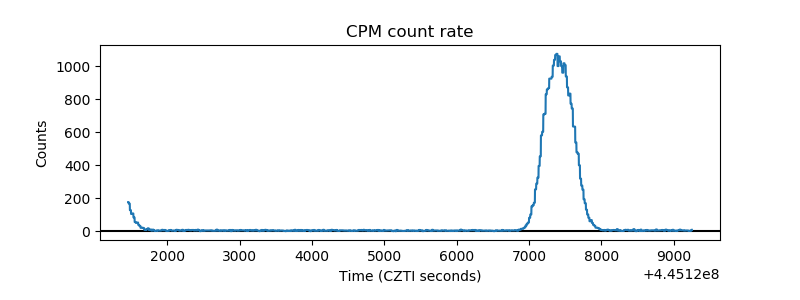 |
| CZT Counter | 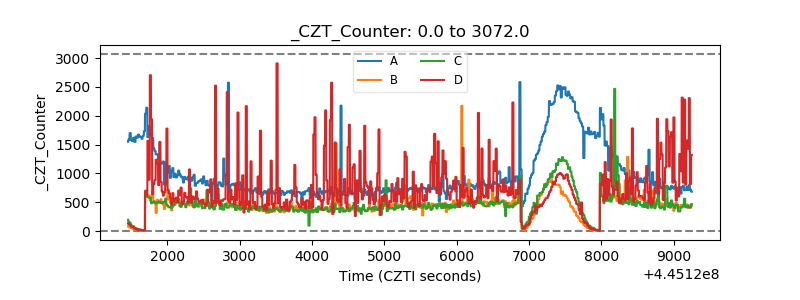 |
| +2.5 Volts monitor | 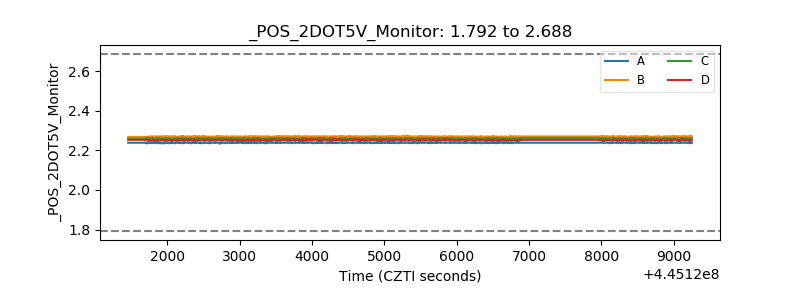 |
| +5 Volts monitor | 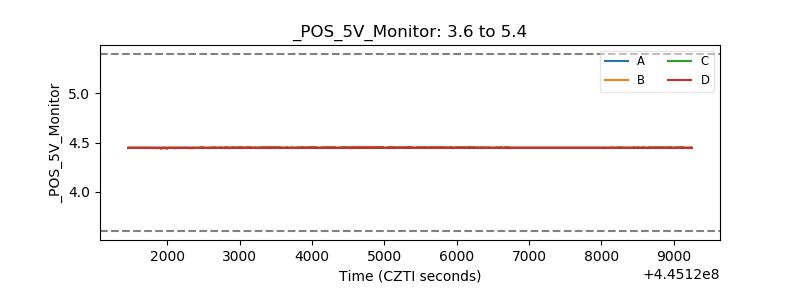 |
| _ROLL_ROT | 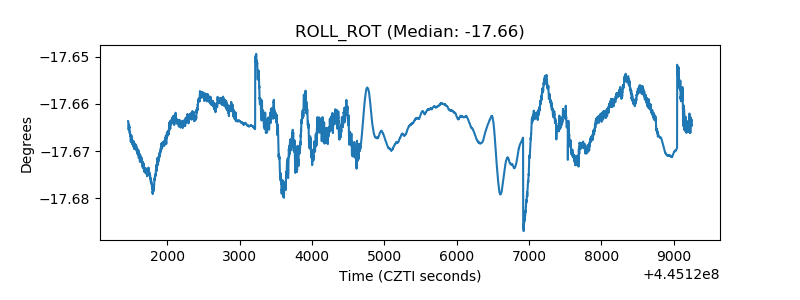 |
| _Roll_DEC | 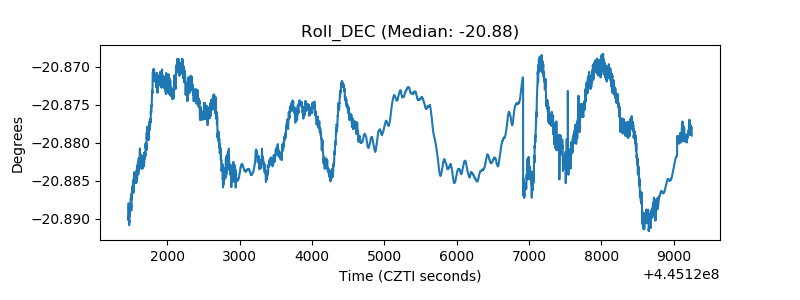 |
| _Roll_RA | 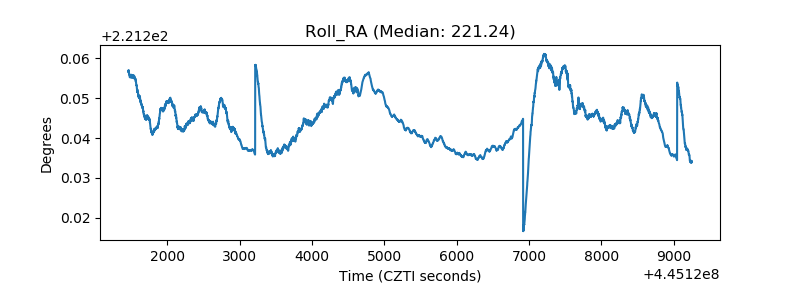 |
| Veto Counter | 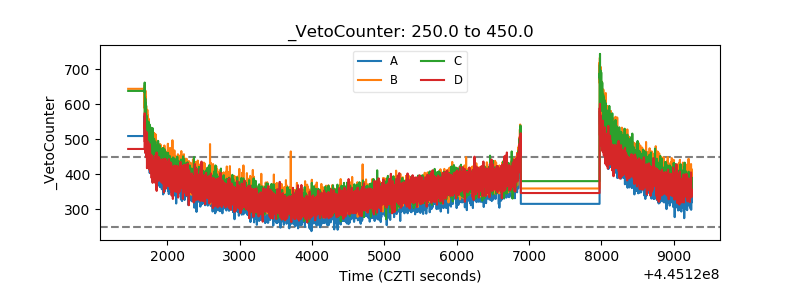 |