| Param | Original file | Final file |
|---|---|---|
| Filename | modeM0/AS1A13_038T03_9000006058_45240cztM0_level2.fits | modeM0/AS1A13_038T03_9000006058_45240cztM0_level2_quad_clean.evt |
| Size (bytes) | 505,195,200 | 105,629,760 |
| Size | 481.8 MB | 100.7 MB |
| Events in quadrant A | 5,248,102 | 703,332 |
| Events in quadrant B | 3,340,649 | 741,278 |
| Events in quadrant C | 3,311,609 | 715,260 |
| Events in quadrant D | 6,312,142 | 599,634 |
| Mode M0 | |||
|---|---|---|---|
| Quadrant | BADHDUFLAG | Total packets | Discarded packets |
| A | 0 | 20586 | 2 |
| B | 0 | 14146 | 2 |
| C | 0 | 14186 | 2 |
| D | 0 | 23144 | 2 |
| Mode M9 | |||
|---|---|---|---|
| Quadrant | BADHDUFLAG | Total packets | Discarded packets |
| A | 0 | 17 | 0 |
| B | 0 | 18 | 0 |
| C | 0 | 18 | 0 |
| D | 0 | 18 | 0 |
| Mode SS | |||
|---|---|---|---|
| Quadrant | BADHDUFLAG | Total packets | Discarded packets |
| A | 0 | 126 | 0 |
| B | 0 | 126 | 0 |
| C | 0 | 126 | 0 |
| D | 0 | 126 | 0 |
| Quadrant | Total seconds | Saturated seconds | Saturation percentage |
|---|---|---|---|
| A | 6295 | 186 | 2.954726% |
| B | 6295 | 117 | 1.858618% |
| C | 6295 | 109 | 1.731533% |
| D | 6295 | 666 | 10.579825% |
Noise dominated data is calculated using 1-second bins in cleaned event files. If a bin has >2000 counts, and if more than 50% of those come from <1% of pixels, then it is considered to be noise-dominated and hence unusable.
| Quadrant | # 1 sec bins | Bins with >0 counts | Bins with >2000 counts | High rate bins dominated by noise | Noise dominated (total time) | Noise dominated (detector-on time) | Marked lightcurve |
|---|---|---|---|---|---|---|---|
| A | 7471 | 6296 | 48 | 48 | 0.64% | 0.76% | 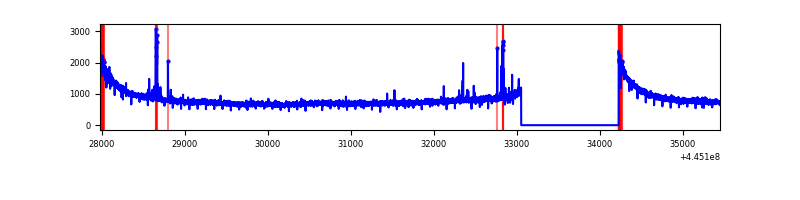 |
| B | 7471 | 6296 | 80 | 80 | 1.07% | 1.27% | 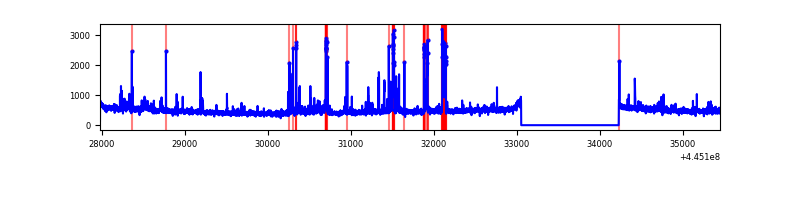 |
| C | 7471 | 6296 | 88 | 88 | 1.18% | 1.40% | 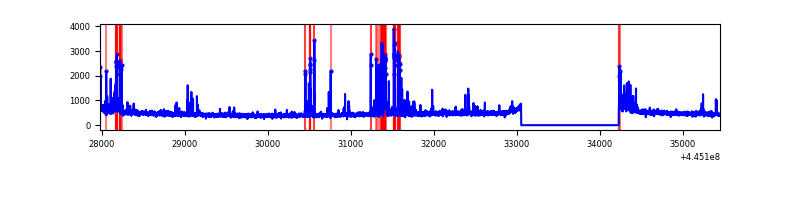 |
| D | 7471 | 6296 | 643 | 643 | 8.61% | 10.21% | 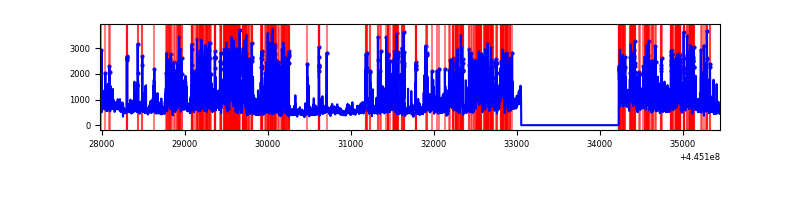 |
Top three noisy pixels from each quadrant. If the there are fewer than three noisy pixels in the level2.evt file, extra rows are filled as -1
| Pixel properties | Quadrant properties | ||||||
|---|---|---|---|---|---|---|---|
| Quadrant | DetID | PixID | Counts | Sigma | Mean | Median | Sigma |
| A | 10 | 83 | 2372192 | 15729.47 | 720 | 704 | 150.8 |
| A | 13 | 248 | 50532 | 330.5 | 720 | 704 | 150.8 |
| A | 4 | 0 | 21883 | 140.47 | 720 | 704 | 150.8 |
| B | 5 | 32 | 342606 | 2349.83 | 728 | 705 | 145.5 |
| B | 4 | 171 | 36928 | 248.95 | 728 | 705 | 145.5 |
| B | 5 | 172 | 33893 | 228.1 | 728 | 705 | 145.5 |
| C | 14 | 254 | 315170 | 1853.96 | 718 | 724 | 169.6 |
| C | 15 | 208 | 163934 | 962.28 | 718 | 724 | 169.6 |
| C | 3 | 233 | 14342 | 80.29 | 718 | 724 | 169.6 |
| D | 13 | 249 | 1649451 | 9570.28 | 681 | 661 | 172.3 |
| D | 11 | 241 | 721181 | 4182.21 | 681 | 661 | 172.3 |
| D | 5 | 235 | 404627 | 2344.79 | 681 | 661 | 172.3 |
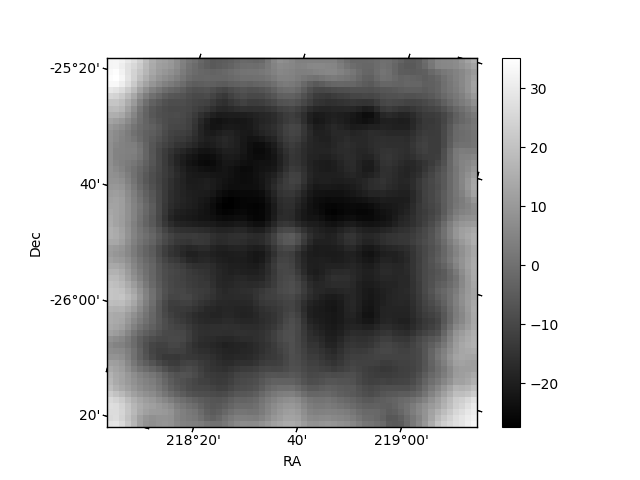
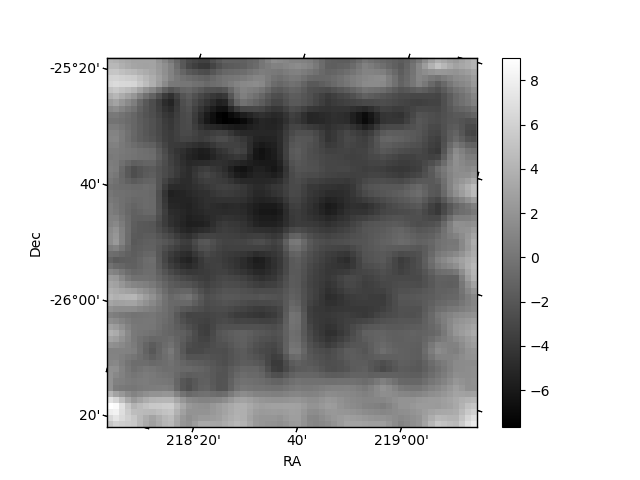
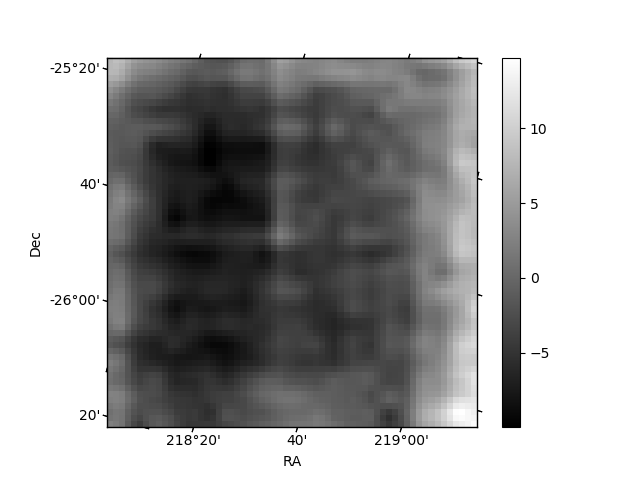
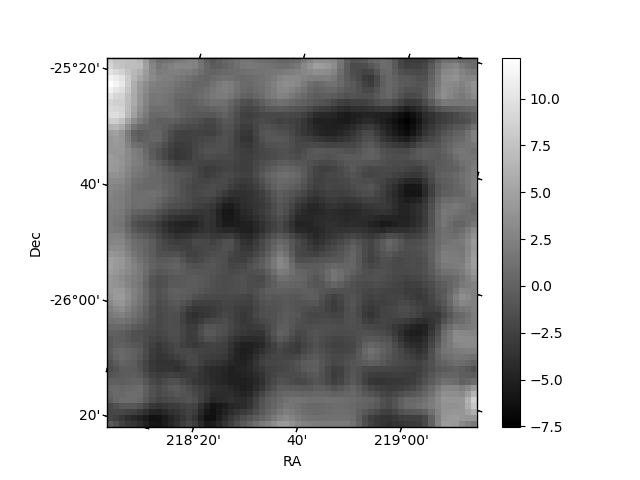
Histogram calculated using DETX and DETY for each event in the final _common_clean file
| Quadrant A | 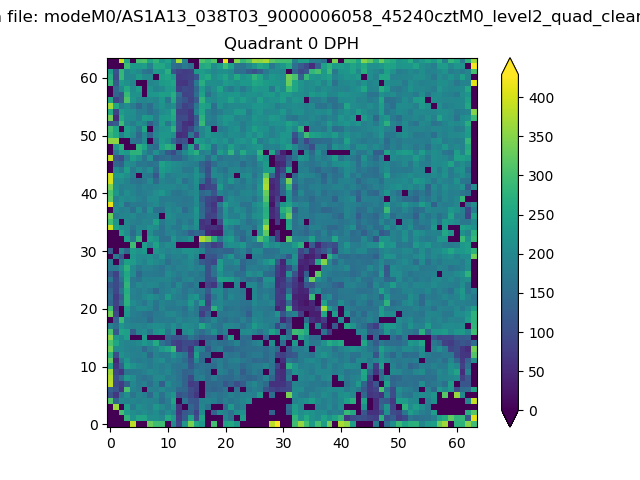 |
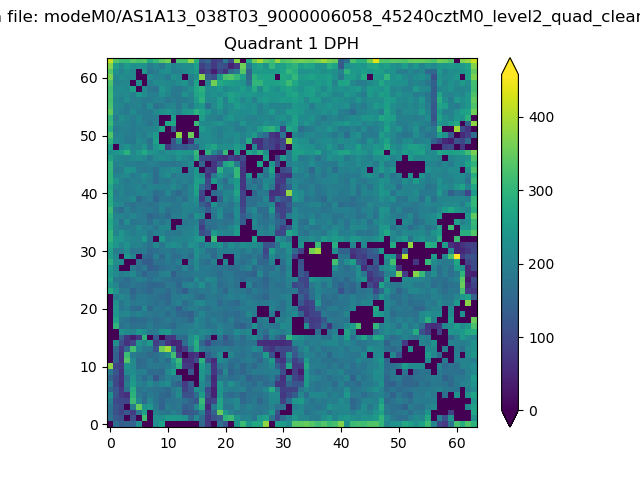 |
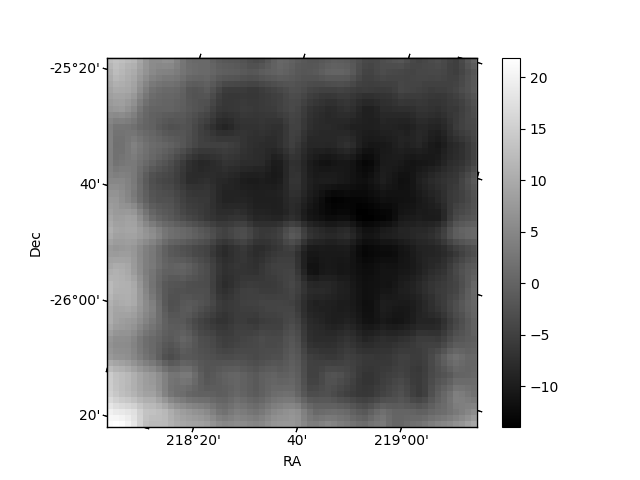
Quadrant B |
|---|---|---|---|
| Quadrant D | 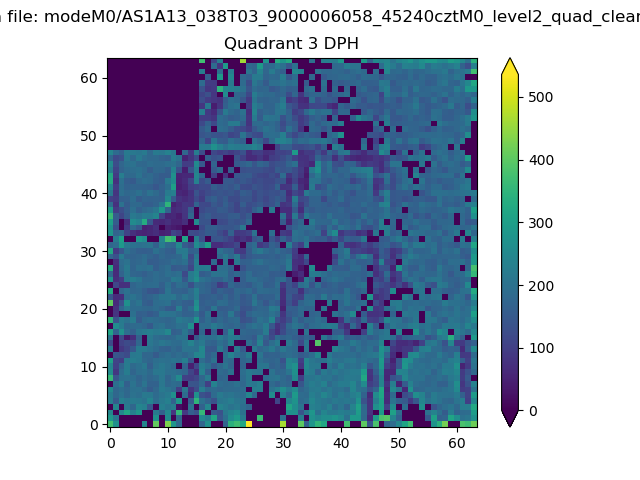 |
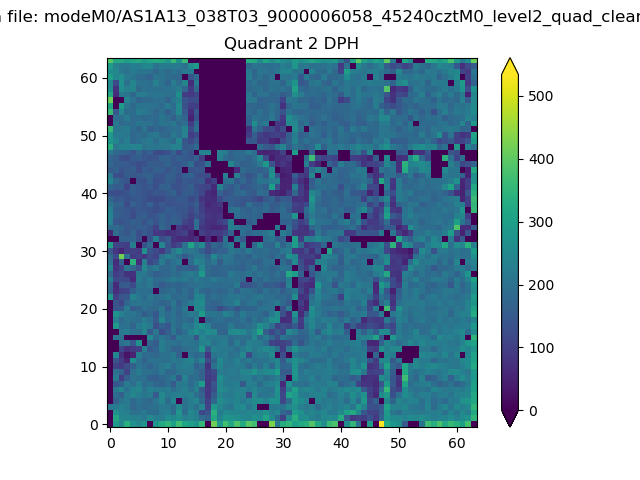 |
Quadrant C |
| Plot type | Count rate plots | Images |
|---|---|---|
| Comparison with Poisson distribution Blue bars denote a histogram of data divided into 1 sec bins. Red curve is a Poisson curve with rate = median count rate of data. |
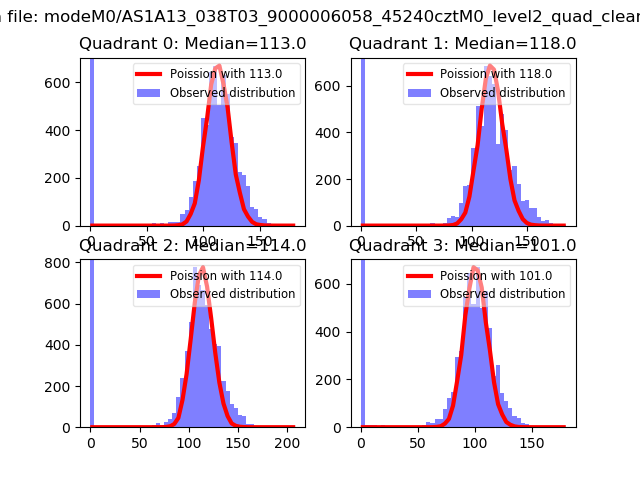 |
 |
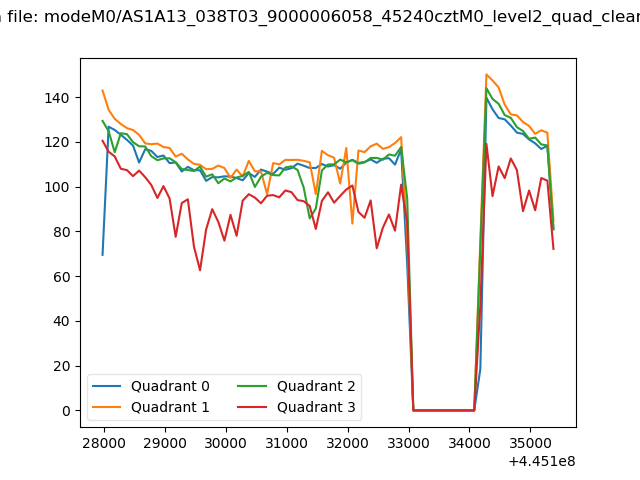
| Quadrant-wise count rates Data is divided into 100 sec bins |
 |
|
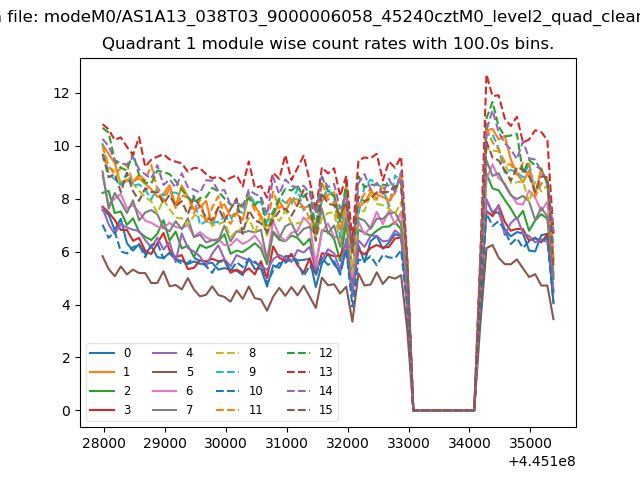
| Module-wise count rates for Quadrant A Data is divided into 100 sec bins |
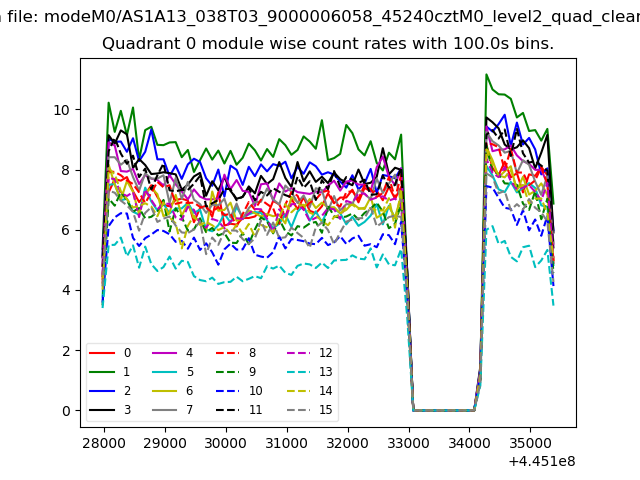 |
 |
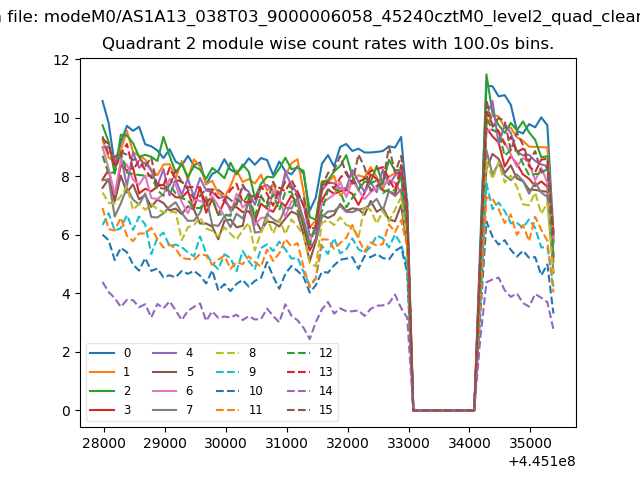
| Module-wise count rates for Quadrant B Data is divided into 100 sec bins |
 |
 |
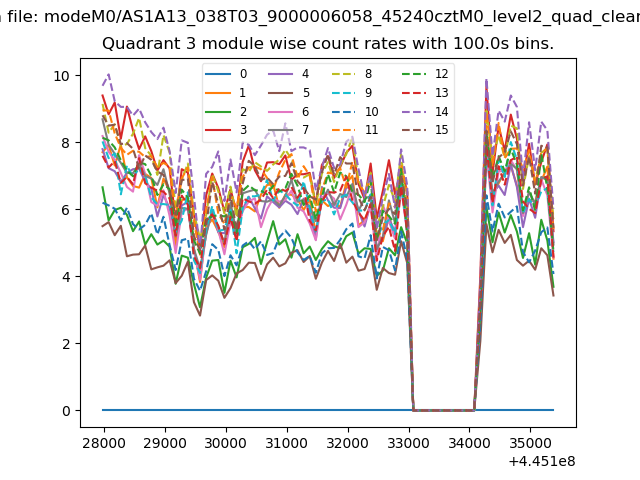
| Module-wise count rates for Quadrant C Data is divided into 100 sec bins |
 |
 |
| Module-wise count rates for Quadrant D Data is divided into 100 sec bins |
 |
 |
| Parameter | Plot |
|---|---|
| CZT HV Monitor | 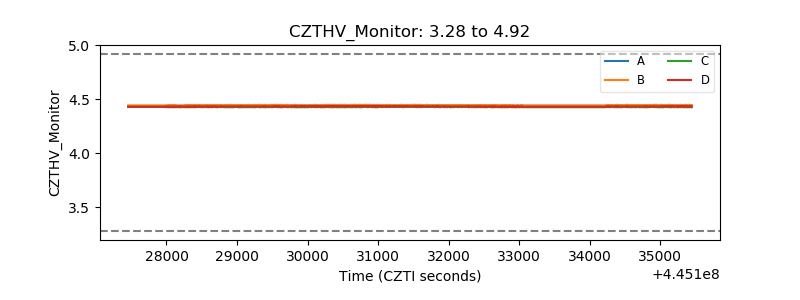 |
| D_VDD | 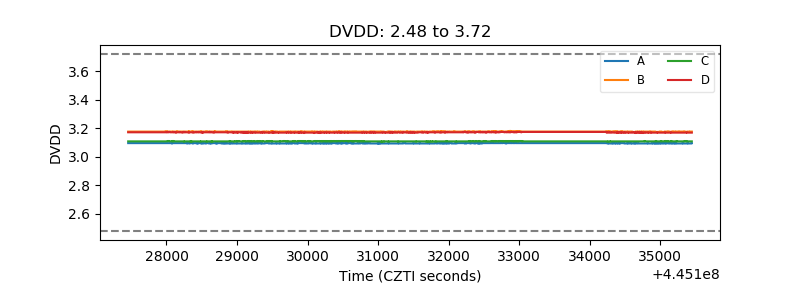 |
| Temperature 1 | 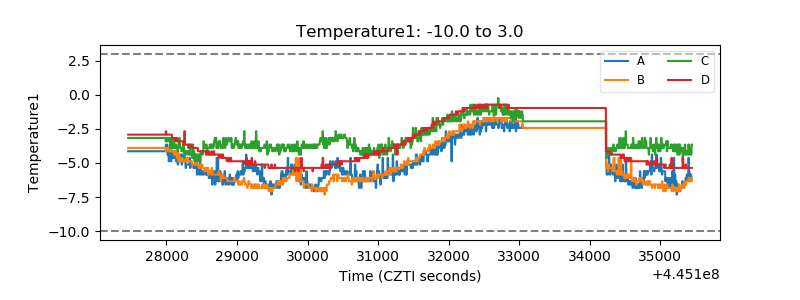 |
| Veto HV Monitor | 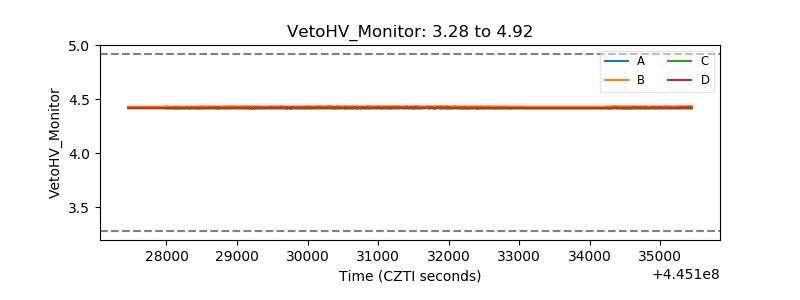 |
| Veto LLD | 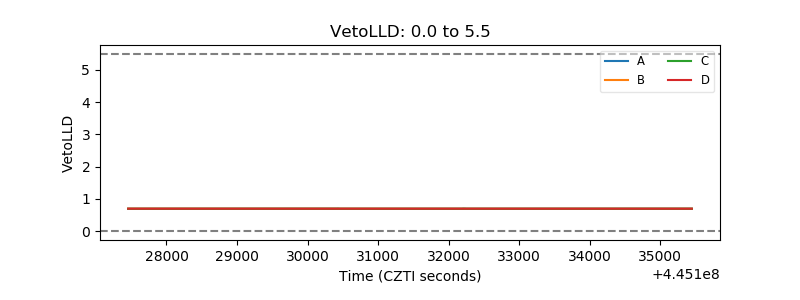 |
| Alpha Counter | 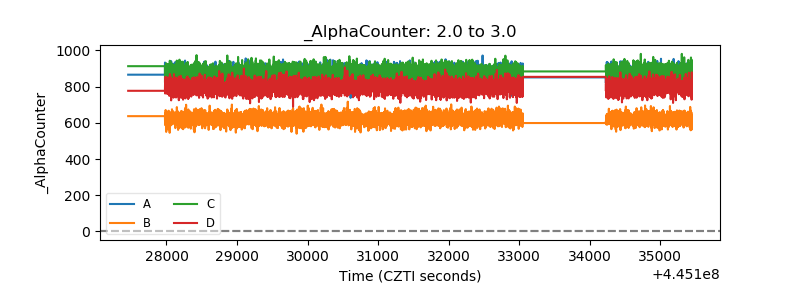 |
| _CPM_Rate | 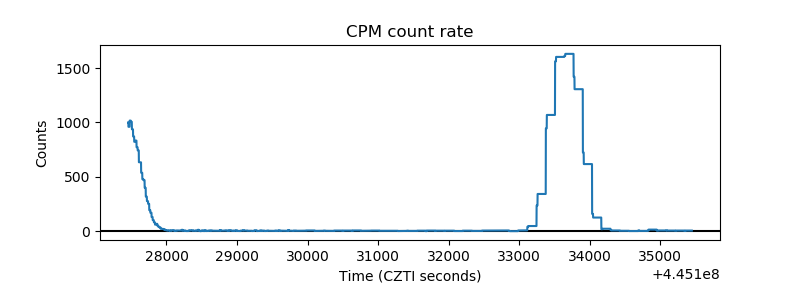 |
| CZT Counter | 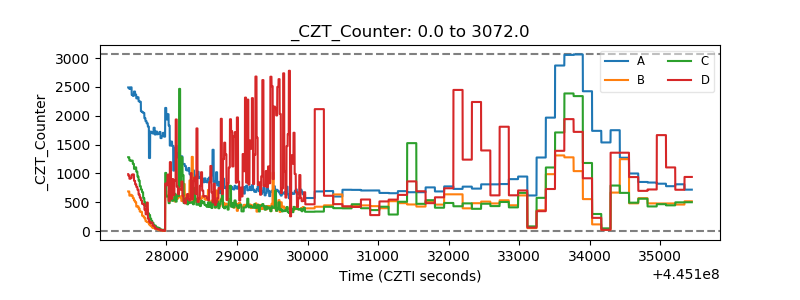 |
| +2.5 Volts monitor | 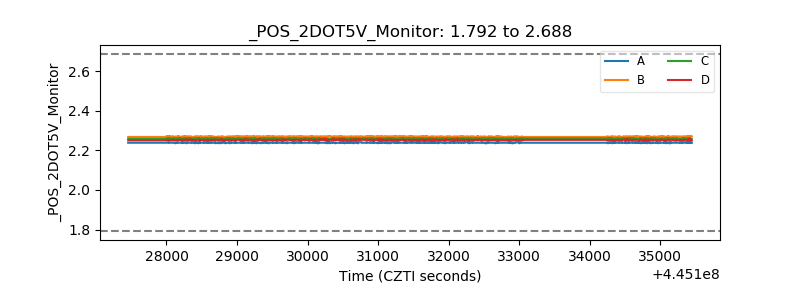 |
| +5 Volts monitor |  |
| _ROLL_ROT | 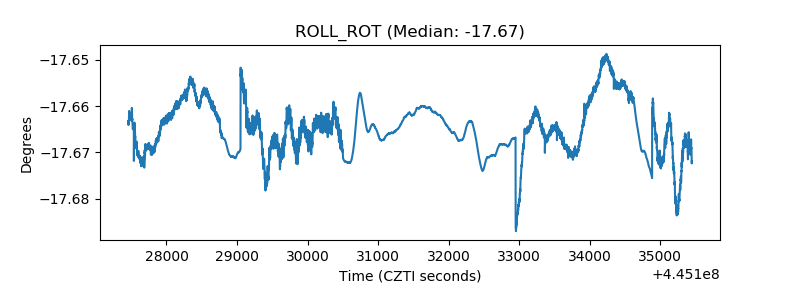 |
| _Roll_DEC | 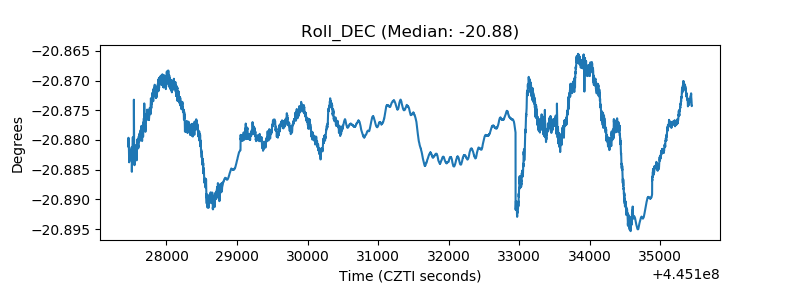 |
| _Roll_RA | 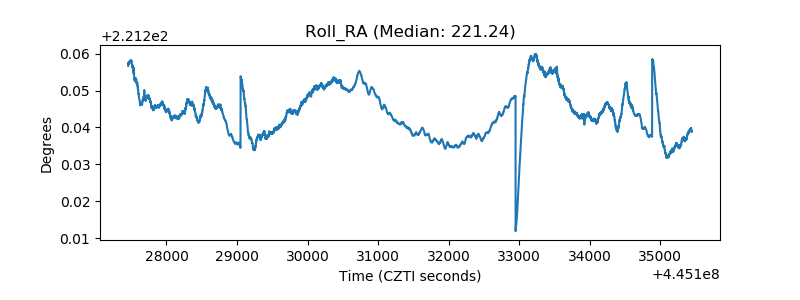 |
| Veto Counter | 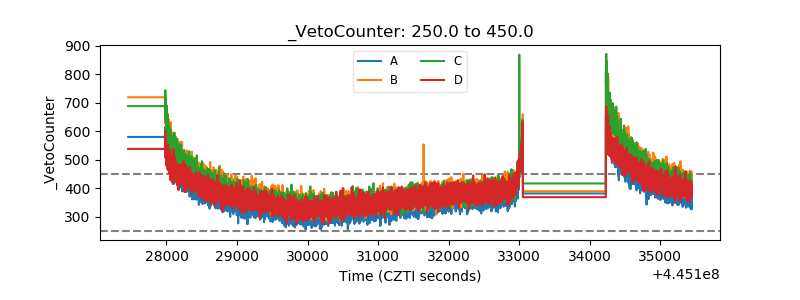 |